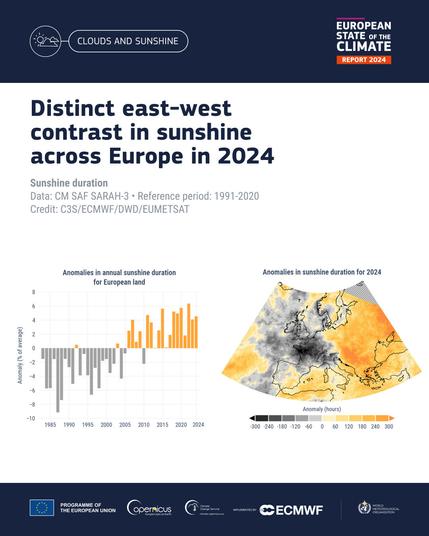
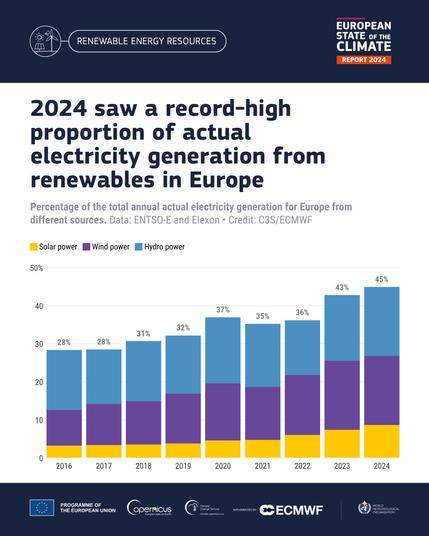
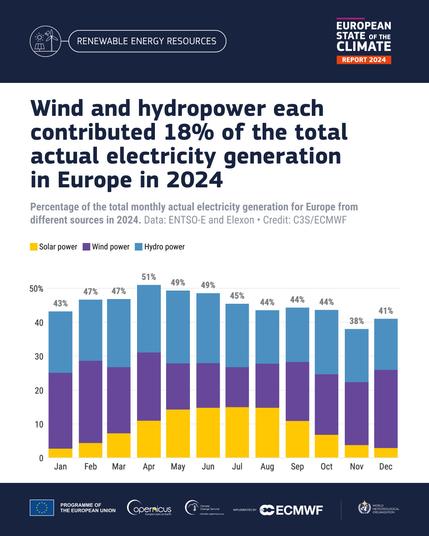
However, it was reported to be a record year for additions to total EU solar PV capacity. This meant that, despite the below-average climate-driven potential for solar PV power generation, the year as a whole saw an increase in actual solar electricity generation compared to 2023. Details here https://bit.ly/4jkX39a #ESOTC2024 #C3S
#C3S
Three charts based on #C3S’ ESOTC report you shouldn’t miss this month:
📈 Distinct east-west contrast in sunshine in 2024 – #C3S
1️⃣ https://bsky.app/profile/copernicusecmwf.bsky.social/post/3ln5psimtwh27
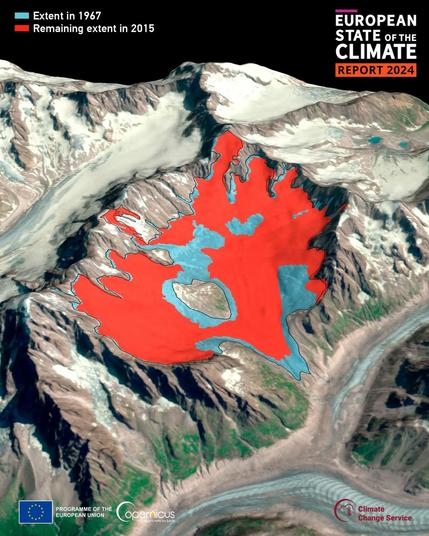
📈 Ice loss of the Talèfre Glacier in the French Alps between 1967 and 2015 – Copernicus_EU
2️⃣ https://www.instagram.com/p/DIf9pH6x2Ex/ / https://x.com/CopernicusEU/status/1912413601425666198/photo/1
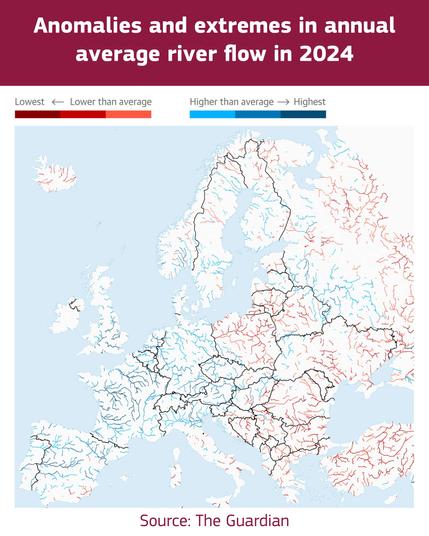
📈 Anomalies and extremes in annual average river flow in 2024 – The Guardian
3️⃣https://www.theguardian.com/environment/2025/apr/15/europe-storms-floods-and-wildfires-in-2024-affected-more-than-400000
Explore the full European State of the Climate Report: https://bit.ly/4llEy6q
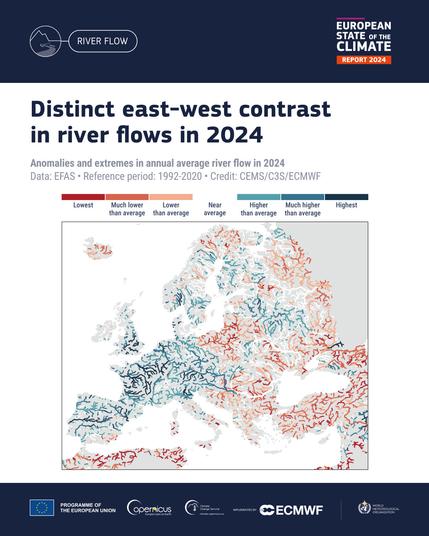
In 2024, Europe experienced a distinct east-west contrast in river flow. Some rivers in the west, like the Thames and Loire, reached record highs, while eastern Europe faced lower-than-average river flows much of the year, with the lowest November flows on record.
#ESOTC2024 #C3S
Discover more about the contrasts in climate conditions revealed by #ESOTC2024 in the latest Copernicus OBSERVER article published by #copernicuseu Get insight into warmest year on record, including data on heatwaves, flooding, glacier melt and more. #C3S
https://www.copernicus.eu/it/node/84926
#ESOTC2024 not only provides detailed analyses of Europe's climate in 2024, it also summarises long-term trends in key Climate Indicators for the globe and Europe. These include temperature, sea level, glaciers, ocean heat content, greenhouse gases and more. Explore the Climate Indicators dashboard. https://bit.ly/3YutBph #C3S
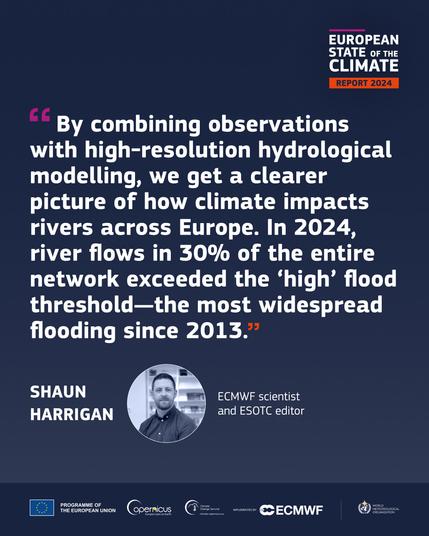
Learn more about how climate conditions impacted rivers and flooding in Europe in the #ESOTC2024 The distinct east-west contrast in climate conditions in 2024 was also clear in river flow data across Europe, and the year saw widespread flooding. #C3S @CopernicusEMS 💦 https://climate.copernicus.eu/esotc/2024?utm_source=socialmedia&utm_medium=TW&utm_campaign=esotc/2024
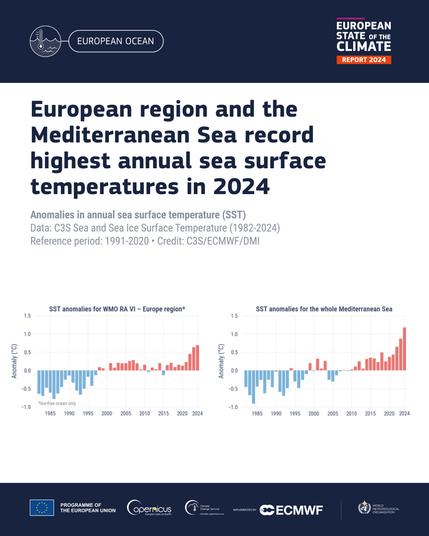
2024 saw the highest annual sea surface temperature on record for both the European region as a whole and the Mediterranean Sea. The Mediterranean also reached its highest recorded daily sea surface temperature during a severe marine heatwave in August. https://bit.ly/4lpzaz5 #ESOTC2024 #C3S
In 2024, Arctic sea ice extent was close to average until June, then fell well below average. In September, monthly sea ice extent was 19% below average, ranking fifth lowest in the satellite record. The year ended with the lowest December extent on record. https://bit.ly/4icbWts #ESOTC2024 #C3S
Over 130 charts and graphics bring climate data to life in the #ESOTC2024 Data visualisations communicate complex findings in a clear way and are the hallmark of the partnership between #C3S and @WMO along with scientists and data providers across the world.
https://climate.copernicus.eu/esotc/2024/graphics-gallery?utm_source=socialmedia&utm_medium=ma&utm_campaign=esotc%2F2024%2Fgraphics-gallery
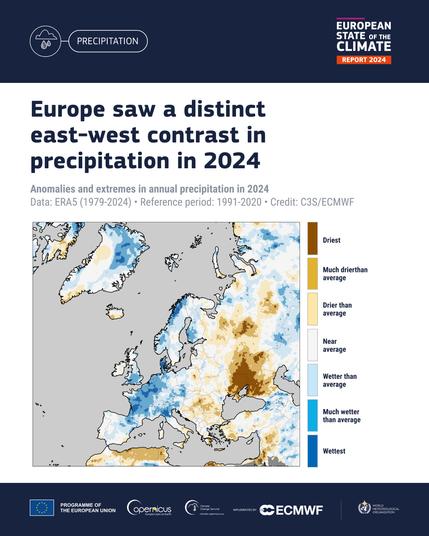
2024 showed a clear east-west contrast in precipitation across Europe. Western Europe experienced one of its ten wettest years in the last 75 years, while eastern Europe faced drier-than-average conditions. Delve into the data ➡️ https://bit.ly/4j8AfKl #ESOTC2024 #C3S
Der #Talèfre #Gletscher in den französischen #Alpen schrumpft dramatisch.
Eine Visualisierung aus dem aktuellen Bericht des #Copernicus Climate Change Service zeigt den Rückgang seit 1967.
Allein 2024 verloren Gletscher in den Alpen im Schnitt 1,2 Meter Eisdicke. Die Region zählt damit zu den am schnellsten schmelzenden weltweit.
https://www.copernicus.eu/en/media/image-day-gallery/decreasing-extent-talefre-glacier-france
#Klimawandel #Gletscherschwund #Alpen #C3S #EuropeanStateOfTheClimate #Klimakrise #Klimabericht
2024 saw renewables generate a record 45% of Europe's electricity. Renewable power generation and electricity demand are highly sensitive to environmental conditions, which are shaped by phenomena occurring across different timescales, from short-term weather events to long-term climate trends. https://bit.ly/4jkX39a #ESOTC2024 #C3S #wmo
All the major 2024 climate events in one comprehensive map. See the storms, wildfires and floods that affected 413,000 people in Europe in 2024, causing €18 billion in damages. Discover insights into heatwaves, coldwaves and climate resilience initiatives. 👉 https://climate.copernicus.eu/esotc/2024/key-events?utm_source=socialmedia&utm_medium=ma&utm_campaign=esotc%2F2024%2Fkey-events
#ESOTC2024 #C3S
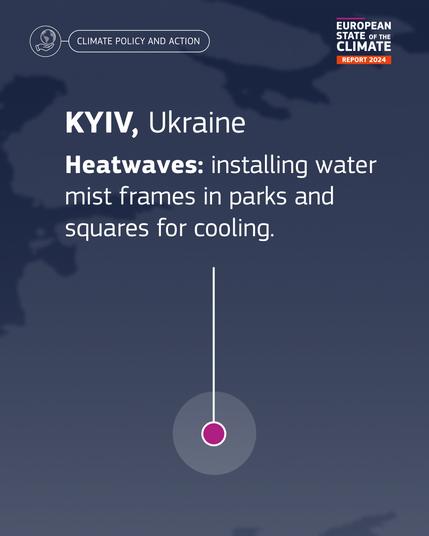
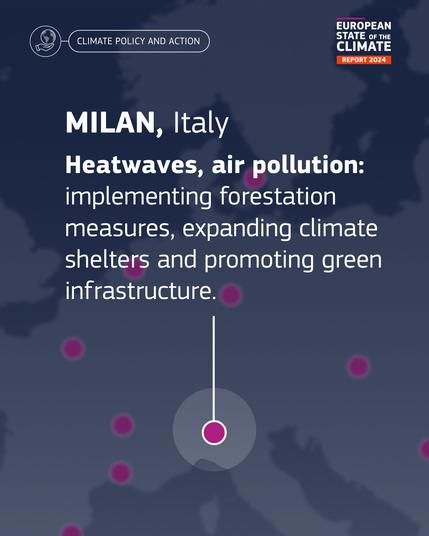
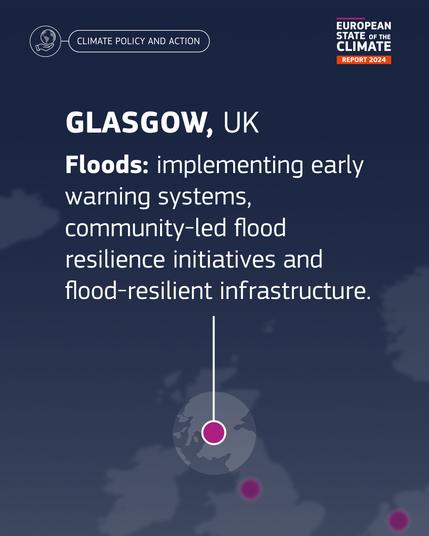
Discover what cities across Europe are doing to build resilience to extreme weather events and climate change. Explore the interactive key events map in the #ESOTC2024
highlighting adaptation initiatives, including early warning systems, green infrastructure, reforestation and more.
https://bit.ly/4llEy6q
A rise in frequency and intensity of extreme weather events poses risks to Europe’s infrastructure. Projected damage may increase tenfold by 2100. 51% of cities now have adaptation plans, up from 26% in 2018. Read more in the #ESOTC2024. https://bit.ly/4coeAuU
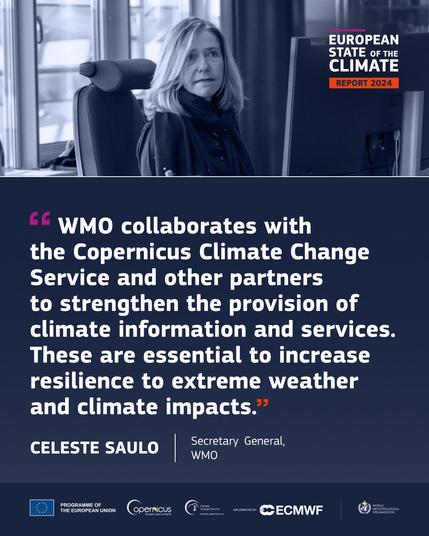
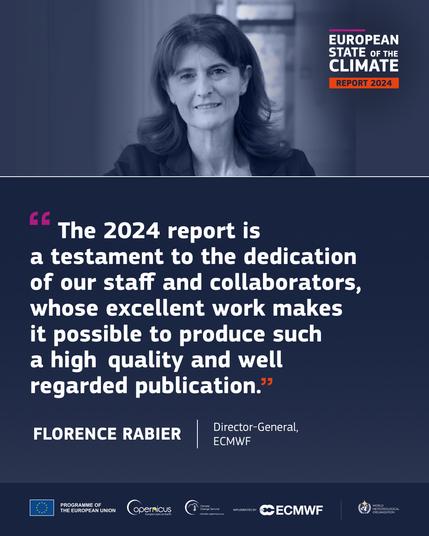
#ESOTC2024 is a testament to the power of collaboration. Published jointly by #C3S and #wmo global partners and scientists, its data and insight build climate resilience and awareness. Discover the report https://bit.ly/4llEy6q
Every chart, data insight and key finding in the #ESOTC2024 is the result of international teamwork. A collective effort by #C3S—implemented by #ECMWF and supported by the European Commission—alongside WMO and contributors worldwide, the report drives critical understanding of our evolving climate. 👉 https://bit.ly/4llEy6q
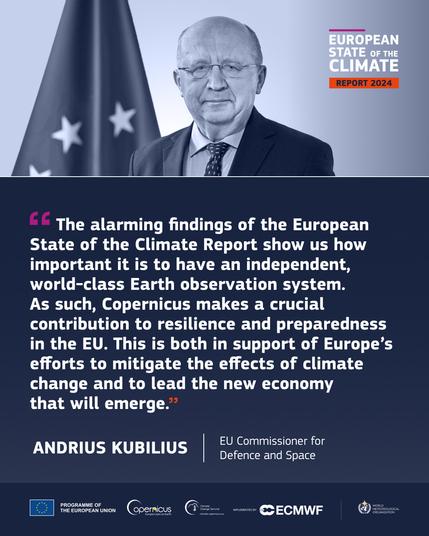
The #ESOTC2024 report underscores the vital role of Copernicus and services like #C3S in strengthening Europe's resilience and preparedness for climate change, driving mitigation efforts and a more sustainable future for Europe. https://bit.ly/4llEy6q
