#DashBoard

2025-06-28

Incredible tool!

“Developed by University of California Los Angeles (UCLA), the tool helps fill in gaps as the Trump administration takes a sledgehammer to federal climate, race, and ethnicity data resources.

“We want to provide facts, reliable data sources. We don’t want this to be something that gets erased from the policy sphere,” says Arturo Vargas Bustamante, faculty research director at the UCLA Latino Policy and Politics Institute (LPPI).

“We don’t want this to be something that gets erased”
The Latino Climate & Health Dashboard includes data on extreme heat and air pollution, as well as asthma rates and other health conditions — issues that are linked to each other. High temperatures can speed up the chemical reactions that create smog. Chronic exposure to fine particle pollution, or soot, can increase the risk of a child developing asthma.“

#latino #heat #neighborhood #extreme #news #dashboard #ucla #ca
theverge.com/climate-change/69

christian 🎧☕️🏃‍♂️chpusch
2025-06-25

Klimadashboard: Das ist wirklich cool! Die sowie Ausbau der erneuerbaren Energien, Entwicklung Mobilität (Fokus Auto), etc. je Region in Dashboards super aufbereitet.

klimadashboard.de/regions/b035

2025-06-25

1992 betrug das BIP in #SachsenAnhalt 25,8 Mrd. EUR, bis 2024 stieg es auf 79,4 Mrd. EUR. Diese und andere Kennzahlen der Volkswirtschaftlichen Gesamtrechnungen finden Sie nun im neuen #Dashboard »VGR #Monitor der Länder«:
📊lsaurl.de/VGRMonitor
📰lsaurl.de/6gWo5w

IB Teguh TMteguhteja
2025-06-22

Master Odoo dashboard theory and turn your data into decision-driving visuals! This essential guide breaks it all down.

teguhteja.id/odoo-dashboard-th

VerzatileDevverzatiledev
2025-06-21

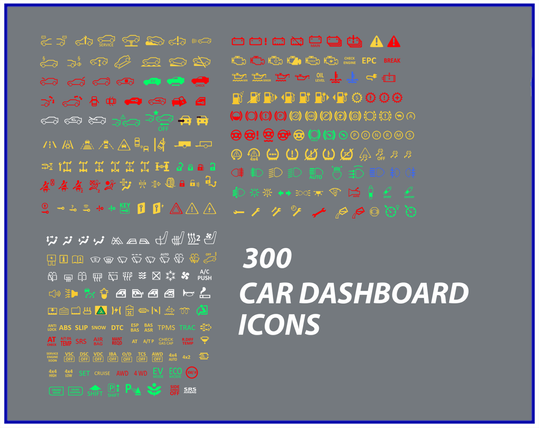
Released a new Asset "Car Dashboard icons", get started on making your racing or car oriented games, see more down below!

verzatiledev.itch.io/car-dashb

Car Dasboard icons by VerzatileDev
2025-06-21

Представляю @vue-dnd-kit/components: Готовые компоненты для быстрой разработки интерфейсов с перетаскиванием

Представляю @vue-dnd-kit /components — готовые компоненты для быстрой разработки drag & drop интерфейсов в Vue 3! 📋 Сортируемые таблицы 📊 Канбан-доски 🌳 Древовидные структуры 🧩 Интерактивные дашборды CLI работает как shadcn/ui — компоненты клонируются в ваш проект, давая полный контроль над кодом. Проект в активной разработке, но уже готов к использованию! Готовые компоненты: Table, Kanban, Tree, Dashboard. Статус: бета, API может изменяться. Подходит для прототипов и активной разработки.

habr.com/ru/articles/920620/

#vue #kanban #dashboard #draganddrop #draggable #frontendразработка #unstyled #dnd

Green Webpagegreenwebpage
2025-06-21

In this article, you will learn how to install Webmin on Debian 12 and how to configure access to the Webmin interface.

Keep reading:👇
greenwebpage.com/community/how

WBCOM DESIGNSwbcomdesigns@me.dm
2025-06-19

What plugins do you pair with your theme to enhance vendor dashboards?
Let's know your pick!
#wordpress #vendor #dashboard #community #marketplace #engagement #ecommerce

Josep Bigorra 🐂🇳🇱🎸👨‍💻jjba23
2025-06-19

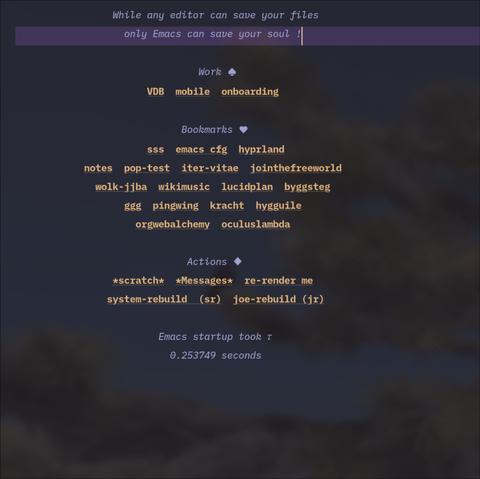
welkomscherm, my package for a cozy / screen has reached v1.0.4

codeberg.org/jjba23/welkomsche

I now implemented a flexible and customizable rendering algorithm which allows you to change everything (via a list of thunks). I also provide some convenience setup (with bookmarks/work/actions) but you are free to change as you please. Some hooks are also provided

The project is now also better documented. I am happy to hear your feedback, ideas and experiences

show welkomscherm
2025-06-18

Anything out of place? I spent a few hours integrating base #css for applications embedded in the site, removed scrollbars (who likes scrollbars!??) and some other fixes. Let me know if you like it! - Let me know even If you don't like it, I will redirect you to /dev/null 😆

woodpeckersnest.space/

#selfhosting #dashboard #wpn #fedifriends

2025-06-16

Alarmierende Studie von BUND: 201 von 401 Landkreisen in Deutschland leiden unter Grundwasserstress - es wird mehr Wasser aus dem Boden entnommen als sich neu bilden kann.

Wie gut könnte man aus den Daten ein offenes, deutschlandweites Grundwasser-Dashboard erstellen, stattdessen bleiben die Daten hinter einer PDF-Datei gefangen.

#grundwasser #dashboard #opendata

2025-06-11

Как настроить мониторинг, чтобы не проспать проблему

Все мы с этим сталкивались: вроде бы сервис работает, графики зелёные, ресурсы свободны — а пользователи всё равно жалуются. Открываешь мониторинг — CPU в порядке, память не забита, места на диске полно. А люди продолжают писать: «У вас тормозит». Знакомо? Давайте разберёмся, как настроить мониторинг так, чтобы проблемы ловились сразу — ещё до того, как начнут ломиться сообщения в поддержку.

habr.com/ru/articles/917658/

#мониторинг #grafana #loki #дашборд #dashboard #elk #elk_stack #api #логи #логирование

nerdcafe Podcastespresso@nerdcafe.online
2025-06-10

In dieser Episode schauen wir uns das komplette WordPress Dashboard einmal an.

https://nerdcafe.online/episoden/078-das-komplette-wordpress-dashboard/

078 Das komplette WordPress Dashboard
Hobbyblogging.dehobbyblogging
2025-06-09

Mal ehrlich, was macht ein Dashboard bei Home Assistant eigentlich so besonders? Es ist nicht nur ein schickes Design, sondern die Möglichkeit, alles nach deinen Wünschen zu steuern und Informationen auf einen Blick zu sehen. Schau dir an, wie ich mein Dashboard angepasst habe: hobbyblogging.de/home-assistan

olli.dev ✅Olli_dev
2025-06-07

Kennst du schon die Status-Card für Home Assistant? Über HACS super einfach installiert und unheimlich individuell konfigurierbar bietet sie DAS Upgrade für deine Dashboards!

youtu.be/z4j6qpBgrYU

🏳️‍⚧️ Christin Löhner 🏳️‍🌈christin@lsbt.me
2025-06-06

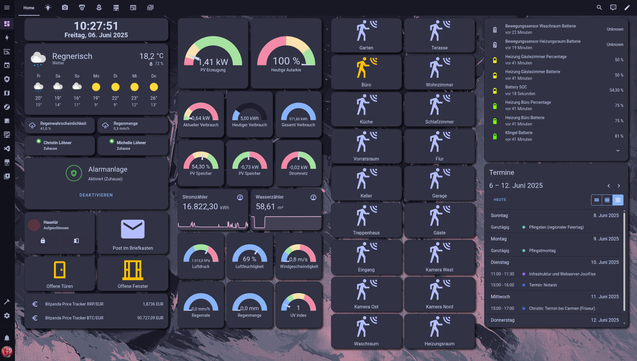
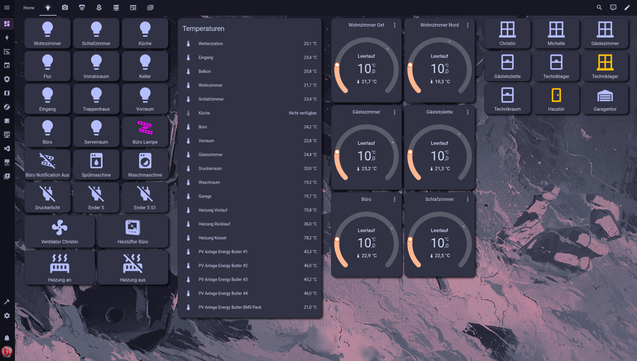
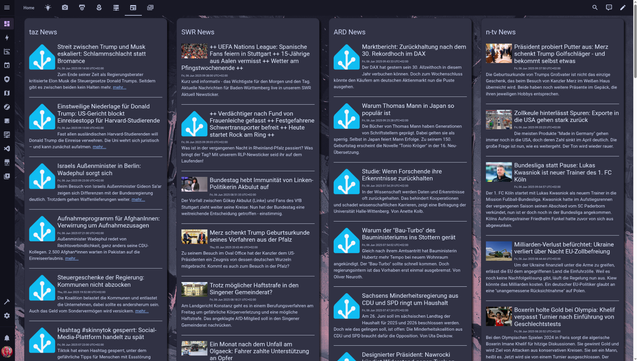
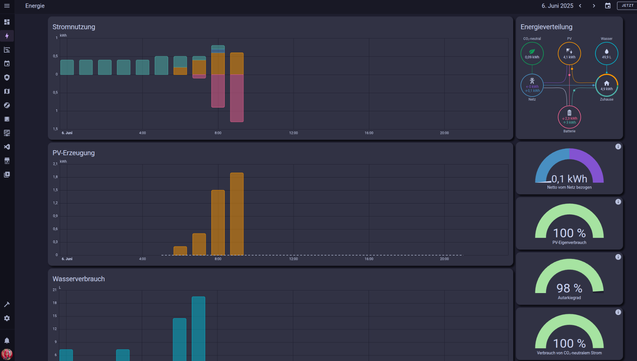
Unser aktuelles Home Assistant #Dashboard. ❤️ 😍

Die acht Kameras, sowie die Anzeige der privaten und geschäftlichen Webseiten die ich überwache, habe ich hier jetzt mal weg gelassen, aus Datenschutzrechtlichen Gründen.

Im Ganzen haben wir aktuell 439 Geräte, mit insgesamt 3146 Entitäten (Datenpunkte) in unserem #HomeAssistant integriert. Dazu gehören unzählige smarte Deckenlampen, Glühbirnen, #SONOFF Schalter, 17 Bewegungssensoren, neun Tür/Fenster Kontakte, acht Kameras die ebenfalls auch als Bewegungssensoren fungieren, zehn Smarte #Zigbee Steckdosen, viele #ESP32 und #ESP8266 die jeweils #Temperatur, #Luftdruck und #Mikrowellenradar (Präsenzsensoren) bereitstellen, sechs Smarte Heizungsthermostate, ein #Aqara Door Lock, eine EasyWeather Pro #Wetterstation, eine große PV Anlage (11 kWp) mit Speicher (11 kW), drei 3D Drucker, Pflanzensensoren und Vieles mehr.

Sogar unser Briefkasten teilt uns per #Alexa Ankündigung mit, wenn Post eingeworfen wird.

Insgesamt laufen bei uns 103 Automationen, die das Haus automatisch überwachen und steuern (Thermostate, Lampen, etc.).

Alles ist per #Sprachbefehl über neun, im Haus verteilte Alexas, sowie über das Dashboard ein- und ausschaltbar, bzw. abfragbar.

Langsam aber sicher kommen wir an den Punkt, an dem wir unser perfektes #SmartHome haben. ❤️ :heart_trans: :heart_trans:

2025-06-05

An 'old 'post from 2022 but an end-to-end analytics solution like this on one box still sounds rather fabulous to me.

"A fast, free, and open-source Modern Data Stack (MDS) can now be fully deployed on your laptop or to a single machine using the combination of DuckDB, Meltano, dbt, and Apache Superset."

"duckdb.org/2022/10/12/modern-d

#DuckDB #Meltano #DBT #ApacheSuperset #DataAnalysis #Dashboard

Karsten Schmidttoxi@mastodon.thi.ng
2025-06-05

"Eventually, I stopped responding to my body. I was responding instead to a dashboard." — @Daojoan

This is a great point and very much translates to so many other parts of life/work where people stop listening to their "body" (or to their org/product/offering), outsourcing/numbing/dumbing down their decision making based on dashboards of collected metrics and then changing their behaviors on auto-pilot to improve said metrics — without ever asking themselves if the data collected actually represents answers to the right (or even important) questions...

Metrics always invite comparison & competition — on a global scale — often without considering our own subjective contexts/needs/limits/aims...

Does the number of copilot prompts per day on a CTO dashboard indicate a highly productive developer or does a big fat zero merely show a different approach to problem solving?

Does the lack of constant updates to a FLOSS project mean it's become neglected/unusable or does it simply indicate it reached a level of stability?

Likewise, does my product/app need constant UI changes/updates to "streamline" user experience (often without even consulting users) based on some "goal" metrics?

Am I seen as an unproductive FLOSS developer if my public commit log doesn't show daily updates? Do gaps indicate laziness, illness, deep thinking or work on other projects? Like gaps in a CV, will these gaps of activity data hinder future employment chances or would I even want to work with orgs who select on this criteria?

Is a hike only good/better because it exceeds X kilometers or Y elevation meters? How does one measure the stunning views or the quality of the company which shared that experience?

joanwestenberg.com/why-i-gave-

#Blog #Dashboard #QuantifiedSelf #DataViz #Behavior #DecisionMaking

Client Info

Server: https://mastodon.social
Version: 2025.04
Repository: https://github.com/cyevgeniy/lmst