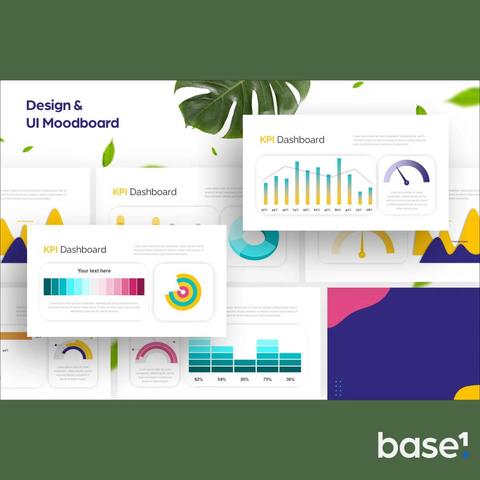
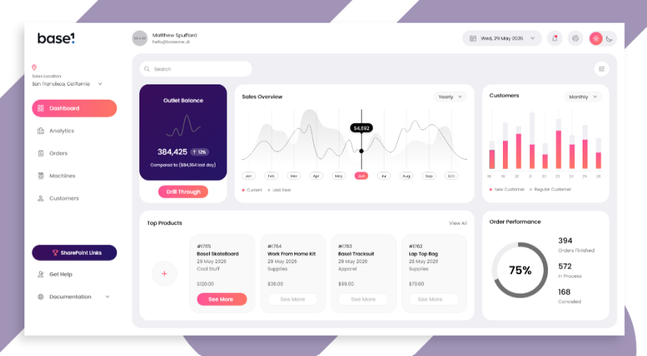
How to Nail Your Colour Choices in Power BI 🎨
✔️ Brand palettes = consistency
✔️ Colours tell stories (green = good, red = alert)
✔️ Use JSON themes for polished designs
✔️ Test on all devices
Find all 10 tips on my LinkedIn: Matthew Spuffard 🚀 https://www.linkedin.com/feed/update/urn:li:activity:7272524827045867522/
#PowerBI #DataDesign #ColourTips #BaseOne #MatthewSpuffard
#DataDesign
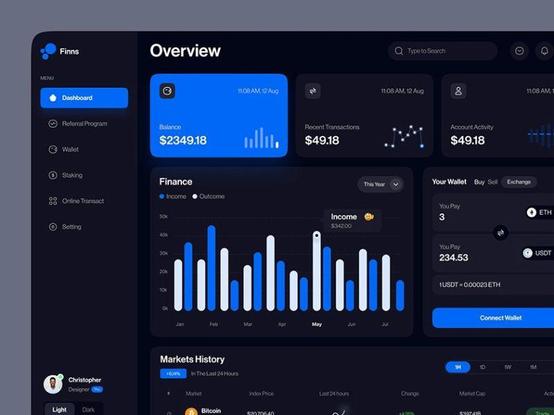
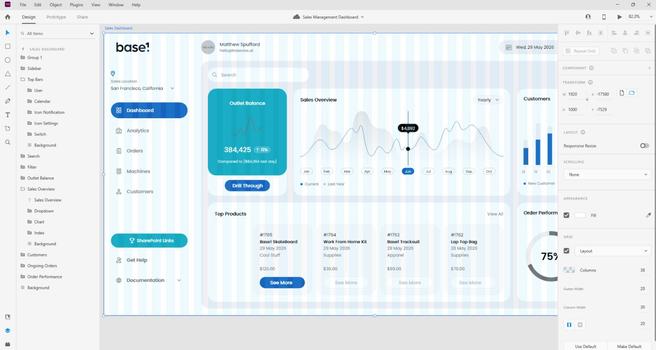
Rounded bars on Power BI bar charts—who’s with me? 🙋
Clean, modern #UIUX matters! This design rocks and could make dashboards look so much better. Let’s push for these little improvements that make a big difference!
For more design ideas, visit my LinkedIn: Matthew Spuffard https://www.linkedin.com/in/matthewspuffard/🚀
#PowerBI #DataDesign #DashboardTips
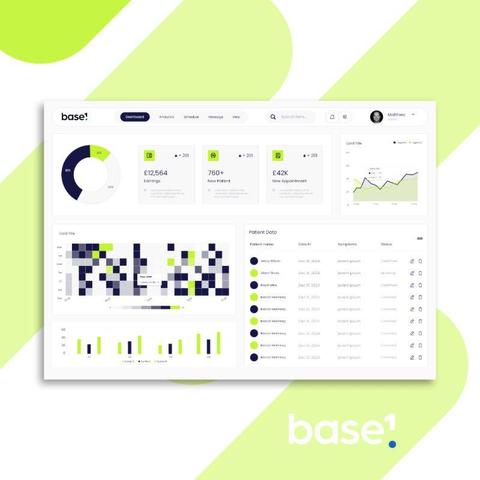
Power BI design directly impacts decision-making efficiency. 🎯
Here are 10 tips to make it work for you:
1️⃣ Design for aesthetics—better-looking dashboards feel easier to use.
2️⃣ Highlight key KPIs with visual hierarchy.
3️⃣ Simplify—focus on core metrics, not clutter.
4️⃣ Use intentional colours to guide users.
5️⃣ Add interactivity with slicers, filters, and drill-throughs.
Want all 10 tips? Visit my LinkedIn for the full post: Matthew Spuffard 🚀
#PowerBI #DataDesign #Efficiency
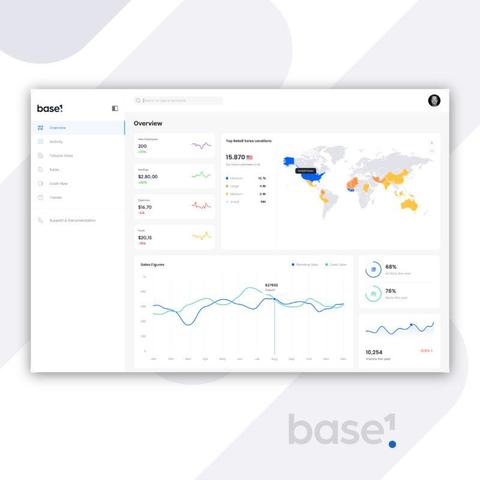
White space: the most underrated design tool in Power BI! 🌌
It’s more than “empty space.”
White space:
🧠 Makes dashboards clearer & reduces overwhelm.
🎯 Highlights key insights & KPIs.
📐 Adds a clean, professional finish to your reports.
👉 Use grids, margins & padding to let your visuals breathe.
Want more Power BI design tips? Visit my LinkedIn for the full guide: Matthew Spuffard https://www.linkedin.com/in/matthewspuffard/ 🚀
#PowerBI #DataDesign #WhiteSpace
⚡ 3 Easy Ways to Speed Up Power BI Report Design 📊
Save time without compromising quality:
1️⃣ Use templates for instant layouts & themes.
2️⃣ Apply a JSON theme to style your report in one go.
3️⃣ Use a grid for perfect visual alignment every time.
Which hack will you try first? Get the full post on my LinkedIn: Matthew Spuffard https://www.linkedin.com/in/matthewspuffard/🚀
#PowerBI #DataDesign #DashboardTips
Great UI/UX in data platforms isn’t optional—it’s essential. 🎨
By applying psychology, I design dashboards that feel intuitive, engaging & effective.
Here are my top principles:
🔹 Aesthetic Usability: Make it look good & users trust it more.
🔹 Visual Hierarchy: Prioritise key metrics for faster decisions.
🔹 Cognitive Load: “One screen, one story” for clarity.
Want to learn all 10 principles I use? See full article on my LinkedIn: https://www.linkedin.com/in/matthewspuffard/🚀
#DataDesign #UIUX #DataAnalytics
Trying to build my first Data Vault model in #Snowflake. But I'm not quite understanding the concept of hash keys. My source system already has a sequence as a surrogate key and just creating a hash of that value seems to serve no purpose.
I can understand it if I didn't always have a surrogate key but why should I use them if I do?
#sqlhelp #datawarehouse #datavault #datadesign
We’re excited to unveil our new trailer that shows why we exist and what we do.
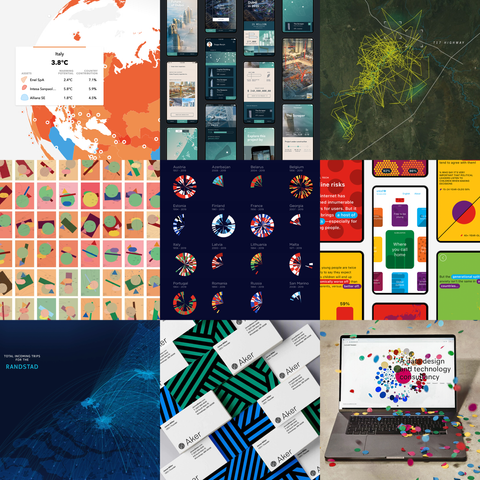
At CLEVER°FRANKE we create data-driven experiences. We pioneer through data, design and technology to unravel complexity, and help people make sense of the world around them. We are focused on creating clear, intuitive solutions that transform complex information into accessible stories.
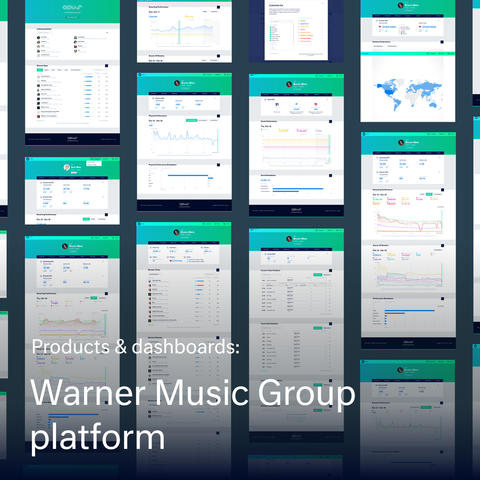
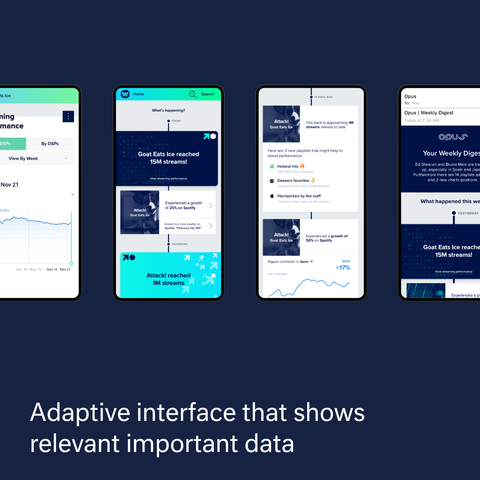
Today we’re highlighting a past project: the Warner Music Group platform 🎶
WMG, as one of the three biggest music forces in the world, wanted to help artists achieve long-term creative and financial success while providing customers with the highest quality music content available. 🧵
At CLEVER°FRANKE, every project starts with a design brief, but we’re not afraid to challenge it to uncover better solutions. By aligning on common goals, sharing our thought process, and keeping feedback loops open, we create results that go beyond expectations—ensuring our clients are satisfied by the exceptional work we deliver.
Read more about Emilija's insights: https://www.linkedin.com/pulse/challenging-design-briefs-how-we-leverage-problem-solving-3k4ce/
🚀 We're Hiring! 🚀
Join our dynamic team in Utrecht as a Full Stack Developer! Bring your experience to build complex, data-driven user interfaces with us. Do you excel in both front-end and back-end development, know your way around GraphQL, Docker, and Git, and have a knack for innovation? Then we want you!
Ready to take your skills to the next level and work with inspiring professionals? Apply now:
We're thrilled to share that our projects have been recipients of European Design Awards every year for 10 consecutive years! 🌟 This amazing achievement reflects our continuous commitment to quality, innovation, and creativity. Check out our latest win with our portfolio website here: https://awards.europeandesign.org/winner/260489
Big thanks to our talented team for their incredible work, and here's to many more years of excellence in design!
#datavisualization #design #dataviz #datadesign #europeandesignawards
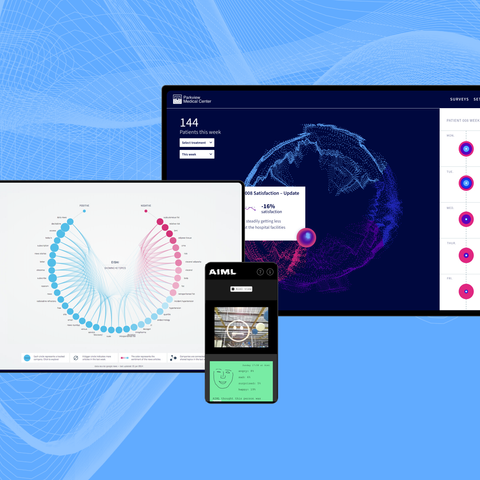
One way we have used AI tools in our projects was for sentiment analysis. AI algorithms can analyze emotions expressed in lengthy text inputs such as customer reviews or feedback. By categorizing sentiments into positive, neutral, or negative, these tools offer invaluable insights into customers' emotions and perceptions. Sentiment analysis through AI can be implemented in various ways 🧵:
#datavisualization #dataviz #AI #sentimentanalysis #design #datadesign
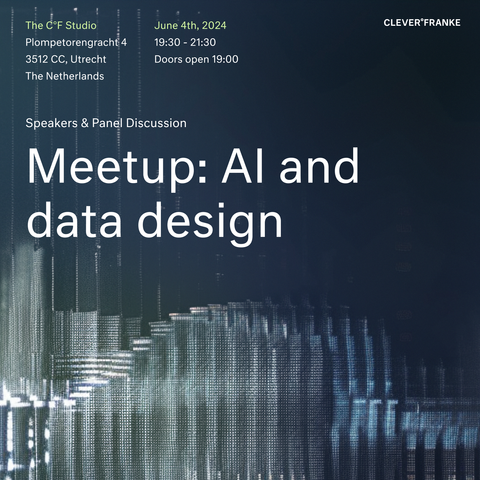
Reminding everyone about our upcoming meetup on June 4th, with speakers Iskander Smit, Philo van Kemenade and Kwan Suppaiboonsuk. We will dive into the future of living with intelligent objects in urban environments, the creative potential of algorithms in design, and innovative ways to repurpose personalized technology for collective experiences.
The meetup is free and all are welcome! Feel free to RSVP here: https://cleverfrankeaimeetup.rsvpify.com
Excited to announce our upcoming meetup on June 4th, centered around AI technologies in data design! Join us as our 3 speakers dive into different topics related to the role of AI in data-driven experiences, and engage in meaningful conversations about the future of this field.
More details will follow soon.
The meetup is free to attend and all are welcome. Save the date, and hope to see you there!
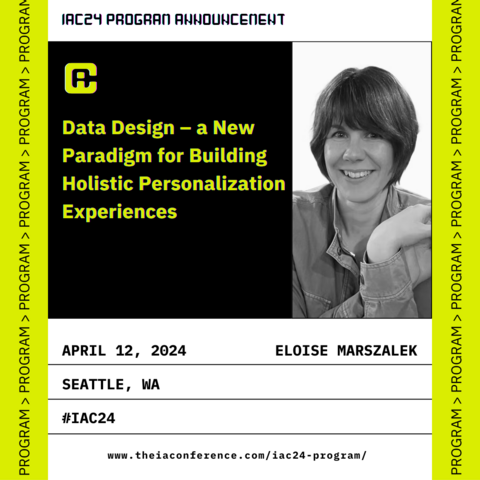
At #IAC24, Eloise Marszalek will share how Data Design can vastly improve personalization efforts, and how those trained in information architecture are uniquely well-suited for the job.
👉 Join us at IAC24: https://linktr.ee/theiaconf
#IA #UX #AI #Career #Conference #DataDesign #personalization
In the latest of our series on Gov Tech data services, we highlight the Food Standard Agency (FSA) publishing of the Regulated Products registers.
Our expertise in Data Design and data APIs helped provide this key resource for the Food Industry:
https://www.epimorphics.com/projects/regulated-products-register
#FoodIndustry #FoodSafety #PublicSector #GovTech #publishing #RegulatedProducts #registers #DataDesign #DataAPIs
Next in our series on #GovTech data services, we highlight our work with
Natural Resorces Wales on their Bathing Waters service.
Our Data Design & Linked Data expertise helped create a bilingual resource for citizens, scientists, & Local Government
https://www.epimorphics.com/projects/bathing-waters
#OpenData #WelshData #GovTech #DataDesign #LinkedData #LocalGov
Our colleague Aurelija wrote an article explaining the transformative power of data-driven products in shaping brand identity. Read it here: https://medium.com/clever-franke/how-turning-data-into-a-product-can-shape-the-brand-identity-of-a-business-ebae0a7170a3
Looking to partner on a data-driven project? Look no further! Epimorphics has a wealth of experience in data standards, #LinkedData, #DataIntegration and #DataDesign, and we pride ourselves on being great collaborators.
Let's chat! #DataCollaboration https://www.epimorphics.com/about/
