Junefairytale Day 21: moon
☆
☆
💗🧸tags💗🧸
#artwork #challenge #drawing #fanart #moon #day21 #moshimonster #moshlings #junefairytale #artpost #arttag
#Day21
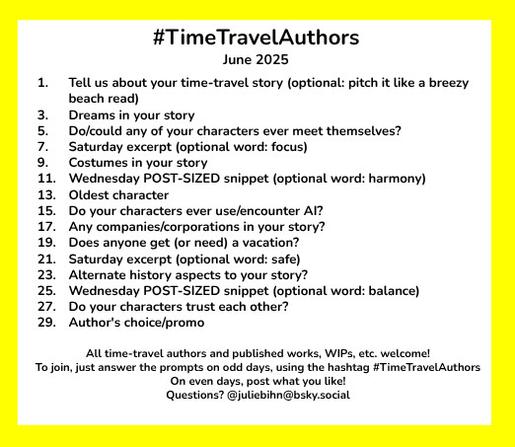
#TimeTravelAuthors #Day21 #Chapter2 She glanced around the cluttered #space for a safe place to set her student’s assignments, her daily calendar, a few assorted bills, and the small clutch containing her wallet, keys, and sunglasses. She opted for a free spot on Patrick’s desk in the far corner.
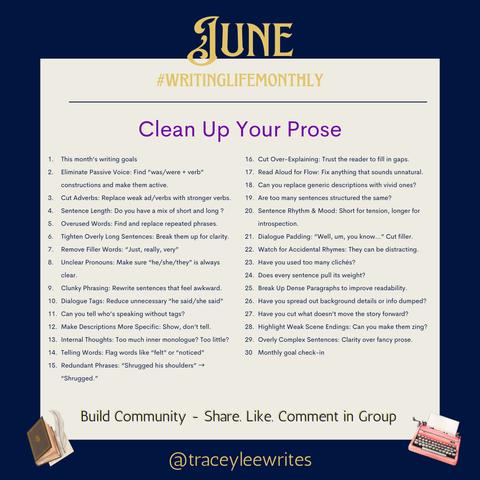
#WritingLifeMonthly #Day21 I enjoy snappy dialogue. I hope my readers do, too.
Maycean Day 21: sea bunny
☆
☆
💗🧸tags💗🧸
#31minutos #artwork #challenge #drawing #fanart #day21 #seabunny #animalsform #maycean #artpost #arttag
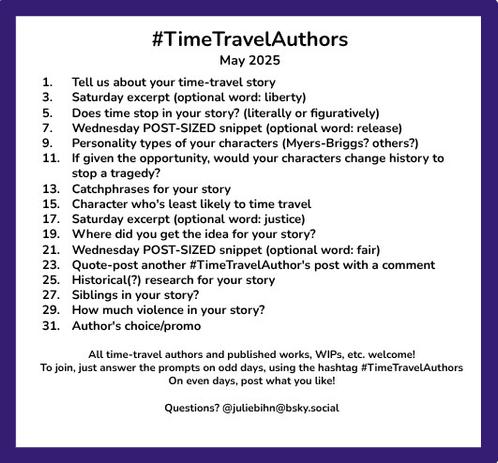
#TimeTravelAuthors #Day21 #Chapter4 She expected when it rolled around, her Monday would also be #fairly similar to the other days that passed: walking through the woods, foraging for her next meal, reading, writing, and resting under the brilliance of a voluminously star-filled sky.
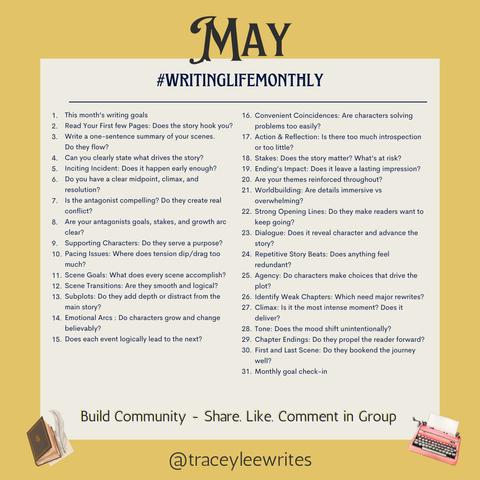
#WritingLifeMonthly #Day21 I would like the details to be more than immersive. They are critical to the goal of my MC, but it will be up to the author [oh hey, that’s me] to make sure that happens effectively.
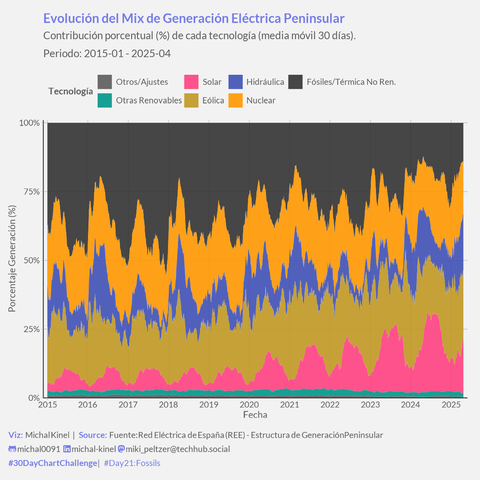
#30DayChartChallenge Día 21: Fossils! 🦖➡️☀️💨 Evolución del mix eléctrico peninsular en España (2015-2025). #TimeseriesWeek #SocialData
Gráfico de áreas apiladas con la proporción (%) de cada fuente (Fósiles/Térmica No Ren., Nuclear, Hidro, Eólica, Solar, Otras Renov.), usando datos diarios de @REDElectrica **suavizados con media móvil de 30 días** (`frollmean`).
¡La #TransicionEnergetica en tendencia!
⚫ Fósiles: Pierden peso relativo.
☢️ Nuclear: Base estable.
💧 Hidro: Variable pero importante.
💨 Eólica: Crecimiento sólido.
☀️ Solar: ¡El boom!
La media móvil ayuda a ver la señal principal sobre el ruido diario.
🛠️ #rstats #ggplot2 #data_table #qs | Data: REE | Theme: #theme_week4_social
📂 Código/Viz: https://t.ly/v3lz_
#Day21 #Fossils #dataviz #DataVisualization #EnergyTransition #RenewableEnergy #EnergiasRenovables #España #REE #ggplot2 #RStats #ClimateAction #MovingAverage
#TimeTravelAuthors #Day21 My publishing journey is already set: posted as a serial to my website. It follows in the path of every other novel I’ve written. I don’t have the diligence to pursue traditional publishing, nor do I feel passion enough to self-publish. Oh, but I do copyright all of them.
Marchusic Day 21: I'm just one person
☆
☆
💗🧸tags💗🧸
#artwork #challenge #drawing #fanart #mecano #mhs #song #midnighthorrorschool #day21 #marchusic #artpost #arttag
Well that was fun. And I have no idea what else to put here. So, let's just keep going.
Choose 20 books that have stayed with you or influenced you. One book per day for 20 days in no particular order. No explanations, no reviews, just covers.
Day 21/20
Fruitecember Day 21: pomegranate fruits
☆
☆
☆
💗🧸tags💗🧸
#fanart #artwork #drawing #day21 #vivapiñata #pomegranatefruits #fruitecember #artpost #arttag
Makin' my Ten Spice syrup recipe on Day 21, now that I'm in prep-for-Christmas-Eve mode. The dram keeping me company is The Character of Islay Fiona Macleod 33 Year Old Single Malt Scotch Whisky, from an unnamed Islay distillery. It's named for the pseudonym of Scottish writer and poet William Sharp (an interesting story in and of itself, told well recently on The Allusionist podcast).
1/2
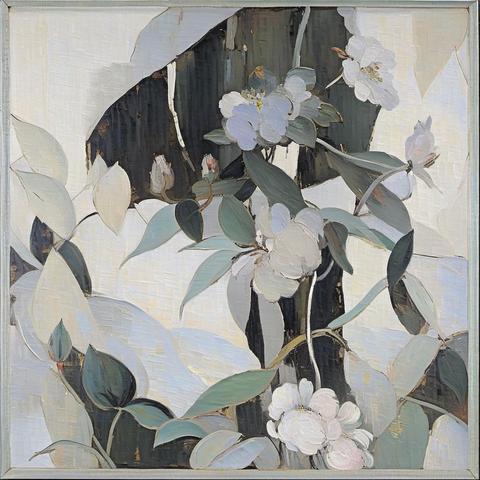
𝚄𝚗𝚝𝚒𝚝𝚕𝚎𝚍. 𝙳𝚒𝚐𝚒𝚝𝚊𝚕 𝙿𝚛𝚒𝚗𝚝, 𝙺𝚒𝚖 𝚂𝚑𝚎𝚛𝚛𝚎𝚕𝚕 𝟸𝟶𝟸𝟺 #ArtAdventCalendar #Day21 #Art
@s1m0n4
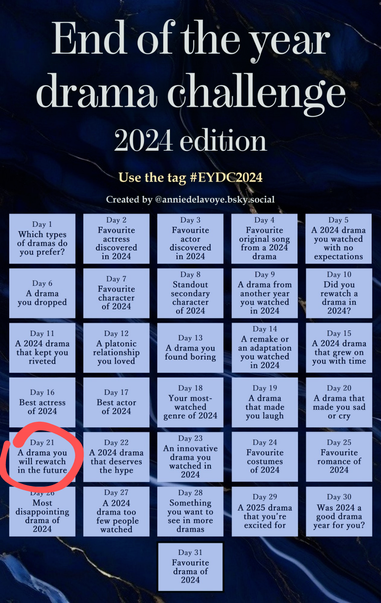
#EYDC2024
#kdrama
#Day21 A drama you will rewatch in the future
It's hard to pick because so many dramas are dear friends but there also so many I haven't yet seen! Dramas I did rewatch this year include:
#DoomAtYourService
#TheKingEternalMonarch
#TheHeirs
#UncontrollablyFond
#MrPlankton
I'd probably go back to any of them as well as #Healer
I may also rewatch
#MisterSunshine
#MyDearest
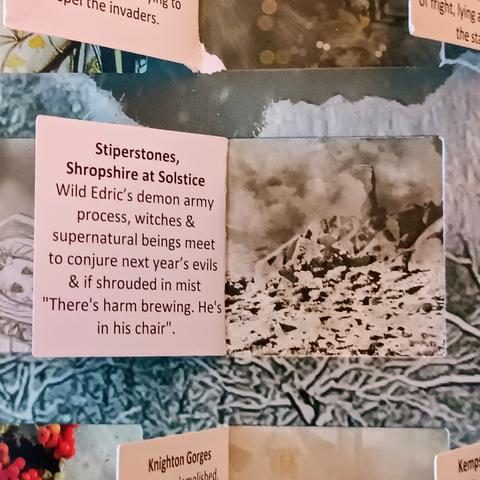
It's all happening up at the Stiperstones today on Day 21 of the Yuletide Hauntings Advent Calendar. Any sign of Wild Edric today @Amynearlyknowledgeable
#day21 #yuletide #hauntings #christmascountdown #christmas #stiperstones #shropshire #shropshirefolklore
#digipresadventcalendar #day21
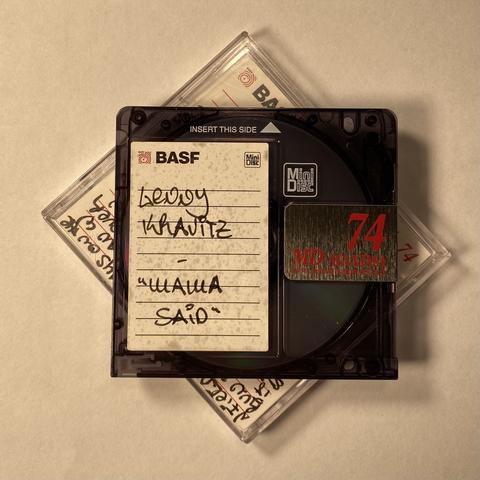
Today‘s entry is another unfortunately short-lived example: the MiniDisc (MD). Introduced by Sony in 1992, it offered a sturdy, editable alternative to CDs in a smaller format. Downside was the limited capacity <= 177MB due to which music was compressed in ATRAC, developed for MD. While the successor Hi-MD solved some of these issues in 2005, the iPod had already been released & the rest is history.
My specimen is a BASF 74min MD lovingly copied by my bro ca 1996
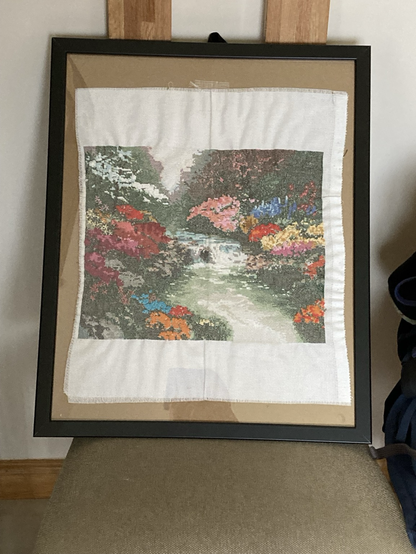
#ArtAdventCalendar #CrossStitch #day21 Working today so some old art. Slight cheat as this is a Thomas Kinkade counted cross stitch but proud I finished this. Started it in my previous house then picked it back up during covid lockdowns, took me a long long time to finish. The French knots for the flowers were the hardest.

