#ERA5

2025-06-13

Der Mai 2025 war global der zweitwärmste Mai seit Beginn der Aufzeichnungen.

Laut ERA5-Daten lag die durchschnittliche #Oberflächentemperatur 0,53 °C über dem Mittel von 1991–2020 und 1,40 °C über dem vorindustriellen Niveau.

Nur der Mai 2024 war wärmer. In den letzten 23 Monaten überschritt die globale Temperatur 14-mal deutlich die 1,5-Grad-Marke.

climate.copernicus.eu/surface-

#Klimawandel #GlobaleErwärmung #Temperaturrekorde #Klimadaten #ERA5 #C3S #Mai2025

2025-05-13

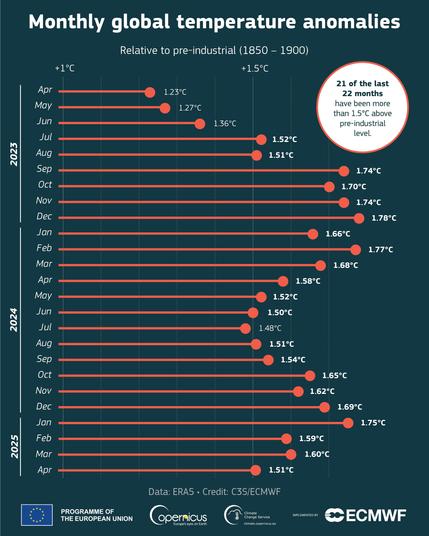
Since July 2023, 21 of the last 22 months have seen global average temperatures 1.5ºC above the pre-industrial level, according to #ERA5 data - with July 2024 just 0.02°C below that mark.

Read more about the latest findings in our #C3S Monthly Bulletin: climate.copernicus.eu/2nd-warm

2025-03-27

Anyone out there got any tips on converting ERA5 .grib files? Trying to get a load of data for a project at work and running up against the CDSAPI computation limits for netcdf files (unless I want to split files daily massively increasing the number of total requests). Running up against error after error with xarray, earthkit and cfgrib when trying to convert. Would love some help.

#python #grib #netcfd #ERA5

2025-03-19

Out now! Available in the #C3S data store: ERA5 hourly time-series data on single levels from 1940 to present. As a regridded subset of the full #ERA5 dataset on native resolution, it is designed for retrieving long time-series for a single point.

Direct link 👉 cds.climate.copernicus.eu/data

2025-03-13

The C3S global temperature trend monitor, based on #ERA5, allows you to explore how the estimate of the time to 1.5°C global warming has changed in recent years. While it should not be interpreted as a forecast, it does show trends in global warming.

O=C=Otuxom
2025-01-05

Time series - near-surface air temperature

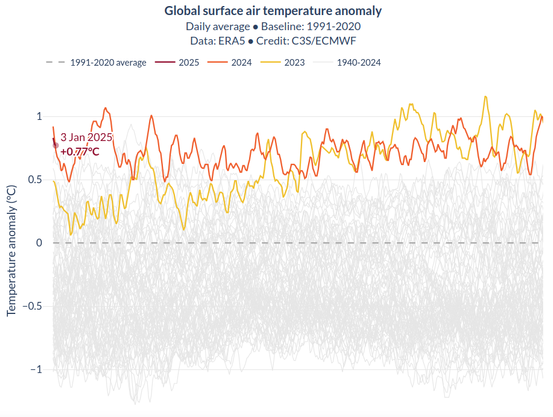
This chart shows daily averages of global mean near-surface air temperature anomalies from the global reanalysis dataset, from January1940 up to two days behind real-time.

pulse.climate.copernicus.eu/


Graphic
Global surface air temperature anomaly
Daily average ● Baseline: 1991-2020
Data: ERA5 ● Credit: C3S/ECMWF

Present temp. anomaly is on top with last years high...
2024-12-27

Reanalysis datasets like #ERA5 combine conventional weather observations and data from satellites with a computer model of the Earth system. But what does that mean in detail and what is the degree of uncertainty of ERA5 temperature data?
All the answers: climate.copernicus.eu/what-deg

2024-12-16

Predicting climate trends, guiding policies, and protecting communities: #ERA5 is a foundation for informed decision-making and action.
Read the article: climate.copernicus.eu/driving-

2024-10-14

📣 We are pleased to announce that the much awaited #ERA5 and ERA5-Land post-processed daily statistics have been released as datasets in the new Climate Data Store, replacing the legacy ERA5 daily statistics application.

Forum announcement: forum.ecmwf.int/t/new-dataset-

Direct links 👇

Single levels:
cds.climate.copernicus.eu/data

Pressure levels:
cds.climate.copernicus.eu/data

Land:
cds.climate.copernicus.eu/data

Elio Campitellieliocamp
2024-10-14

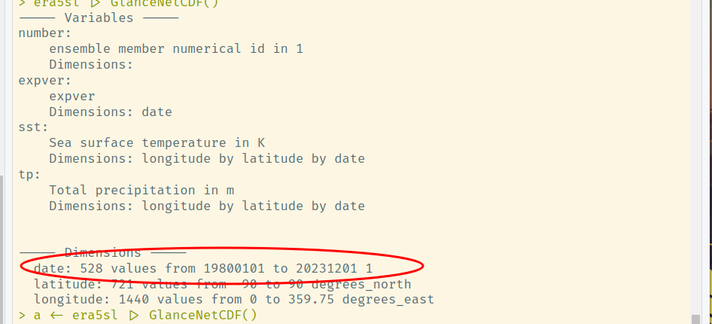
Did Copernicus Climate Data Store completely borked ? I'm downloading monthly data and the date information is bonkers. The coordinate is now called "date" (instead of time) and it's not a real time with units, it's just ISO dates as integers. It's impossible to correctly process with CDO and ncivew is throwing a fit.
cc @koen_hufkens

> era5sl |> GlanceNetCDF()
----- Variables ----- 
number:
    ensemble member numerical id in 1
    Dimensions: 
expver:
    expver
    Dimensions: date
sst:
    Sea surface temperature in K
    Dimensions: longitude by latitude by date
tp:
    Total precipitation in m
    Dimensions: longitude by latitude by date


----- Dimensions ----- 
  date: 528 values from 19800101 to 20231201 1
  latitude: 721 values from -90 to 90 degrees_north
  longitude: 1440 values from 0 to 359.75 degrees_east

@stiefel_fan @Fischblog

Oh guck. #Era5 von Copernicus ist auch nicht von Helene betroffen und hat die letzten 2 Monate auch kein Plateau und auch zuletzt keine Steigerung pulse.climate.copernicus.eu
Ist interaktiv. Muss man die Kachel Sea Surface Temperature anklicken, sonst sieht man eingangs die air temperature.

2024-09-10

#CopernicusClimate is digitising historical climate data from Africa, enhancing reanalysis datasets like #ERA5 via a new data rescue portal developed with WMO.
👆 A valuable resource for researchers and policymakers.

More in our latest article: climate.copernicus.eu/data-res

2024-08-13

RT by @EUClimateAction: 🌡️🌍According to #ERA5 data, July 2024 was the second warmest July globally, 1.48°C above the estimated July average for 1850-1900 and marking the end of a series of 12 consecutive months at or above 1.5°C.

Read more here 👉climate.copernicus.eu/july-was

[2024-08-12 10:22 UTC]

2024-08-08

Der Juli 2024 war weltweit der zweitwärmste Juli seit Beginn der Aufzeichnungen, nur knapp hinter dem Juli 2023. Die globale Durchschnittstemperatur erreichte 16,91 °C, was 0,68 °C über dem Durchschnitt von 1991 bis 2020 liegt. #Europa erlebte besonders im Süden und Osten außergewöhnliche #Wärme, Es ist sehr wahrscheinlich, dass 2024 das wärmste Jahr seit Beginn der Aufzeichnungen wird.

#Klimawandel #Hitzerekorde #ERA5 #Copernicus #GlobaleErwärmung

climate.copernicus.eu/copernic

O=C=Otuxom
2024-07-25

State of the : 2024 now very likely to be warmest year on record

Carbon Brief’s analysis indicates a 95% probability that this year will surpass 2023 as the warmest year on record in the /#ECMWF dataset.
This projection emerges amid a series of climate extremes that have marked the first half of 2024.

carbonbrief.org/state-of-the-c

Temperatures for each month from 1940 to 2024 from Copernicus/ECMWF ERA5. Anomalies plotted with respect to a 1850-1900 baseline. Chart by Carbon Brief. 

The figure shows how global temperature so far in 2024 (purple line) compares to each month in different years since 1940 (with lines coloured by the decade in which they occurred) in the Copernicus/ECMWF ERA5 surface temperature dataset.Annual global mean surface temperatures from NASA GISTEMP, NOAA GlobalTemp, Hadley/UEA HadCRUT5, Berkeley Earth and Copernicus/ECMWF (lines), along with 2024 temperatures so far (January-June, coloured dots). Anomalies plotted with respect to the 1981-2010 period, and shown relative to pre-industrial based on the average pre-industrial temperatures in the Hadley/UEA, NOAA and Berkeley datasets that extend back to 1850. Chart by Carbon Brief. 

The figure shows the annual temperatures from each of these groups since 1970, along with the average over the first six months of 2024. (Note: at the time of writing, June data was not yet available for the Hadley/UEA record.)Daily global absolute temperatures from 1940 to present (22 July 2024) from Copernicus/ECMWF ERA5, with daily values for each year plotted as a separate line. The colours indicate 2024 (purple), 2023 (red) and all other years (grey). Chart by Carbon Brief.
Meteorologist Austen OnekWDEFAustenOnek
2024-07-19

"🌡️📈 Why do we keep talking about 1.5°C and 2°C above the pre-industrial era?

For the first time in the dataset, global surface temperature reached or exceeded 1.5°C above the 1850-1900 average for 12 consecutive months.

Learn why this matters 👉"

climate.copernicus.eu/why-do-w

2024-07-18

🌡️📈 Why do we keep talking about 1.5°C and 2°C above the pre-industrial era?

For the first time in the #ERA5 dataset, global surface temperature reached or exceeded 1.5°C above the 1850-1900 average for 12 consecutive months.

Learn why this matters 👉climate.copernicus.eu/why-do-w

Client Info

Server: https://mastodon.social
Version: 2025.04
Repository: https://github.com/cyevgeniy/lmst