#EuroVis2025

2025-06-03

👋 Moien Luxembourg, we're happy to be at EuroVis 2025! 📊

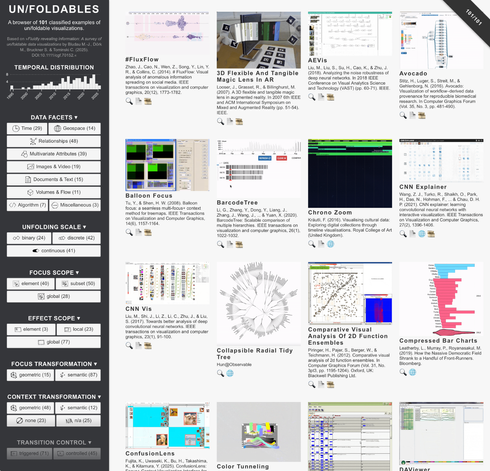
@markjan will give a long presentation about »Fluidly revealing information: A survey of un/foldable data visualizations» - Wednesday morning. Check out the survey browser here (⚠️: lots of GIFs): uclab.fh-potsdam.de/unfoldable

Theresa Eingartner will give a short talk about »Inflecting data visualizations for web-based scrollytelling« - Thursday afternoon. See it in action here: uclab.fh-potsdam.de/inflect/

#DataVis #DataViz #EuroVis2025 #EuroVis

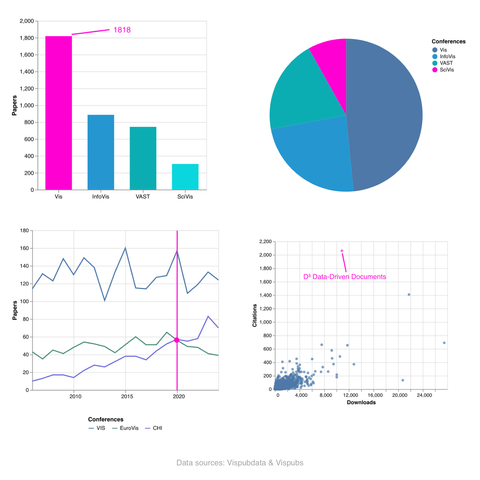
Screenshot of survey browswer with un/foldable visualizations. On the left side faceted navigation for the classification. In the main part of the interface thumbnails and project titles and references.Four diagrams - bar chart, pie chart, line chart, and scatterplot - about visualization conferences,  each chart with pink highlights.

Client Info

Server: https://mastodon.social
Version: 2025.04
Repository: https://github.com/cyevgeniy/lmst