#Geopandas

2025-05-23

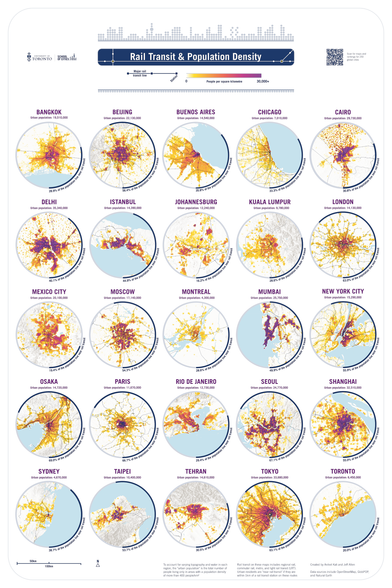
fun map poster of rail transit and population density by Aniket Kali and myself - just showed this at the Canadian Cartographic Association 2025 conference this week

check out more maps here:) schoolofcities.github.io/rail-

#maps #transit #gis #geopandas #inkscape #openstreetmap

poster showing 25 maps, each of a different city, with each showing a 1km grid of population density overlaid by major rail transit routes
Alexandre B A Villares 🐍villares@ciberlandia.pt
2025-05-06

«The official OSMnx reference paper has just been published open-access by Geographical Analysis: [link below] Years in the making, this article describes what OSMnx does and why it does it that way. But wait, there's more! I also discuss many lessons learned over the past decade in geospatial software development [...]» — @gboeing

Modeling and Analyzing Urban Networks and Amenities With OSMnx

onlinelibrary.wiley.com/doi/10

#Python #OSMnx #geoviz #geopandas #FLOSS #geospatial #OpenAccess

2025-04-24

@tyldurd Nice! pandas translates so nicely to as well if tasks need to be done. All the libraries make Python more fun for me. :)

Anita Graser 🇪🇺🇺🇦🇬🇪underdarkGIS@fosstodon.org
2025-04-04
2025-04-02

Struggling with slow GIS processing? Tony Albanese's article demonstrates a lightning-fast method for generating transects using #Geopandas and #Polars, reducing processing time from days to seconds.

towardsdatascience.com/harness

Tatu Leppämäkitadusko@mstdn.social
2025-03-28

Thank you to #Kone & Mai and Tor Nessling Foundations for supporting this work. A quantitative work like this would not be possible without a robust suite of FOSS tools. My thanks to the maintainers of #QGIS, #pandas, #geopandas, #duckdb, #dask, #statsmodels, #jupyter and many more!

2025-03-20

Seeking recommendations for a #WebMapping tutorial / course?

Slightly at sea on where to start.

- My current JS skill level is _extreme novice_.
- I don't have access to ArcGIS.
- Comfortable with #QGIS [*] and the #python #geospatial ecosystem (#geopandas #xarray #rasterio and plotting with #matplotlib)

Suggestions welcome. TIA. 👍

* I have looked at the qgis2web plugin, but having some issues associated with my aged laptop (2012 mbp running Ubuntu) and a 'Wayland session'.

#Leaflet #OpenLayers #MapBox #PrototoMaps #MapLibre #d3js #OpenStreetMap #GIS
Anita Graser 🇪🇺🇺🇦🇬🇪underdarkGIS@fosstodon.org
2025-03-06

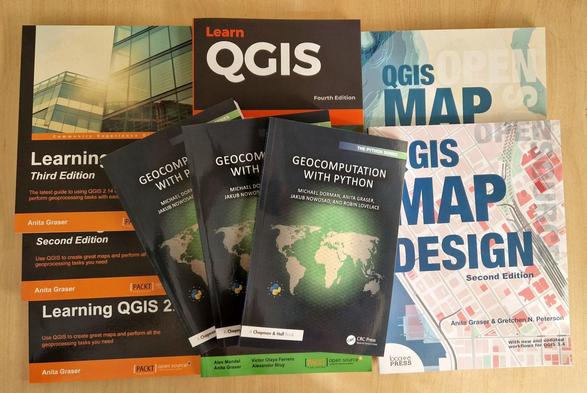
📚 Geocomputation with Python copies have arrived 🤩

Somehow, things feel much more real if you can touch them.

Fun fact: the cover was designed in #QGIS. Speaking of going full circle ...

#GISChat #Python #GeoPandas

:rss: Qiita - 人気の記事qiita@rss-mstdn.studiofreesia.com
2025-03-04

Uberの作った「H3インデックス」とGeoPandasを利用してOverture Mapsの可視化と地理空間解析してみる!
qiita.com/nokonoko_1203/items/

#qiita #Python #GIS #QGIS #geopandas #H3

2025-02-28

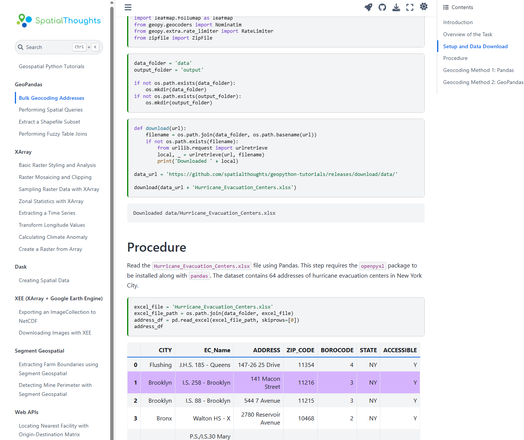
𝗚𝗲𝗼𝘀𝗽𝗮𝘁𝗶𝗮𝗹 𝗣𝘆𝘁𝗵𝗼𝗻 𝗧𝘂𝘁𝗼𝗿𝗶𝗮𝗹𝘀
SpatialThoughts provides tutorials which cover a broad range of geospatial topics and technologies, e.g., #GeoPandas, #XArray, #dask, and more. Each technology is described in a notebook with step-by-step explanation. Check it out.
geopythontutorials.com

2025-02-25

Python #uv: uv by #Astral (also behind Ruff) is a new-ish #Python project management tool that you may have already heard praise about. uv simplifies environment and dependency management for Python (truly, finally) and is blazingly fast, thus potentially streamlining also geospatial workflows reliant on libraries such as #GeoPandas, #rasterio and the like.
spatialists.ch/posts/2025/02-2 #GIS #GISchat #geospatial #SwissGIS

2025-02-18

The development was supported by NumFOCUS (small development grant for the #GeoPandas project). A lot of the credit goes to @jorisvandenbossche and @paleolimbot (through S2Geography). Also many thanks to the new contributors!

github.com/benbovy/spherely

Joris is going to give a talk about it next week at the GeoPython conference in Basel. If you go there, don’t miss it!

2025.geopython.net/

2025-02-10

Une carte complètement inutile, donc indispensable. À quelle latitude le Soleil survole-t-il le plus de terres émergées ?
#Python #Geopandas
#maps #TeamCarto

Carte du monde (fond bleu, continents marron clair). Dans la zone intertropicale, des lignes horizontales barrent les continents ; leur couleur va de l'orange clair au rouge. À gauche, dans le Pacifique, un histogramme à barres horizontales avec les mêmes lignes colorées. En légende en bas : maximum 36.7% de terres émergées, latitude 22.97° 10 juin et 4 juillet.
Sascha WyciskIT_Duke@muenster.im
2025-02-08

#Münster stellt #Opendata zur Verfügung. Was ziemlich cool ist.
Mit ein wenig #Python und #pandas bzw. #geopandas und der Hilfe von #ChatGPT kann man dann zum Beispiel die durchschnittliche Modulleistung der PV Installationen je Postleitzahl visualisieren 😃

Karte von Münster mit Postleitzahlen. Die Karte ist grün eingefärbt. Je dunkler das Grün desto größer die durchschnittliche Modulleistung. An der rechten Seite ist eine Skala aus der die Werte abgelesen werden können
2025-02-08

@christyheaton kicks us off at #pycascades2025 by talking about how to make hiking maps with #pyscript, #geopandas, and #streamlit 🥾🚶⛰️
#pycascades #python

Stage with a large white screen in the background with a brown haired woman standing at a podium presenting a talk. The slide has a venn diagram showing the similarities of pyscript, streamlit, and geopandas
didididiomai
2025-02-07

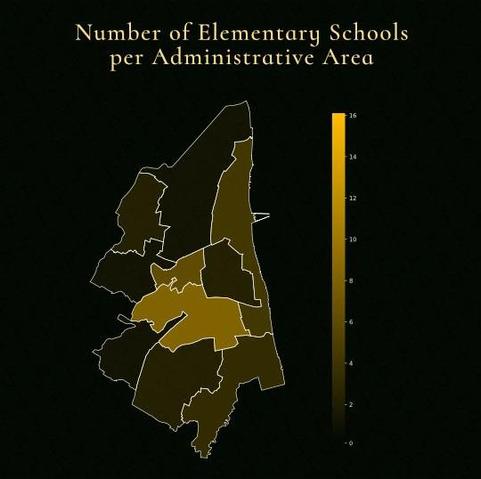
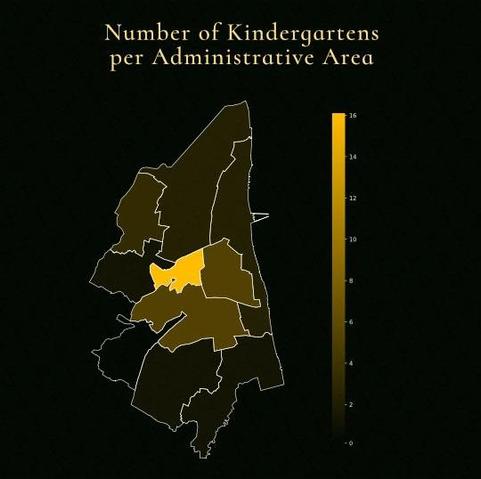
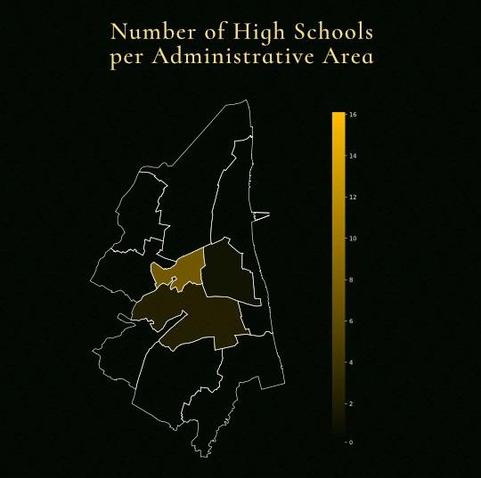
Number of scholastic buildings per administrative area in Ravenna, 2022

didididiomai
2025-02-05

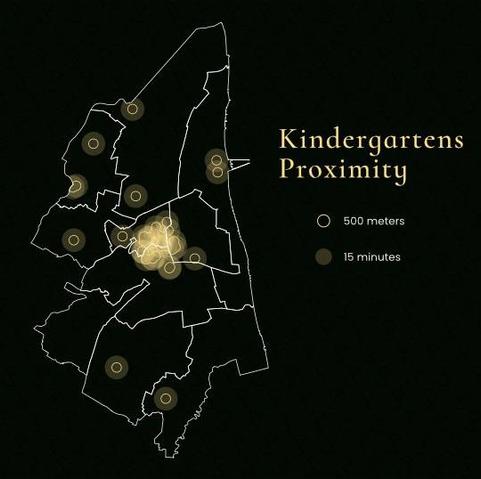
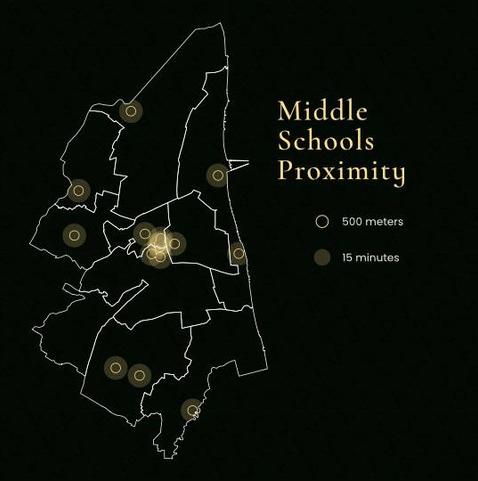
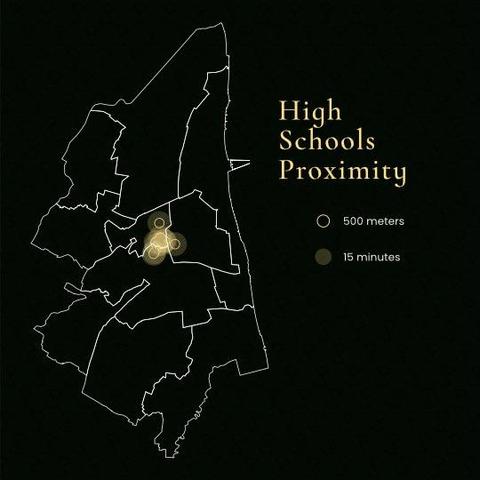
School coverage across the Ravenna province by grade, an analysis to measure how many children live within a 15-minute walking distance of a school.
This post only displays the areas covered by schools due to privacy and safety considerations (GDPR).

Most kindergartens are in the city, many towns are not covered.Multiple elementary schools in the city. One in almost every town.Multiple middle schools in the city, at least one for each administrative area.All high schools are in the city.

Client Info

Server: https://mastodon.social
Version: 2025.04
Repository: https://github.com/cyevgeniy/lmst