It's a small thing but adding the number of products in ( ) for each group in the dropdown menu makes it easier to find #InSAR pairs. I'll add that in the next version.
#EOTools #RemoteSensing #EarthObservation #python #FOSS #Sentinel1
#InSAR
🛰️ I’m currently experimenting with combining the Copernicus STAC and S3 APIs to make the EO-Tools Sentinel-1 processing chain leaner and more efficient.
The idea is to avoid downloading full products when only a subset of bursts is needed.
I know the total monthly bandwidth allowance, but does anyone know if there’s a way to check how much bandwidth remains after using the API?
#Sentinel1 #SAR #STAC #Copernicus #EarthObservation #RemoteSensing #InSAR #OpenSource #EOTools
🚀 EO-Tools v2024.6.0 is out!
This update brings minor improvements and fixes:
🛠️ Added a sample EODAG config
🛰️ Orbit directory now configurable per function
📦 Improved and modernized type hints
⬆️ Dependencies upgraded
🔗 https://eo-tools.readthedocs.io/en/latest/
#EOtools #RemoteSensing #Python #Sentinel1 #InSAR #EarthObservation #SyntheticApertureRadar
La Suisse scrute ses montagnes : avec InSAR et Sentinel-1, elle traque glissements & fonte du pergélisol mm par mm. Premiers résultats fin 2025. Big Data vs Big Rock.
https://www.radiolac.ch/actualite/suisse/la-suisse-veut-surveiller-les-mouvements-de-terrain-par-satellite/
#Suisse #ESA #InSAR #Climat #Montagne #Surveillance #Gag: #MissionImmobile
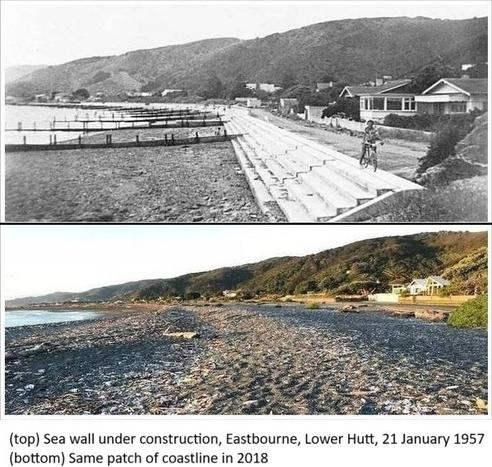
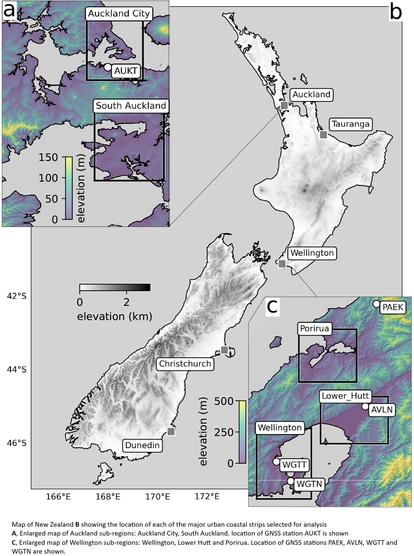
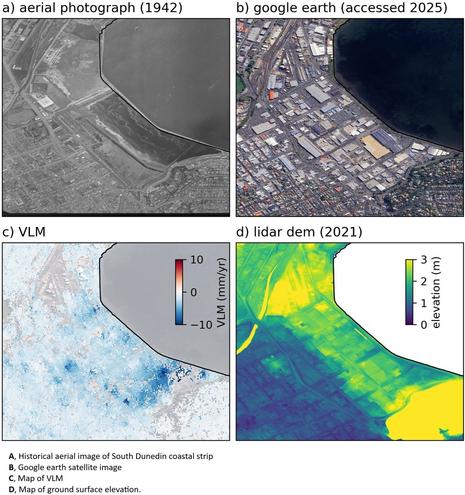
New Zealand's Major Cities Are Sinking
--
https://www.forbes.com/sites/lauriewinkless/2025/04/16/new-zealands-major-cities-are-sinking/ <-- shared media article
--
https://doi.org/10.1080/00288306.2025.2470435 <-- shared paper
--
https://www.searise.nz/ <-- linked to NZ SeaRise project page
--
https://searise.takiwa.co/map/6233f47872b8190018373db9/embed <-- NZ SeaRise web map
--
#GIS #spatial #mapping #NewZealand #sealevel #sealevelrise #SLR #impacts #humanimpacts #land #subsidence #sinking #population #growth #risk #hazard #global #GMSL #coast #coastal #planning #management #mitigation #extremeweather #climatechange #cost #economics #infrastructure #spatialanalysis #spatiotemporal #model #modeling #remotesensing #earthobservation #sentinel #InSAR #urban #city #cities #reclamation #cut #fill #Holocene #engineeringgeology #kiwi #k1w1 #NZ #stormsurge
SciTech Chronicles . . . . . .May 7th, 2025
#protein #liquid #fibre #structural #cephalopods #"arm wave signs" #common #dwarf #"organic solvent" #ultrasonication #PFAs #"platninum group" #"Anak Krakata" #InSAR #deformation #satellite #"corn stover" #cellulose #lignin #pretreatment
Weak Asthenosphere Beneath The Eurasian Interior Inferred From Aral Sea Desiccation
--
https://doi.org/10.1038/s41561-025-01664-w <-- shared paper
--
#GIS #spatial #mapping #remotesensing #earthobservation #inSAR #AralSea #rebound #isostaticrebound #asthenosphere #geology #structuralgeology #mantle #crust #weight #rheology #spatialanalysis #spatiotemporal #continent #desiccation #loss #drying #water #hydrology #elastic #viscoelastic #model #modeling #uplift #lithosphere #humanimpacts #tectonic
Still playing with newly released #Sentinel1C image.
An Extended Wide swath (EW) image was acquired on south #Groenland by #Sentinel1C on February 6, 2025.
The day before, a classical Interferometric Wide swat (IW) image was acquired by #Sentinel1A.
Both images were acquired in polarisation HH - HV.
I coregister both images like it was an interferometric #InSAR pair and make this short animation showing sea currents variation in this one-day interval.
So, my InSAR soft compliance with #Sentinel1C strip map (SM), Interferometric Wide swath (IW) and Extended Wide swath (EW) acquisition modes is now fully verified.
#AmsterToolbox (https://github.com/AMSTerUsers/AMSTer_Distribution)
NASA Radar Imagery Reveals Details About Los Angeles-Area Landslides. Landslides on Palos Verdes peninsula have been moving rapidly in last two years. NASA airborne radar called UAVSAR flies on piloted NASA planes and measures displacements of the ground surface using InSAR analysis. We requested flights in three directions to map motion of landslides on the Palos Verdes peninsula next to Los Angeles. #NASA #NASA_JPL #InSAR #radar #landslides
https://www.jpl.nasa.gov/news/nasa-radar-imagery-reveals-details-about-los-angeles-area-landslides/
Yesterday, it is to say less than two month after #ESA #Sentinel1C 🛰️ launch, a first release of images was made available on #COPERNICUS data space environment to allow users to test their software compatibility.
So, I tested my soft, the AMSTerEngine which is at the core of the AMSTer Toolbox for #InSAR #timeseries processing.
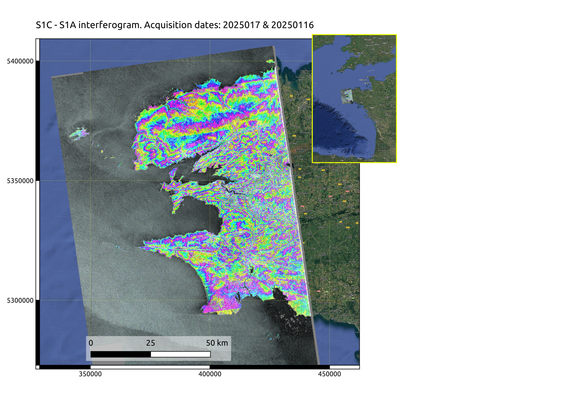
And here is the very first result using a #Sentinel1C - #Sentinel1A image pair acquired on January 17 and 16 respectively on Brest, France.
Consequently, AMSTer Tool box is #Sentinel1C compatible!
This is just normal since #ESA kept the same format for these new data. However, knowing from long that the only reliable stuff in computing is the on/off button, it is quite a relief.
#AMSTerToolbox is freely available here: https://lnkd.in/eGGuY3Pv
I just made a color gradient that mimics SNAP colormap to display an interferometric phase raster in QGIS.
Posting this here as maybe some people will find it useful:
https://gist.github.com/odhondt/0639e6b97626f2bb136dc441502856a8
🚀 EO-Tools 2025.1.1 is out!
Users can now choose one of SRTM, ALOS-World3D, Copernicus 30m and 90m DEMs in both Sentinel-1 InSAR and SLC processors.
💻 GitHub: https://github.com/odhondt/eo_tools
#eo_tools #RemoteSensing #EarthObservation #SyntheticApertureRadar #python #FOSS #InSAR
Concerning the L.A. wildfires, here is a quick view of #InSAR coherence evolution between #Copernicus #ESA #Sentinel1 images of December 16 2024, December 28 2024 and January 9 2025.
Burnt area between last two dates are characterized by strong and abrupt coherence losses.
This gives an idea of the burnt surface in a twelve days delay.
There was a Sentinel-1 scene capture some hours after the Vanuatu earthquake yesterday, so I went to create an interferogram using ASF's on-demand Vertex service from an image pair (2024-12-05 to 2024-12-17). Estimates range from about 5cm of subsidence to 10cm of uplift.
Processed InSAR product files can be downloaded from
https://d3gm2hf49xd6jj.cloudfront.net/c03a1054-506b-4405-a7a8-7087dd0626ab/S1AA_20241205T071348_20241217T071347_VVR012_INT40_G_weF_D415.zip (expires in 14 days). See https://hyp3-docs.asf.alaska.edu/guides/insar_product_guide/#image-files for details on what each file refers to.
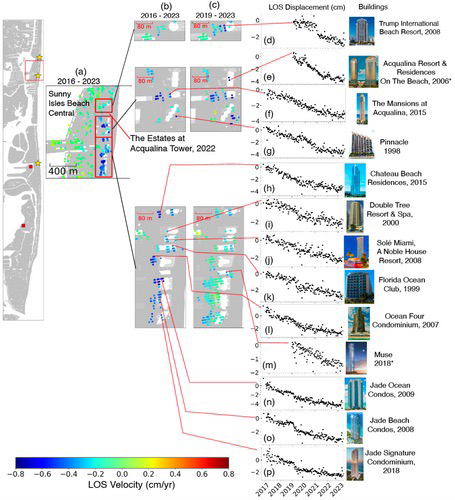
Interesting paper: using InSAR the authors found widespread subsidence of up to 8 cm along the coastal strip of the Miami barrier islands from 2016 to 2023, probably related to construction activities. The subsidence is likely due to prolonged creep deformation of sandy layers within the limestone.
https://agupubs.onlinelibrary.wiley.com/doi/10.1029/2024EA003852
#geoscience #satellite #insar #subsidence #florida #coast #construction
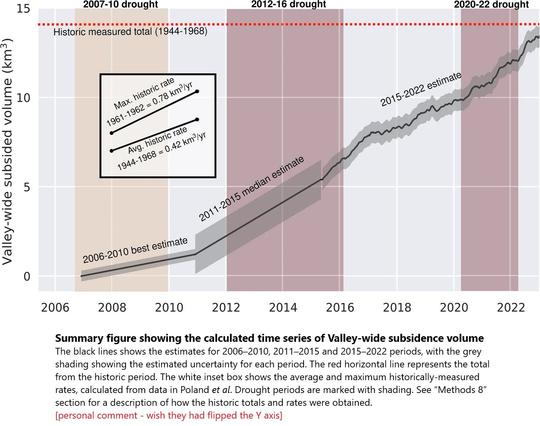
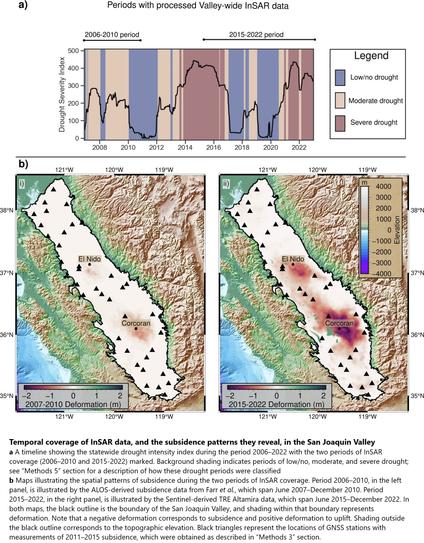
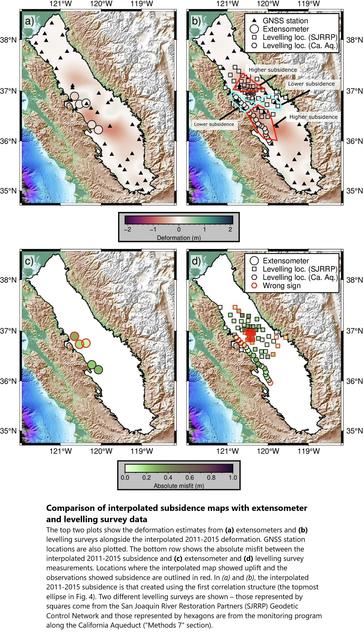
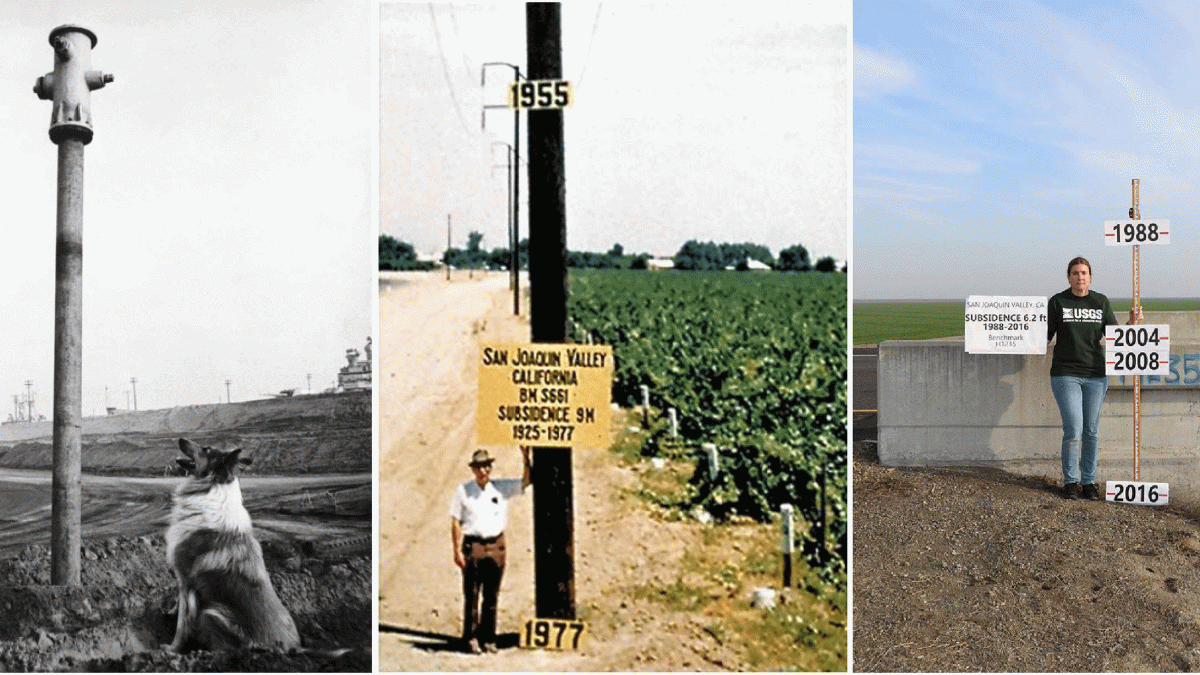
Groundwater Pumping Drives Rapid Sinking In California
--
https://thehill.com/policy/energy-environment/4998177-california-san-joaquin-valley-subsidence-groundwater-study/ <-- shared media article
--
https://phys.org/news/2024-11-groundwater-rapid-california.html <-- shared technical article
--
http://doi.org/10.1038/s43247-024-01778-w <-- shared paper
--
#GIS #spatial #mapping #remotesensing #radar #insar #satellite #change #spatialanalysis #spatiotemporal #water #hydrology #subsidence #california #USA #imperialvalley #SanJoaquinValley #groundwater #pumping #mining #waterresources #watersecurity #watermanagement #geology #sedimentology #risk #hazard #damage #infrastructure #canal #aqueduct #aquifer #recharge #drought #extremeweather #climatechange #agriculture #irrigation #elevation #impacts #well #ditches #watersupply #waterquality #flood #flooding #cost #economics #nonreversible
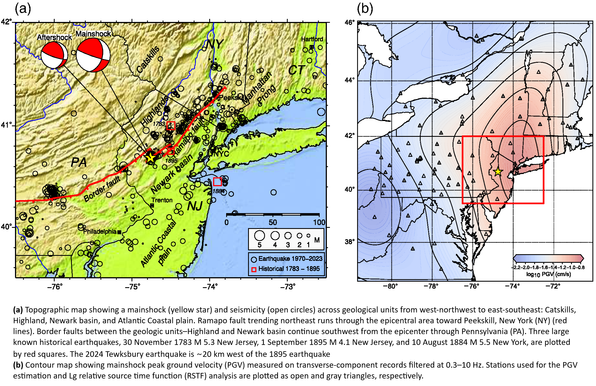
An 'ancillary' figure showing the imagery for the #InSAR #remotesensing data around the earthquake
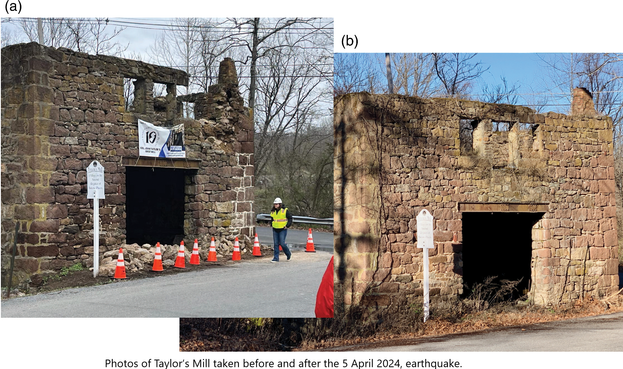
Preliminary Observations of the 5 April 2024 Mw 4.8 New Jersey Earthquake
--
https://doi.org/10.1785/0320240024 <-- shared paper
--
https://doi.org/10.1785/0320240020 <-- shared paper
--
https://doi.org/10.1177/87552930231215428 <-- shared paper
--
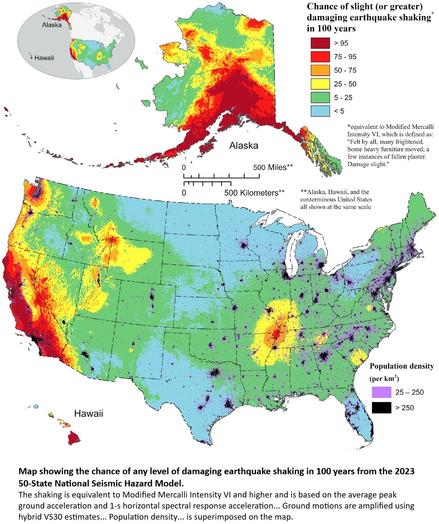
[This is ‘unusual’ seismic activity and shaking patterns for this part of the USA, on an ‘unmapped’ fault, and seemingly challenging existing models of earthquake risk in the region; while a 4.8 is not big, it must have been quite a surprise for the people in this heavily populated U.S. Northeast not used to such things (per the paper, the USGS estimated it was felt by some 42 million people.]
#GIS #spatial #mapping #earthquake #risk #hazard #spatialanalysis #model #modeling #NewJersey #USA #geology #engineeringgeology #seismic #USGS #seismology #fault #faulting #Tewksbury #DidYouFeelIt #geotechnical #NIST #remotesensing #InSAR #strikeslip #mechanism #thrust
EO-Tools version 2024.10.1 is out!
- New features: better S1 coherence estimator - multilooking is now performed prior to coherence computation. It avoids averaging the coherence itself (theoretically sounder approach).
- Bugfix: an error with DEM download due to Planetary Computer now requiring signed urls was fixed.
https://github.com/odhondt/eo_tools
#EarthObservation
#RemoteSensing
#SyntheticApertureRadar
#Sentinel1
#python
#foss
#geospatial
#InSAR
A great application of interferometric coherence is the masking out of vegetation to focus on built-up areas (or the opposite). The next version of eo-tools will introduce some improvements to the current coherence estimation implementation. Here is an example on the city of Berlin, displayed in QGIS.
#EarthObservation
#RemoteSensing
#SyntheticApertureRadar
#Sentinel1
#python
#foss
#geospatial
#InSAR
#qgis
![Geologic map of the epicentral area simplified from Owens et al. (1998) and Drake et al. (1996) draped over topography showing mapped faults (black lines), initial aftershock locations from U.S. Geological Survey (USGS) Comprehensive Earthquake Catalog (ComCat; U.S. Geological Survey [USGS], 2017; downloaded 7 April 2024, at 13:59 UTC; purple circles), and mainshock focal mechanism (see Data and Resources). The location of seismic station BRNJ, which was not recording during the mainshock, is shown by the red square. The New Jersey Highlands, composed of Mesoproterozoic to Ordovician igneous and metamorphic rocks, are shown to the northwest of the white line, and the Newark basin, composed of Mesozoic sedimentary and volcanic rocks, lies to the southeast. Background image is a shaded relief derived from the 10 m National Elevation Dataset (see Data and Resources). Seismicity in inset (gray dots and yellow stars) is from the USGS ComCat (USGS, 2017). The blue rectangle in the inset map indicates the region depicted in the larger figure.](https://files.mastodon.social/cache/media_attachments/files/113/476/834/885/563/078/small/f6c362b523af7c2b.png)