#InhuletsRiver

2025-11-26

There are many ways to represent the spatial anisotropy of terrain forms.
In this case, I focused on a comparative approach: the real surface area of different geomorphon classes plotted against slope aspect.

All calculations were performed within the polygon of the effective catchment area of the Inhulets River.
This visualization highlights how specific landform types tend to “align” with certain aspect directions, revealing structural asymmetries within the catchment.

#Geospatial #Geomorphometry #TerrainAnalysis #RStats #DataViz #Hydrology #SAGA #EnvironmentalScience #GIS #RemoteSensing #InhuletsRiver #ggplot2 #Copernicus #CopernicusDEM #Geomorphology
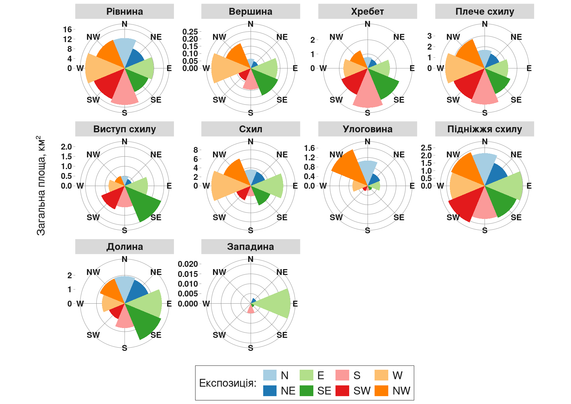
Polar plots of surface area by geomorphon type and slope aspect. Each panel shows the real surface area (km²) of a particular geomorphon class distributed across eight aspect categories (N, NE, E, SE, S, SW, W, NW). Calculations performed within the effective catchment polygon of the Inhulets River.
2025-11-25

I try to keep my results accessible even for readers who aren’t familiar with digital mapping or GIS.
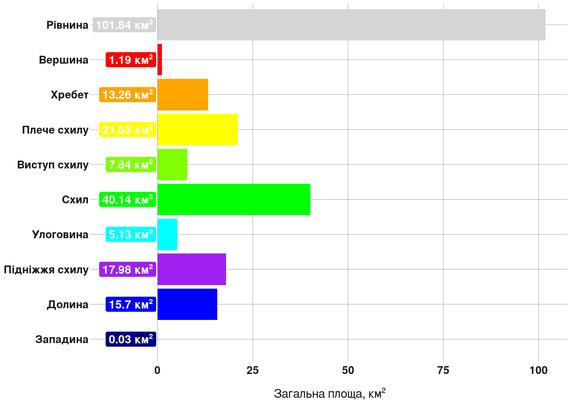
One simple technique is to complement classification maps with clear charts and tables showing how much area each class occupies.
Here’s an example: the total surface area of geomorphon classes within the study region.

There’s also a small but important detail that often gets overlooked: the order of classes in the chart should match the order used in tables and map legends.
This tiny consistency makes it much easier for readers to orient themselves and follow the logic of the analysis.

#GIS #Geomorphometry #DataViz #OpenScience #RStats #terra #QGIS #InhuletsRiver #ggplot2 #SAGA #FOSS

Total surface area of geomorphon classes within the study region. Values are shown in square kilometres.
2025-11-24

🔎 Preliminary watershed delineation for the Inhulets River study

One of the early intermediate products from my broader research on the anthropogenic impacts on the #InhuletsRiver.
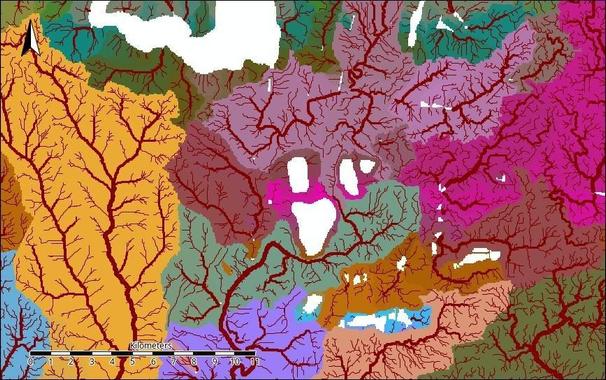
This map shows a preliminary delineation of local drainage basins across the study area, derived from high-resolution DEM processing and hydrological modelling.

The goal of this stage is to establish a consistent spatial framework for later analyses — including flow pathways, contaminant transport patterns, and the interaction between surface and groundwater systems.

#GIS #Hydrology #Watershed #Geomorphology #OpenData #RemoteSensing #Geospatial #RStats #SAGA #QGIS #EnvironmentalScience #LandscapeGeochemistry #Copernicus #DEM #GeoDataArt

Preliminary delineation of local drainage basins within the Inhulets River study area, based on DEM-derived flow accumulation and watershed boundaries.
2025-11-14

📌 Thematic hashtags I use in my Mastodon posts

To help readers navigate the different topics I work on, I use several specialized hashtags.
Here is a short overview of each one:

#GreennessOfCalgary — my project on analyzing the vegetation patterns and green spaces of Calgary using remote sensing, classification, and cartography.

#ClimateOfCalgary — visualization and analysis of local meteorological data.

#SvystunovaGully — materials from my Independent long-term study of geochemical processes in groundwater around a high-mineralized mine-water impoundment in Svystunova Gully (doi.org/10.5281/zenodo.15528794).

#InhuletsRiver — posts related to the research project on the technogenic impact on the Inhulets River (Kryvyi Rih, Ukraine), in which I take part.

#GeoDataArt #GeoSpectralArt — beautiful images that emerge during the analysis of satellite data.

The list will expand as my projects evolve.

2025-11-12

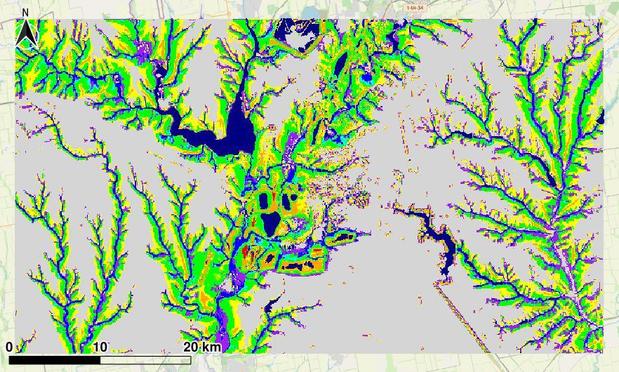
After several weeks of thinking and DEM preprocessing, I finally generated a complete geomorphons map for the part of Inhulets River basin (Ukraine).
It was far from easy — the original Copernicus GLO-30 DEM required careful cleaning, correction, and multi-step preparation before meaningful terrain forms could emerge.

What makes geomorphons truly valuable for me is how well they correspond to geochemical landscape types — eluvial, transeluvial, superaquatic, and subaquatic zones.
This overlap allows interpreting geomorphons as functional terrains with distinct element migration patterns, bridging geomorphology and environmental geochemistry.

All computations were done using R + SAGA GIS + QGIS, with the excellent Rsagacmd package for seamless tool integration.

#Geomorphons #SAGAGIS #Rsagacmd #QGIS #Geochemistry #RStats #Geospatial #Hydrology #RemoteSensing #Copernicus #OpenData #GIScience #InhuletsRiver #EnvironmentalGeochemistry #FOSS

Geomorphons of the Inhulets basin — terrain forms classified from Copernicus GLO-30 DEM using SAGA GIS and visualized in QGIS.
2025-11-10

🌊 Hydrological patterns in the Inhulets River Basin

I’m working on a large-scale study of the technogenic impact on the Inhulets River system (Ukraine).
The workflow combines R + SAGA GIS + QGIS for geomorphometric and hydrological analysis.

Over the past week, I’ve been refining digital elevation models and tracing surface runoff connectivity — not an easy task in a region reshaped by century of mining.

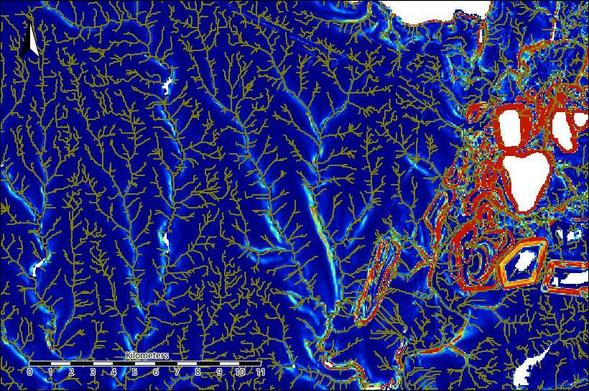
The map below shows one of the calmest and most “well-behaved” areas, far from the mining zone.
As for the drainage network over the mining areas… let’s just say it’s geological chaos down there 😄

🛰️ Data: Copernicus DEM (GLO-30)
🧭 Tools: SAGA GIS (Terrain Analysis), R, QGIS

#Hydrology #Geomorphometry #SAGAGIS #QGIS #RStats #DEM #GIScience #EnvironmentalModeling #MiningImpact #Geodata #InhuletsRiver #Ukraine #KryvyiRih #Copernicus #CopernicusDem

Extracted drainage network and real surface area patterns for the western part of the Inhulets Basin. Generated in SAGA GIS using the Terrain Analysis module.
2025-11-08

“If the map does not match the terrain — trust the terrain!”
— Principle of field geoscience

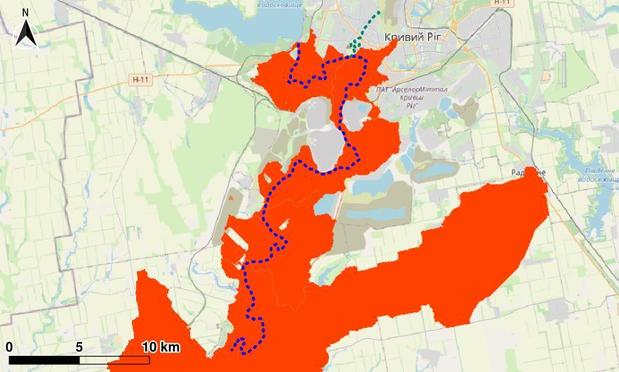
This is how the effective catchment area of the Inhulets River looks within the study region.

The upstream part — above the Karachunivske Reservoir's dam, the outlet of the Saksahan derivative tunnel, and the confluence of the Stara Saksahan River — was excluded from the calculation.

Within the analyzed area, surface runoff is possible only from the highlighted zone.
The rest of the “catchment basin” is hydrologically inactive: runoff is intercepted by ponds, settling tanks, and other anthropogenic landforms.

🌍 The analysis was based on the Copernicus GLO-30 DEM, integrated with hydrological modeling and terrain processing in open-source GIS.

#Hydrology #Geochemistry #InhuletsRiver #GIS #SAGAGIS #QGIS #HydrologicalModeling #RemoteSensing #GeospatialAnalysis #EnvironmentalData #RStats #LandscapeGeochemistry #Copernicus

The effective catchment area of the Inhulets River looks within the study region
2025-11-07

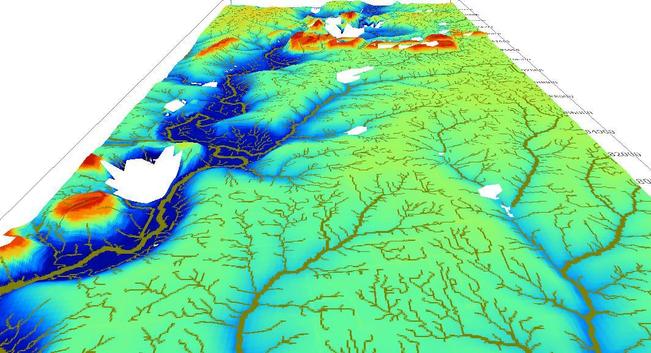
Over the past few days, I’ve been refining a detailed hydrological model for the Inhulets River basin (Ukraine).

The goal is to reconstruct real surface-flow connectivity in a region with both natural and technogenic relief — open-pit mines, tailings ponds, subsidence zones, and artificial drainage structures.

The work is part of a larger multi-year study on the geochemical and hydrological evolution of the Kryvyi Rih Iron Ore Basin.

(attached: 3D terrain visualization)

#Hydrology #Geomorphometry #opensourcegis #InhuletsRiver #SagaGis

Hydrological network and flow accumulation over a 3D digital terrain model

Client Info

Server: https://mastodon.social
Version: 2025.07
Repository: https://github.com/cyevgeniy/lmst