#NDVI

Anton Biatovanton_btv
2025-10-04

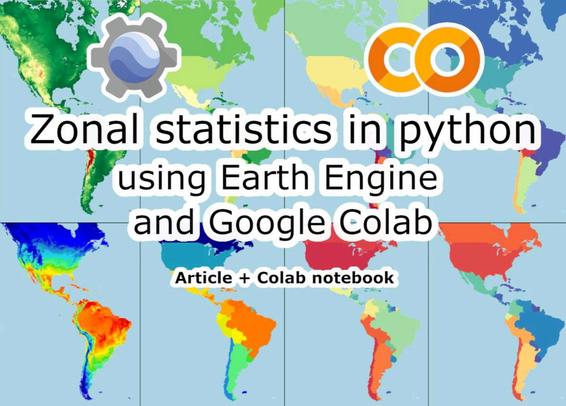
Zonal Statistics in Python with Earth Engine and Colab (New guide)

Inside:
• Template for processing multiple rasters at once
• Unified reducer (mean/median/std/min/max in one pass)
• Convert to GeoDataFrame
• Export to GPKG/CSV + upload to Google Drive
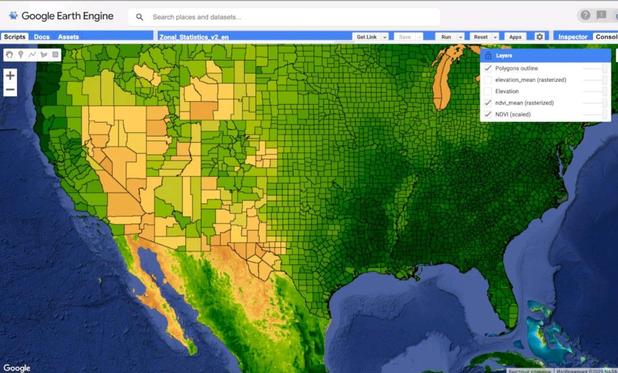
• Visual maps (relief, NDVI, soil temperature)

🎁 Bonus: ready-to-use Colab notebook at the end.

Read more: medium.com/@anton.biatov/zonal

---

Anton Biatovanton_btv
2025-10-01

Zonal statistics in Google Earth Engine in a single pass: how to combine terrain and NDVI into a single stack, calculate mean/median/standard deviation/min/max for thousands of polygons, and immediately visualize and export the results. Assembling the package + ready-made script.

Watch the full tutorial here:
medium.com/@anton.biatov/how-t

2025-09-23

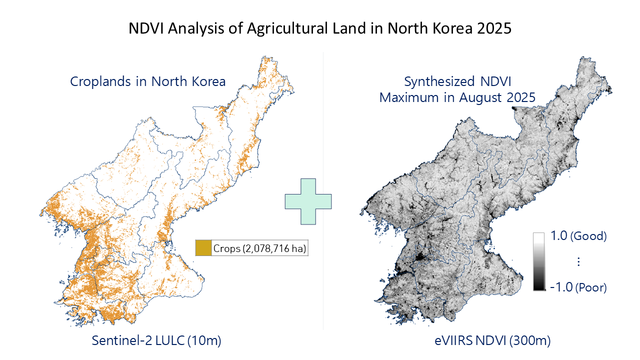
🛰️ Using satellite vegetation data (eVIIRS NDVI) to analyze North Korea's 2025 crop conditions:
📊 Key findings:

Vegetation index dropped slightly: 0.834 → 0.813 (-0.021)
Minimal change suggests harvest similar to 2024 or slightly worse
Data from NOAA's JPSS satellite via USGS EarthExplorer

⚠️ Limitation: Basic analysis using only vegetation imagery. Comprehensive assessment would need soil, weather, fertilizer data, etc.

dailynk.com/english/satellite-

Journal of Plant Ecologyjpecol
2025-09-06

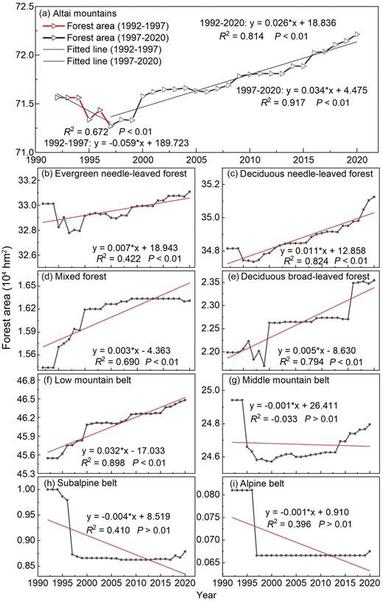
Liancheng Zhang et al. explore the impact of climate change and human activities on the and normalized difference vegetation index ( ) of the Altai Mountains.

| |

doi.org/10.1093/jpe/rtaf001

Dynamics of annual forest cover in the Altai Mountains from 1992 to 2020 (a: Altai Mountains; b: evergreen needle-leaved forest; c: deciduous needle-leaved forest; d: mixed forest; e: deciduous broad-leaved forest; f: low mountain belt; g: middle mountain belt; h: subalpine belt; i: alpine belt).
Adam H. Sparks :rstats:adamhsparks@rstats.me
2025-07-16

Do any #RStats users have a suggestion for R packages to access Sentinel-2 data, specifically NDVI now that {sen2r} is no longer maintained? I thought I saw something earlier this week but now I can't find it again. 🙏 #Sentinel2 #NDVI #DataAcess

Journal of Plant Ecologyjpecol
2025-06-25
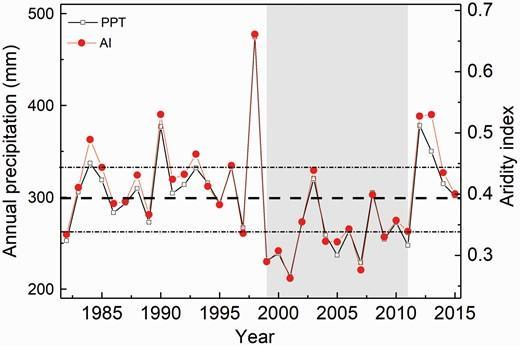
Annual PPT and aridity index (the ratio of PPT to PET) for the grassland region of Inner Mongolia in northern China for the period 1982–2015.
2025-04-12

IMAP Testing and Integration at NASA's Marshall Space Flight Center

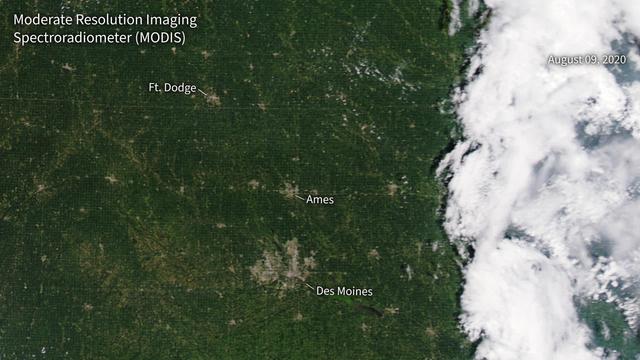
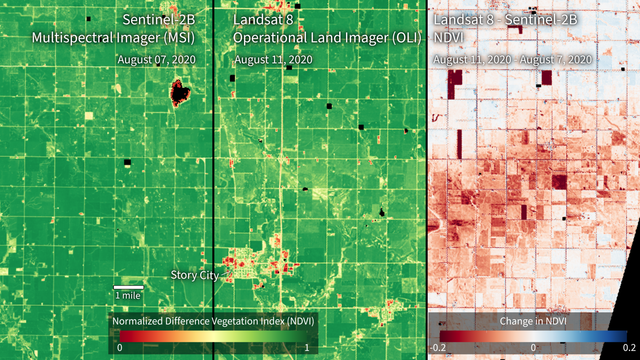
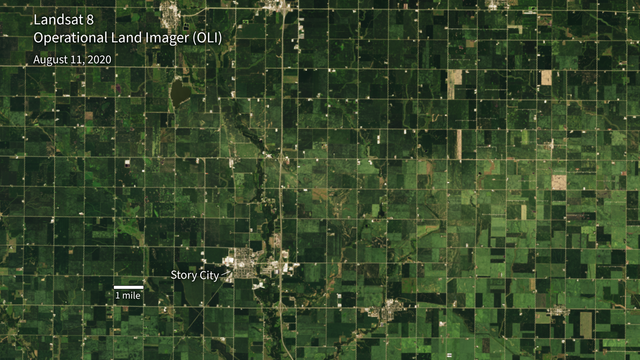
#Agriculture #Crop/PlantYields #Heliosphere #Imap #Iowa #LandSurface/agricultureIndicators #NDVI #PlantCharacteristics

⏩ 1 new picture and 2 new videos from NASA (SVS) commons.wikimedia.org/wiki/Spe

2020_Iowa_Derecho_(SVS31341).jpg2020_Iowa_Derecho_(SVS31341_-_Iowa_derecho_landsat_sentinel_ndvi_2048x1152).png2020_Iowa_Derecho_(SVS31341_-_Iowa_derecho_rgb_l8_20200811_2048x1152).png
💧🌏 Greg CocksGregCocks@techhub.social
2024-12-03

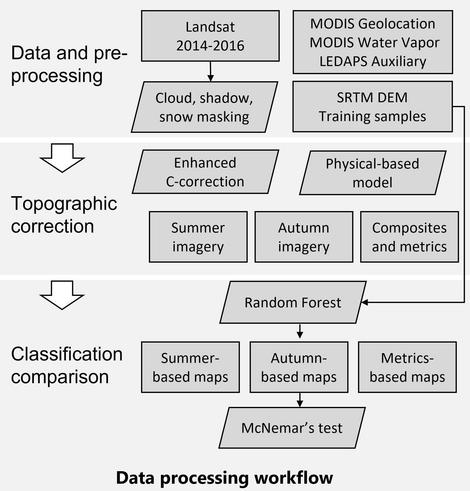
Integrated Topographic Corrections Improve Forest Mapping Using Landsat Imagery
--
doi.org/10.1016/j.jag.2022.102 <-- shared 2022 paper
--
“HIGHLIGHTS:
• [They] evaluated the impacts of topographic correction on forest mapping in the mountains.
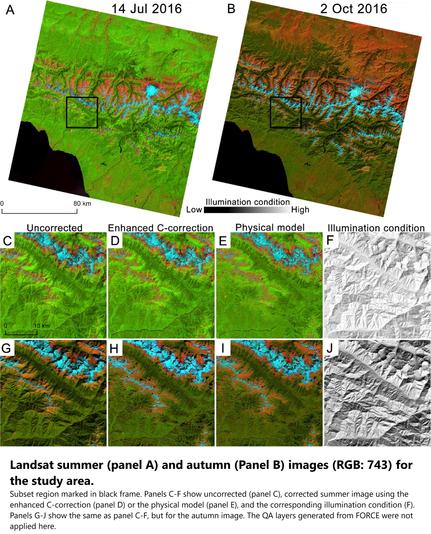
• The enhanced C-correction and the physical model reduced topographic effects.
• The corrected Landsat imagery time series resulted in higher accuracy.
• Terrain information improved classification but not as much as topographic correction.
• [They] recommend using topographic correction for forest cover mapping..."
#GIS #spatial #AtmosphericCorrection #IlluminationCondition #LandCover #ModelComparison #TimeSeries #TopographicCorrection #remotesensing #comparasion #topographic #correction #NDVI #forest #vegetation #model #modeling #spatialanalyis #accuracy #forestcover #Russia #Georgia #CaucasusMountains #spatiotemporal #landsat #elevation #DEM

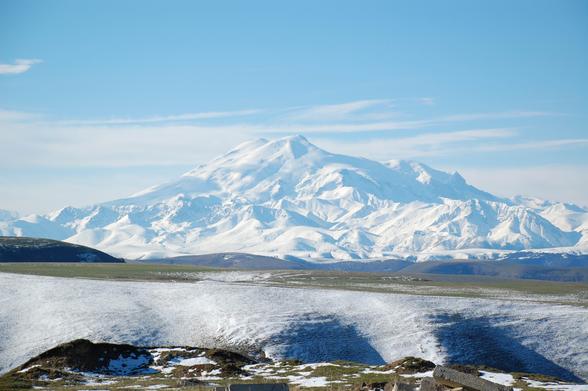
graphic - Data processing workflowphoto - Mount Elbrusmaps / images - Landsat summer (panel A) and autumn (Panel B) images (RGB: 743) for the study area. Subset region marked in black frame. Panels C-F show uncorrected (panel C), corrected summer image using the enhanced C-correction (panel D) or the physical model (panel E), and the corresponding illumination condition (F). Panels G-J show the same as panel C-F, but for the autumn image. The QA layers generated from FORCE were not applied here.map - Forest cover classification agreement among the 18 sets of input variables. Pixels in red color were classified by all sets of input variables as coniferous, in green color as broadleaf forest, and in blue color as mixed forest. Black color indicates that no forest was predicted by any set of input variables. Two subsets A and B which are marked in white frames were zoomed in for a detailed map comparison in [another figure]
2024-11-26

Vegetation #NDVI and Urban Heat Islands #UHI of #Txorierri obtained from a #Landsat9 image from July. Heat accumulation in industrial areas and airport is evident but what happens in #AthleticClub training fields? #RemoteSensing #rstats #GIS #Larrabetzu #Lezama #Zamudio #Derio #Loiu #Sondika

2024-11-24
2024-11-23

Ich weiß nicht ob das experimentell genug ist für den #FotoVorschlag heute. Die Bilder habe ich mit einem #raspberrypi mit Touch und der #pinoir Kamera gemacht (darf kein infrared-blocking filter haben). Ich hab ein Skript geschrieben das mein Pi immer das 'custom low effort Digicam Script' bootet und via Touch auslöst. Vor der Kamera war ein Blaufilter. Ist eine low budget Technik um die Pflanzengesundheit zu checken (#NDVI). Irgendwann will ich das nochmal machen

#infrared #citizenscience

Das sowjetische Ehrenmal im Berliner Treptower Park. Durch den Blaufilter und dem fehlenden infrared-blocking filter der Pi-Noir Kamera wird alles grün knallig weiß.Das sowjetische Ehrenmal im Berliner Treptower Park. Durch den Blaufilter und dem fehlenden infrared-blocking filter der Pi-Noir Kamera wird alles grün knallig weiß. Im Fokus liegt die Statue der "Mutter Heimat"Das sowjetische Ehrenmal im Berliner Treptower Park. Wenn der Blaufilter nicht gerade vor der Pi-Noir Kamera war verschiebt sich das grün in Richtung pink. Gerade die Gänseblümchen ploppen dadurch erst recht hervor.Das sowjetische Ehrenmal im Berliner Treptower Park. Durch den Blaufilter und dem fehlenden infrared-blocking filter der Pi-Noir Kamera wird alles grün knallig weiß.
Tuomas Väisänen 📼🧟‍♂️waeiski@vis.social
2024-11-12

I have to share my colleague's first #PhD paper. It is a cool one!

Comparison of #greenery across 86 European cities and their active travel environments.

Residential areas are much more green than travel environments in European cities. Seasonality is often overlooked, but crucial for accurate assessments of #urban greenery.

Klein, et al. (2024) Temporal variation in travel greenery across 86 cities in Europe.

doi.org/10.1016/j.ufug.2024.12

#accessibility #mobility #europe #ERC #GreenTravel #NDVI

Figure showing differences in the greenery of residential areas and travel environments using NDVI. The cities shown as maps are Helsinki, London, and Las Palmas.
2024-09-18

SNAP-Tutorials #12 - Introductory Remote Sensing
In this series of videos Shaun Levick explores #Sentinel-2 data, calculates #NDVI and classifies data using different classification methodologies, like unsupervised, supervised and supervised Random Forest.

Tutorial: youtube.com/playlist?list=PLf6
Shaun Levick: linkedin.com/in/shaun-levick-0

#tutorial #esa_snap #eo #remotesensing

2024-09-06

New publication: Normalized difference #vegetation index analysis reveals increase of #biomass production and stability during the conversion from conventional to #organicfarming. #sustainablelanduse #ndvi #yieldstability
doi.org/10.1111/gcb.17461

Figure 1 in Serrano-Grijalva et al. (2024): "Example of organic farm field paired with field from nearby conventional farm. Images were acquired from the Sentinel-2 satellite and processed in Google Earth Engine to obtain NDVI. Red polygon: conventional farm, blue polygon: organic farm. Green color represents greenness (NDVI). NDVI, normalized difference vegetation index."

Client Info

Server: https://mastodon.social
Version: 2025.07
Repository: https://github.com/cyevgeniy/lmst