Yay! Just discovered via Github that Unidata received its latest funding tranche and their developers are back to work!
#NetCDF
I am really looking forward to a time when scientific data analysis is less of a constant fuckaround and fight with technical bullshit. I'd *really* like
- #netCDF natively supporting complex numbers
- #Python #xarray and #pandas to natively support physical units (#pint is great on its own but the integrations leave a LOT to be desired)
- #Jupyter notebooks to suck less (crashes, glitches, widget plots not saved statically, an effing BUILTIN formatter, etc.)
- proper data pipeline systems
...
𝗖𝗙 𝗠𝗲𝘁𝗮𝗱𝗮𝘁𝗮 𝗖𝗼𝗻𝘃𝗲𝗻𝘁𝗶𝗼𝗻𝘀 support #OpenScience by automating processes via metadata in #NetCDF and #Zarr files. They establish a unified language for the #weather, #climate, #ocean, and #EO community. https://buff.ly/rGPuoku
#remotesensing #EarthObs
how to tell if #netcdf was compiled with s3 support ? (on linux, just installed from RPM)
even an example netcdf url that should work from a bucket would be helpful
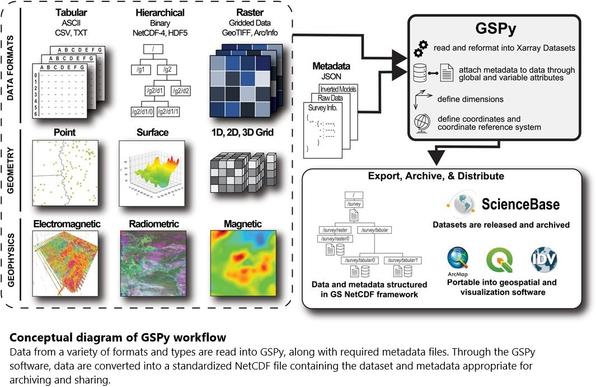
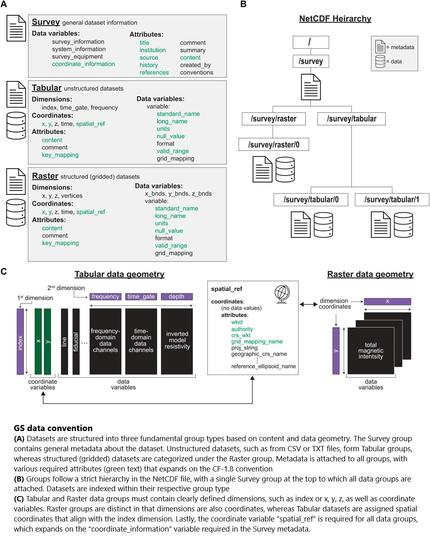
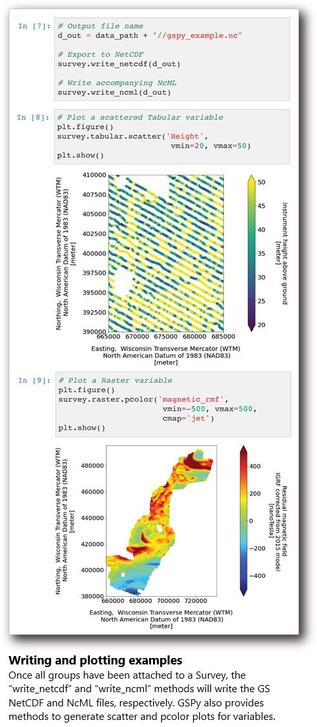
GSPy - A New Toolbox And Data Standard For Geophysical Datasets
--
https://doi.org/10.3389/feart.2022.907614 <-- shared paper
--
https://doi.org/10.5066/P9XNQVGQ | https://code.usgs.gov/g3sc/gspy <-- shared code repository
--
[an older paper, but code is in active and ongoing development/evolution]
#GIS #spatial #mapping #geophysics #geophysical #NetCDF #datatypes #code #opensource #library #dataformats #standardisation #standardization #openstandard #portable #metadata #Python #package #GSPy #methods #workflows #xarray #CRS #opendata #architecture #toolbox
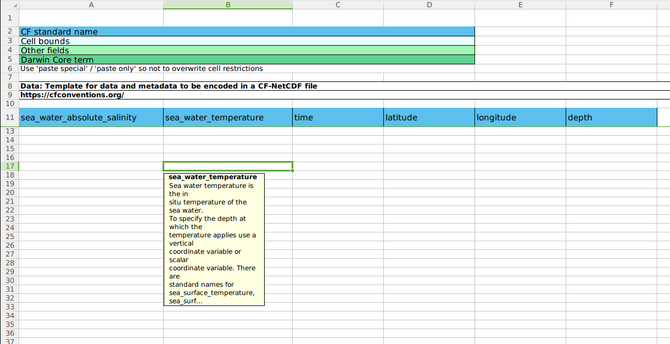
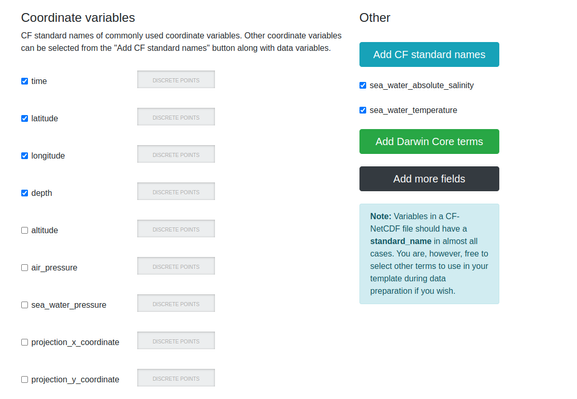
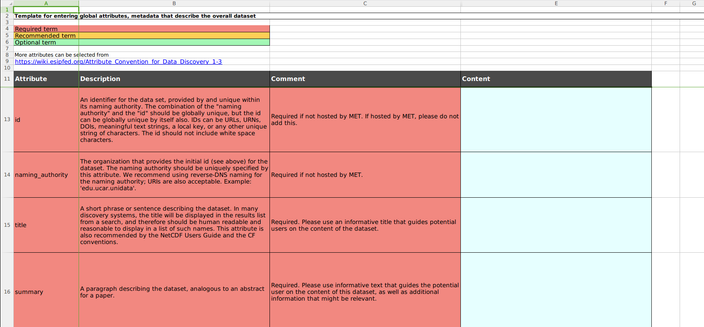
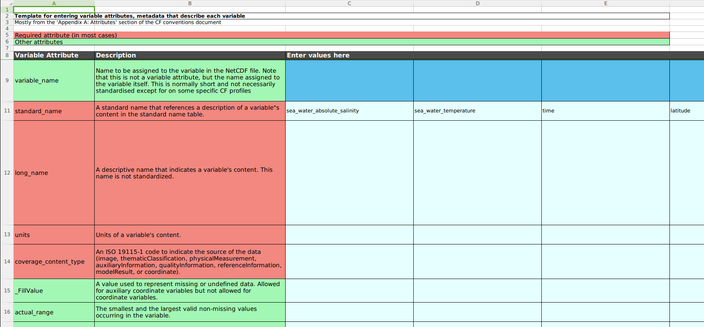
🎉 Generate spreadsheet templates for recording data and metadata for CF-NetCDF files! 🚀
The latest update adds a sheet for variable attributes—metadata describing each variable.
🔗 https://www.nordatanet.no/aen/template-generator/
Templates bring structure and enable automated CF-NetCDF creation with scripts. In the future, I plan to develop a converter tool ion top of this—upload a template, download a CF-NetCDF!
Excited to share that I'm now a member of the CF Conventions Committee! 🎉
CF (Climate and Forecast) conventions standardise how scientific data and metadata are stored in NetCDF files, ensuring consistency and machine readability. Looking forward to contributing and collaborating with the community to shape its future! 🌍
#CFConventions #NetCDF #FAIRData #ScientificData #DataScience
🚀 Excited to share my new FREE video tutorial on creating CF-NetCDF files using R! 🌟
In this video, you'll learn to:
• Ensure compliance with CF and ACDD conventions
• Work with 1D, 2D, and 3D data
• Manage irregular grids and moving instruments
🔗 Watch it here: https://youtu.be/IZDygRjfMIg
📖 Plus, check out the accompanying Jupyter book for code and explanations: https://nordatanet.github.io/NetCDF_in_R_from_beginner_to_pro/04_creating_a_cfnetcdf_file.html
#CFConventions #NetCDF #RProgramming #RStats #DataScience #ClimateData #FAIRData
I’m pleased to share that my NetCDF in Python and R tutorials are now available on NorDataNet. 🎉
Access them here:
Python: https://www.nordatanet.no/NetCDF-in-Python-from-beginner-to-pro
R: https://www.nordatanet.no/NetCDF-in-R-from-beginner-to-pro
These tutorials cover everything from basic data extraction to creating your own NetCDF files, ensuring they meet CF and ACDD standards for FAIR data.
NorDataNet enhances access to environmental datasets, supporting long-term preservation and interoperability. 🌍📊
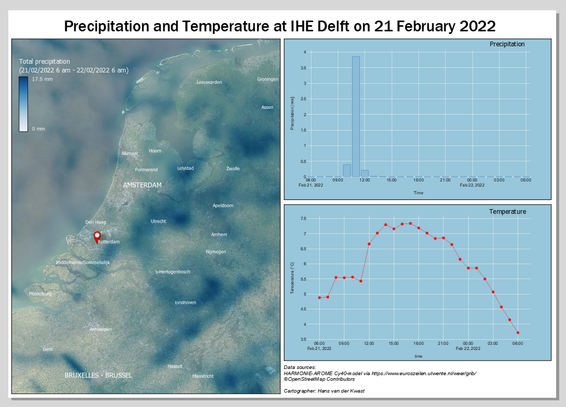
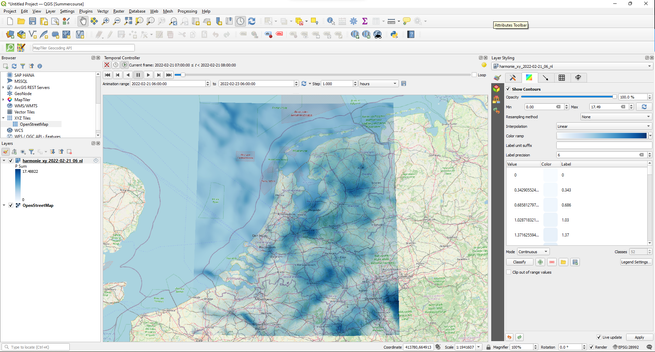
Using Mesh Data In QGIS [including accessing NetCDF data]
--
https://courses.gisopencourseware.org/course/view.php?id=72 <-- shared tutorial
--
https://youtu.be/OBi4wuxLiAE?si=_5DCAcsy8qjhsA-k <-- tutorial as a video
--
“Mesh data represents an unstructured grid that can include temporal and other components. It consists of vertices, edges, and faces that form a spatial structure in 2D or 3D space. Each vertex can store multiple datasets, which can also have a temporal dimension, making mesh data highly versatile for various applications such as meteorology, hydrodynamics, and environmental modeling…
This course is designed to equip you with the knowledge and skills needed to effectively work with mesh data within the QGIS environment…"
#QGIS #GIS #mesh #datavisualisation #NetCDF #climate #animation #openaccess #onlinelearning #learning #spatial #mapping #tutorial
🌍 Heading to the 2024 CF Workshop in Norrköping, Sweden! 🇸🇪 CF conventions are vital for ensuring data adheres to the FAIR principles. While NetCDF files are great, CF standards make data truly interoperable across disciplines.
I'll be sharing ideas on introducing CF to new disciplines like biology and geology, helping them unlock the full potential of their data. Excited to learn how CF conventions evolve and meet the community! 🌟
#FAIRData #CFConventions #Interoperability #NetCDF #OpenScience
🌍📊 Want to work with NetCDF files in Python? My tutorial series covers everything from opening and plotting NetCDF data to creating CF-compliant files for FAIR data publication.
Whether you're new to NetCDF or looking to enhance your skills, I've got you covered! 🚀 Check it out: https://lhmarsden.github.io/NetCDF_in_Python_from_beginner_to_pro
Topics include:
🔸Extracting data 📝
🔸Plotting 📈
🔸Creating CF-compliant files 🌐
🔸Granularity 🖥️
🔸CF & ACDD 🖥️
Suggestions? Let me know! #Python #DataScience #NetCDF #xarray #FAIRData #ClimateData
🚀 New Video Alert! 🚀
I’ve just released a tutorial on how to convert NetCDF data to CSV or XLSX using R. Whether you’re dealing with 1D, 2D, or 3D variables, this video will guide you through the process step-by-step.
🎥 Watch here: https://youtu.be/9-EDaRQ8Aps
#RStats #NetCDF #DataScience #FAIRdata #CSV #XLSX #Tutorial #YouTube
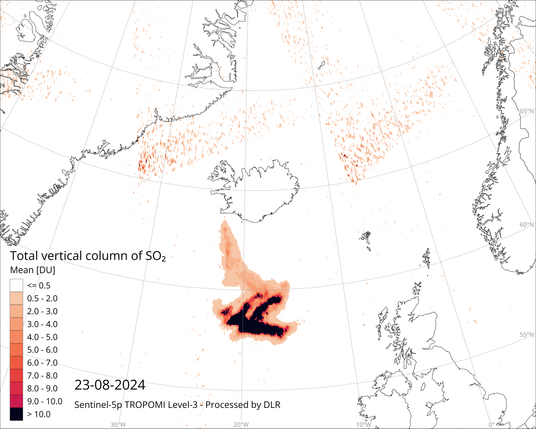
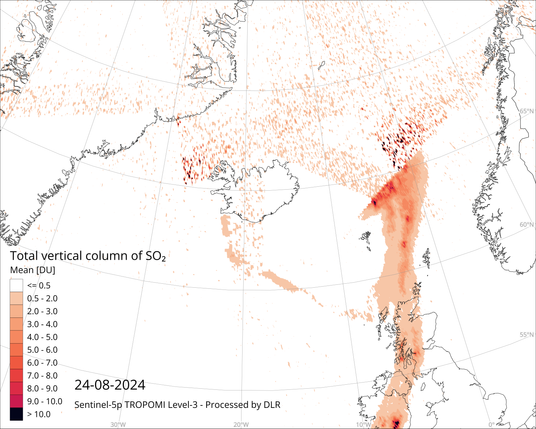
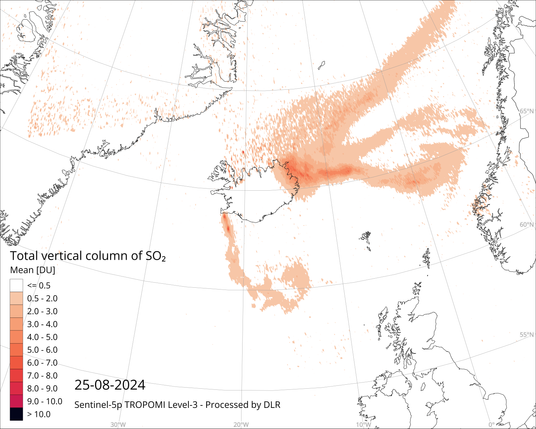
Day six of the sixth eruption near #Svartsengi and the town of #Grindavík This eruption is the largest one yet. Here is a 4-day series of #Sentinel5p satellite data from the #TROPOMI instrument showing the mean amount of SO₂ in a vertical column of atmosphere (Dobson units). With time this will turn into sulfate particles forming volcanic smog.
This level 3 data is made available by The German Aerospace Center as #NetCDF files and can easily be opend in #QGIS and visualized with MDAL library.
@roadskater
1) #netCDF is so much better than the individual formats thousands of scientists have made up over the decades. But I really wish people would use the metadata fields consistently (or at all).
2) Have you discovered IrfanView? It’s mostly just a viewer, but it handles every image type and many grid types that I’ve thrown at it. It is great for checking whether the netCDF shows what it’s supposed to.
Meanwhile, other software packages apparently can plot this stuff? I guess they have multiple coders, and funding to pay them all?
Otherwise, crud. The data grid mapping issue is a pain, but I figured that out. But… the data are in a structure, which… the library doesn't handle well (cough, gag) and disaster ensues.
There could be a career in sci software dev here. If one had the funding.
Spent some time the last few days examining whether I need to blow up and rewrite code in order to plot a satellite data product. Seemed from perusing a very necessary library API that it wouldn't need much work. On re-read, maybe more work. Sigh, now realizing that the API itself would need refactoring. Which, 1) their developers might say no, or 2) worse, they might say yes but they have SO many other demands.
The user who pinged me about this will probably be less than surprised. F!
