I'm used to the first soprano. But today I've got an oboe-ist - oboist? - doing scales. I love New York.
#NYC #garden #apartment #fire #escape #scales #arpeggios #practice #oboe #first #soprano #aria #opera #orchestra #pit #band #conduct #rehearse #ensemble #midtown #Manhattan #theatre #district #Broadway #musical #musician #instrument #double #reed #mouthpiece #spit #valve #treble #bass #clef #staff #music #quarter #notes #allegro #pianissimo #forte #andante #waltz #clog #tap #time #step
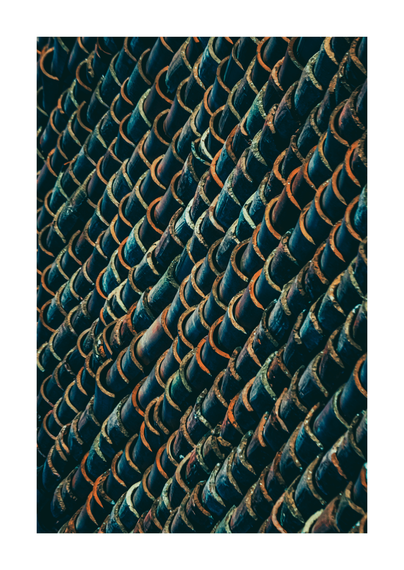
mermaid silks
#ImaginaryFabric #Silk #Mermaid #Scales #Shimmer #Oceanic #Stylized #Folds #Satin #Aquatic #Gold #Blue #Teal #Beige #Iridescent #Texture #Fantasy #Luxurious
#Img2img #AiArt #AiArtists #AiArtCommunity #StableDiffusion
on actual stuff: https://aieris.art/featured/mermaid-silks-eris-and-ai.html
Hi there :dragnowo:
The "Movie 300" filter in the #Gimp is pretty cool :dragnloaf:
On the photo: female Red Monster Bearded Dragon
Día 8 | Distribuciones – Histograma | #30DayChartChallenge. | Visualización hecha usando R con los paquetes #ggplot2, #dplyr, #patchwork, #sf, #ggtext, #showtext, #raster, #exactextractr, #ggscale y #scales.
Few days ago I was on the local exhibition/market in the reptile breeders' fest :dragnhearteyes:
So … sorry (but no sorry :dragnsarc:) — in the next few weeks my posts will be full of lizards and snakesss :dragnmlem:
On the photo: female Red Monster Bearded Dragon as I remember :dragnaww:
Día 25 | Incertidumbre – Riesgo | #30DayChartChallenge | Visualización hecha usando R a partir de los paquetes #ggplot2, #dplyr, #scales, #showtext y #sysfonts. | Fuente: Gannet – Virtual Assitant (app.gannet.ai) desarrollado por Data Friendly Space. La respuesta fue generada usando tres fuentes – 1) State of the Climate in Latin America and the Caribbean, 2) Latin America and the Caribbean Regional Overview of Food Security and Nutrition y 3) Anticipatory Action and Response Plan.
Day 23 | Timeseries – Log Scale | #30DayChartChallenge. Visualization made with R using #ggplot2, #dplyr, #showtext, #patchwork, #janitor and #scales. | Source: Our World in Data
Day 20 | Timeseries – Urbanization | #30DayChartChallenge. Visualization made with R using #ggplot2, #sf, #dplyr, #scales, #grid, #ggshadow, #extrafont and #cowplot. | Source: Worldometers
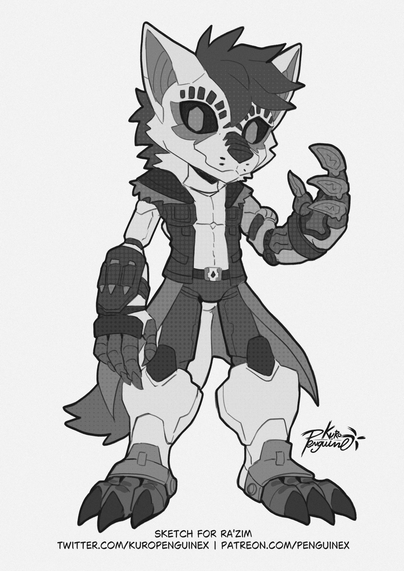
Now here's a nice actiony pose. What's Fuse hunting? Who knows! But his prey is going to go down...
Art by https://www.furaffinity.net/user/kendraw/
Fuse is https://linktr.ee/Ra_Zim
#furry #furryart #FuseRaZim #TobiKadachi #Lunagaron #MonsterHunter #fancharacter #TobiLunagaron #greyscales #orangeeyes #orangescales #male #anthro #scalie #scales
Look, I'm sure there are reasons to ever have a logarithmic scale for measuring things, but there's a lot of scales out there in the world which are completely unintuitive to humans when it comes to quickly understanding something.
Decibels? Utterly unintuitive.
Earthquakes? nope.
Scoville scale? garbage.
Schmidt sting pain index? useless.
I have invented the Skullvalanche Scale Usability Index (SSUI) to rank how useful these scales are.
Rankings are 1 to 10.
1 being "nobody would understand this, possibly including the person who invented it"
10 being “anyone who can count to 10 would understand this"
Now I will rank the aforementioned scales.
Decibels: 3
Earthquakes: 4
Scovilles: 3
Schmidt: 2
Día 3| Comparaciones – Círculos | #30DayChartChallenge. La visualización fue creada usando R basado en los paquetes #sf, #terra, #tidyterra, #extarctexactr, #ggplot2, #dplyr, #scales, #ggnewscale ,#ggtext, #patchwork y #showtext. Fuente SRTM y SIGMOF ICF - https://geoportal.icf.gob.hn