#accretionary

💧🌏 Greg CocksGregCocks@techhub.social
2024-02-27

Deep Structure of Siletzia in the Puget Lowland - Imaging an Obducted Plateau and Accretionary Thrust Belt With Potential Fields
--
doi.org/10.1029/2022TC007720 <--shared paper
--
[I used to live, work as an engineering geologist and scuba dive in Puget Sound & beyond – including on the expressions of the Seattle Fault…]
#GIS #spatial #mapping #engineeringgeology #Seattle #pugetsound #washingtonstate #fault #faulting #earthquake #tsunami #structuralgeology #PNW #plateboundary #crustal #tectonics #cascadia #forearc #siletzia #seismic #seismichazard #geologichazard #risk #hazard #glacial #sediments #pugetlowland #model #modeling #remotesensing #magnetic #aeromagnetism #gravity #folding #thrust #geologicmapping #geology #seismology #accretionary #obduction #spatialanalysis #spatiotemporal #seattlefault #earthquakehazard #earthquakeengineering

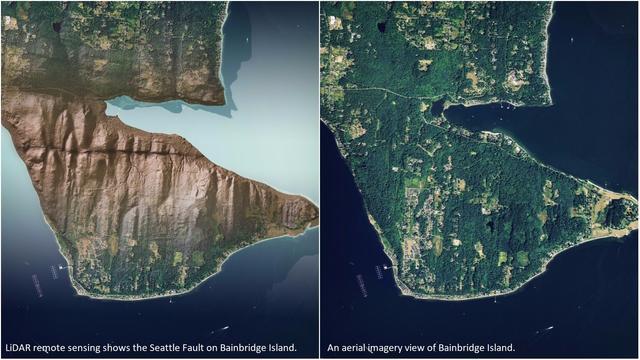
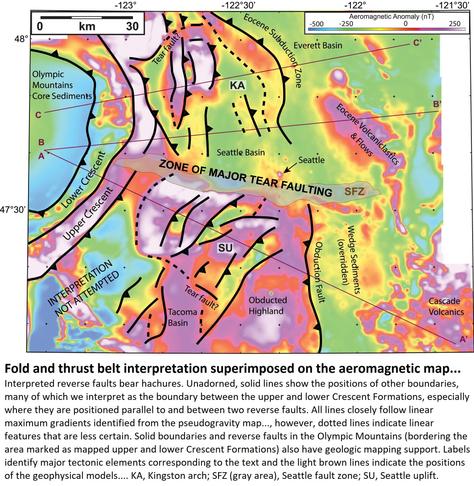
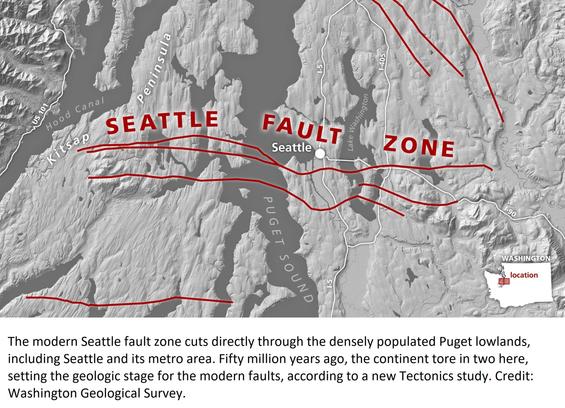
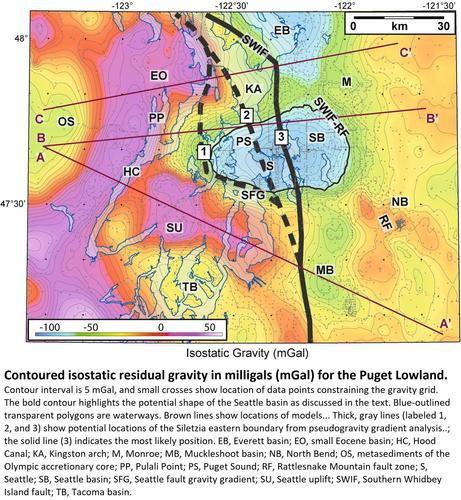
imagery / photos - aerial - remotesensing sensing - LiDAR - the expression of the Seattle Fault on southern Bainbridge Islandmap and model - Fold and thrust belt interpretation superimposed on the aeromagnetic map shown in Figure 4. Interpreted reverse faults bear hachures. Unadorned, solid lines show the positions of other boundaries, many of which we interpret as the boundary between the upper and lower Crescent Formations, especially where they are positioned parallel to and between two reverse faults. All lines closely follow linear maximum gradients identified from the pseudogravity map (Figure 5), however, dotted lines indicate linear features that are less certain. Solid boundaries and reverse faults in the Olympic Mountains (bordering the area marked as mapped upper and lower Crescent Formations) also have geologic mapping support. Labels identify major tectonic elements corresponding to the text and the light brown lines indicate the positions of the geophysical models in Figures 8-10. KA, Kingston arch; SFZ (gray area), Seattle fault zone; SU, Seattle uplift.graphic / map - hillshade and annotations showing the Seattle Fault Zone, Puget Soundmap and model - Contoured isostatic residual gravity in milligals (mGal) for the Puget Lowland. Contour interval is 5 mGal, and small crosses show location of data points constraining the gravity grid. The bold contour highlights the potential shape of the Seattle basin as discussed in the text. Blue-outlined transparent polygons are waterways. Brown lines show locations of models in Figures 8-10 (A–A′, B–B′, and C–C′, respectively). Thick, gray lines (labeled 1, 2, and 3) show potential locations of the Siletzia eastern boundary from pseudogravity gradient analysis shown in Figure 5 and discussed in the text; the solid line (3) indicates the most likely position. EB, Everett basin; EO, small Eocene basin; HC, Hood Canal; KA, Kingston arch; M, Monroe; MB, Muckleshoot basin; NB, North Bend; OS, metasediments of the Olympic accretionary core; PP, Pulali Point; PS, Puget Sound; RF, Rattlesnake Mountain fault zone; S, Seattle; SB, Seattle basin; SFG, Seattle fault gravity gradient; SU, Seattle uplift; SWIF, Southern Whidbey Island fault; TB, Tacoma basin.

Client Info

Server: https://mastodon.social
Version: 2025.04
Repository: https://github.com/cyevgeniy/lmst