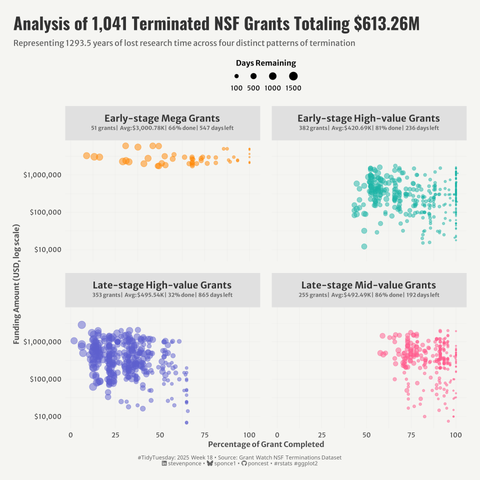
📊 #TidyTuesday – 2025 W18 | NSF Grant Terminations under the Trump Administration
.
🔗: https://stevenponce.netlify.app/data_visualizations/TidyTuesday/2025/tt_2025_18.html
.
#rstats | #r4ds | #dataviz | #ggplot2
#dataViz
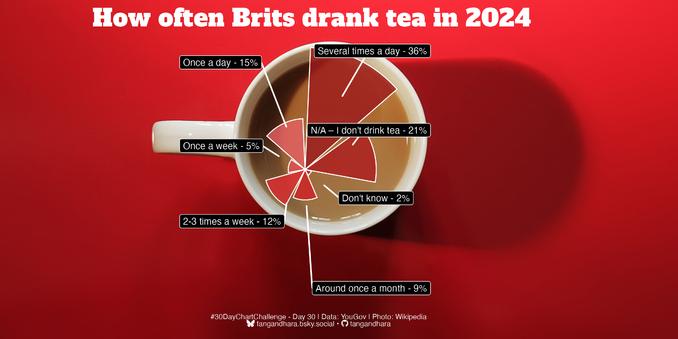
#30DayChartChallenge - Day 30: National Geographic theme The final one! I had no idea what the style was so I Googled and found some interesting charts about tea from NatGeo which I used as inspiration. Not happy with the placement of the chart but I quite like the final result. #rstats #dataviz
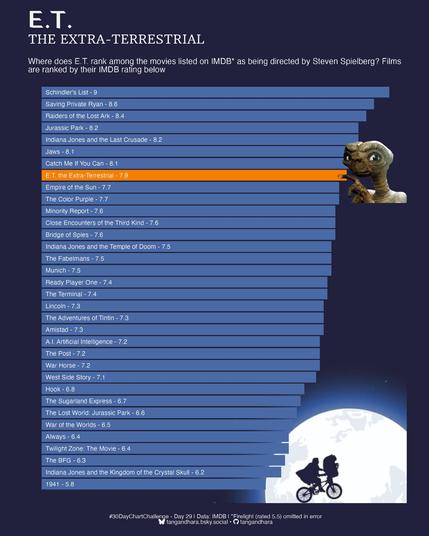
#30DayChartChallenge - Day 29: Extraterrestrial I chuckled putting this one together for lots of reasons but especially because I loved E.T. as a kid. All data was from IMDB and after failing at scraping it, the {datapasta} was a lifesaver! #rstats #dataviz
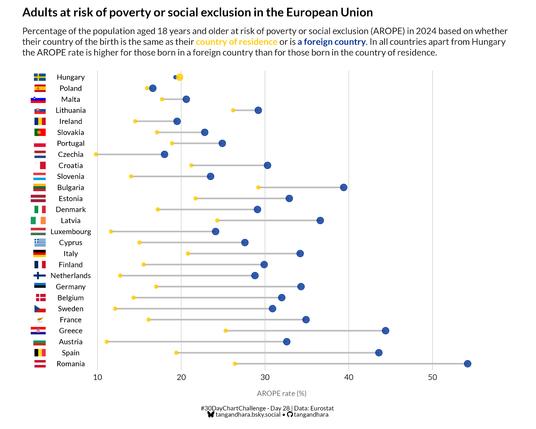
#30DayChartChallenge - Day 28: Inclusion What's the opposite of inclusion? Exclusion and this chart compares the rate of adults at risk of poverty or social exclusion in the EU based on their country of birth. #rstats #dataviz
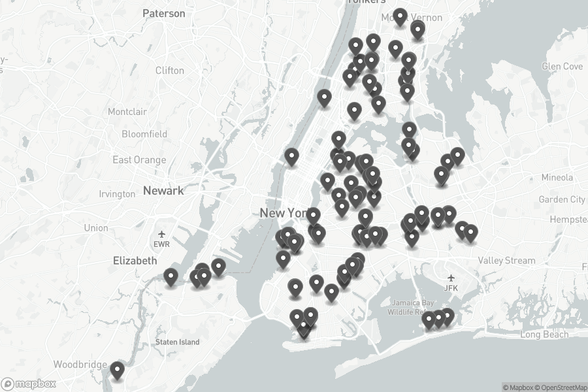
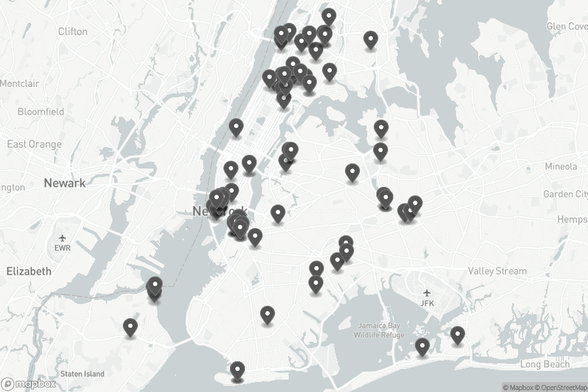
DARP-ROTOW Enrollment Status of Active Tow Truck Companies
Source: https://data.cityofnewyork.us/d/q5u8-89nv
#nyc #data #dataviz
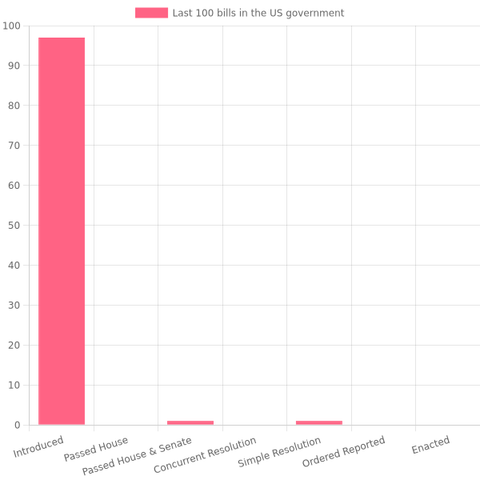
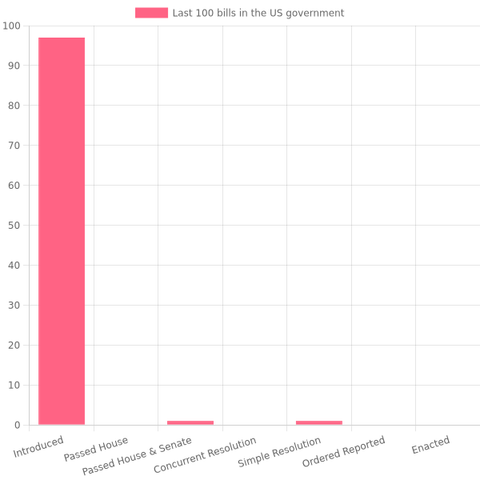
Breaking down the last 100 bills in the US #government. #dataviz #civictech
Do you need inspiration how to present a dataset in a clear figure and what package to use? Check out https://www.data-to-viz.com/ #rstats #dataviz @R_Graph_Gallery
Bonjour 👋
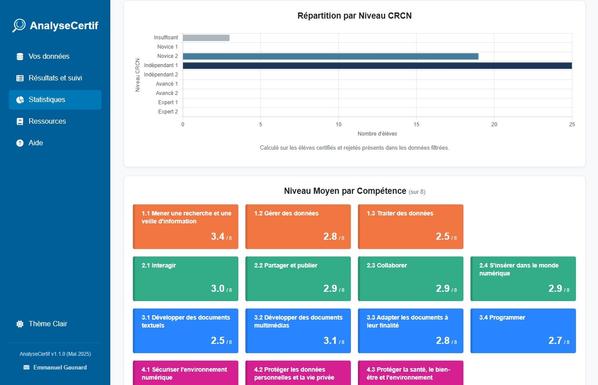
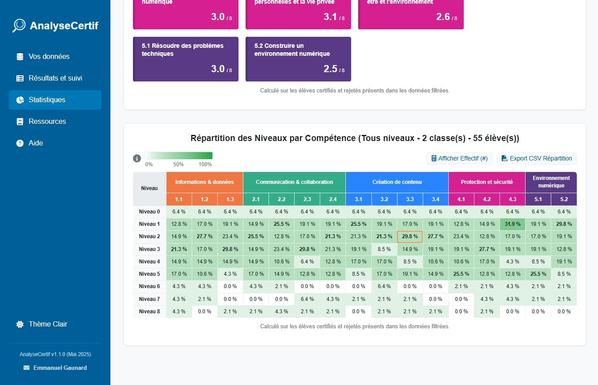
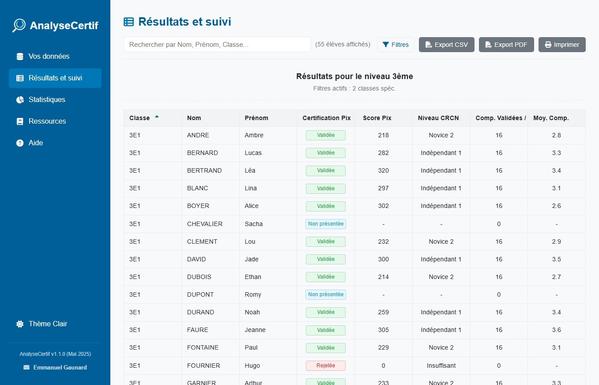
Voici ma nouvelle appli web AnalyseCertif, outil pour simplifier l'analyse/suivi des résultats #CertificationPix.
Sur La Forge : https://gaunardemmanuel.forge.apps.education.fr/analysecertif/
📊 Traitement 100% local (#RGPD !)🔒.
Import CSV/XML, tableau dyn. (tri, filtre #CRCN 👍), stats clés & #DataViz, export CSV/PDF📄.
N'hésitez pas à utiliser, partager & faire vos retours ! #Pix #OutilPédagogique #AnalyseDeDonnees #Forge #Enseignement
Capital Grant Awards 2014
Source: https://data.cityofnewyork.us/d/9umc-3b2y
#nyc #data #dataviz
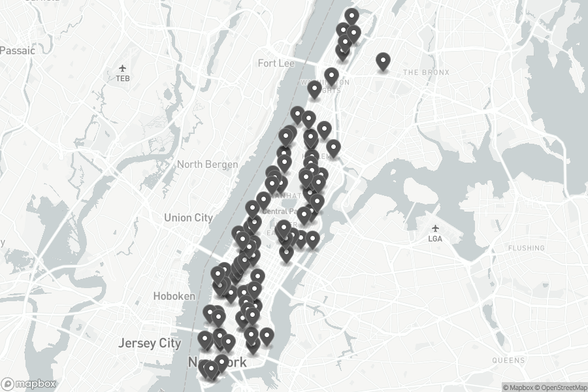
SCOUT CORE
Source: https://data.cityofnewyork.us/d/xrwg-eczf
#nyc #data #dataviz
Analyzing the last 100 bills in the US #government. #dataviz #civictech
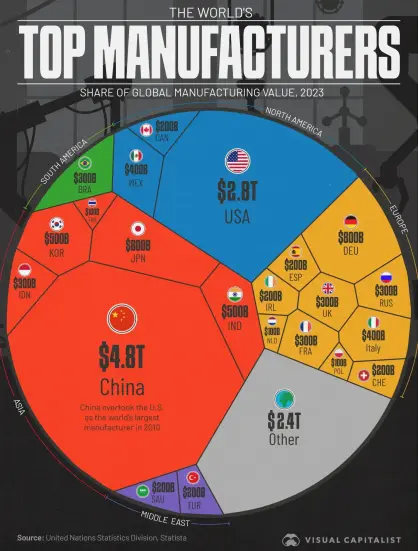
#Global share of #manufacturing value in 2023 by #country
#China #CN #UnitedStates #US #Japan #JP #Germany #DE #SouthKorea #KR #India #IN #Mexico #MX #Italy #IT #France #FR #Brazil #BR #UnitedKingdom #UK #Russia #RU #Indonesia #ID #Turkey #TR #Canada #CA #Spain #ES #Ireland #IE #Switzerland #CH #SaudiArabia #SA #Poland #PL #Thailand #TH #Netherlands #NL #world #international #economics #economy #industry #tariff #tariffs #graphics #data #DataViz
From easter egg to Christmas tree real quick ! #dataviz #science @graph_tool
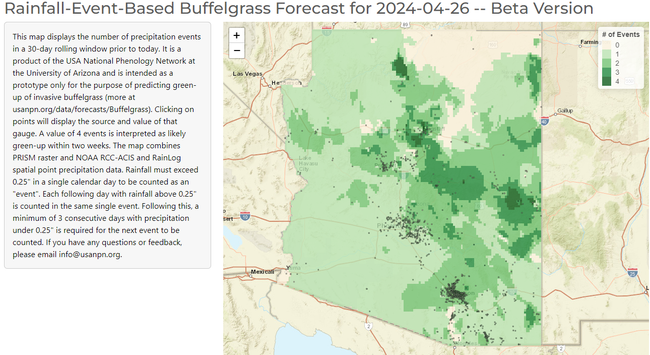
🌿🌧️ Predicting the extent of invasive Buffelgrass is important for its management. Travis Matlock, a runner-up in the @uazlibraries 2024 #DataVisualization Challenge, in collaboration with the USA NPN, created an informative map that tracks rainfall "events" over a 30-day period to forecast buffelgrass green-up 1–2 weeks in advance. Check out the map here: https://doi.org/10.25422/azu.data.25705419
Travis Matlock (2024). CC-BY 4.0. #OpenData #OpenScience #DataViz #buffelgrass #climatedata #UniversityofArizona
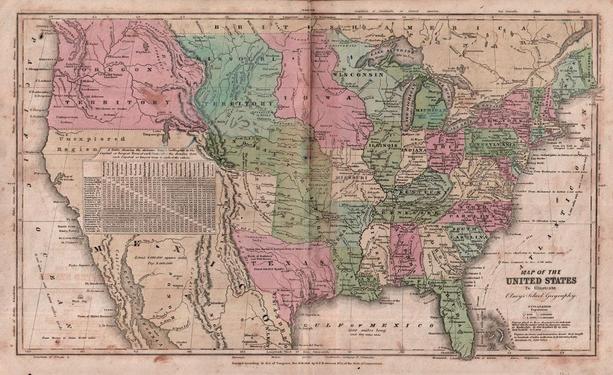
From 1841, a fine example of the rapidly changing West and its sprawling territories. Shows the intended permanent Indian lands of the central plains, which wouldn't last a decade
Also a funny data visualization cheat. If you have a large "Unexplored Region" mask your ignorance by adding a distance chart.
🇺🇸 📉 **This Year is the 5th Worst Start to a Year in S&P 500 History**
🔗 https://www.visualcapitalist.com/this-year-is-the-5th-worst-start-to-a-year-in-sp-500-history/.
📊 30 Day Chart Challenge Blog Post 📊
Featuring:
🧠 What I've learned
🤩 My favourite charts
🤞 Advice if you're thinking about participating!
Link: https://nrennie.rbind.io/blog/30-day-chart-challenge-2025/
