Pour le plaisir des yeux (et du neurone) #Mapping #DataVizualisation
#datavizualisation
October is just stating and perhaps it is a good opportunity to learn something new. Maybe you are interested
#DataScience, #Analytics, #MachineLearning #ArtificialIntelligence or perhaps #Statistics or #DataVizualisation?
If so you can get a 20% discount with Routledge and CRC Press on my books (as well as others). Take a look.
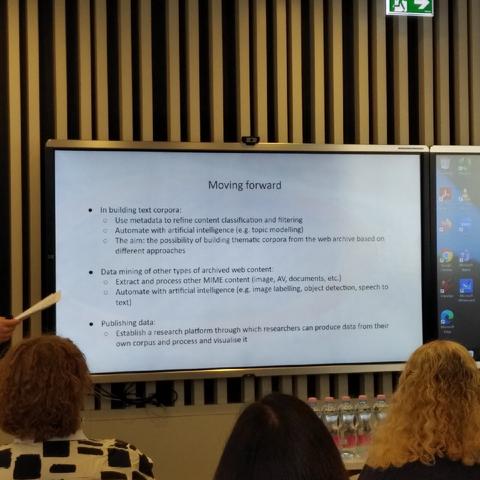
these are the plans for "moving forward" this interesting project. #Ukraine #webarchiv #researchdata #datavizualisation #LIBER2023
The new course in my master's program for January 2nd just unlocked on Canvas. This will be the midway marker for my degree and will result in a graduate certificate in data analytics at the end of this particular course. We're covering data visualization and reporting with Tableau, though I'm going to try to do some of it with permission in Power BI.
#datavis #datavizualisation #graduateschool #tableau #powerbi
:python: :kubernetes: :gitlab: Yihaa! Just finished a succesfull meeting pitching a dashboard with steering information instead of a monthly set of excell to be ploughed through by the management team! #datavizualisation #python #EBS #OracleAnalyticsServer
Salut à toutes et tous,
Qu'utilisez vous pour représenter en camemberts, diagrammes ou autres des résultats de requêtes depuis des donnés d'ElasticSearch? Je cherche une solution directe sans passer par une extraction puis copier-coller vers une appli qui fait des graphiques...
Merci par avance.
#digitalhumanity #digipres #ElasticSearch #json #datavizualisation
A simple plot for this week's #TidyTuesday hiding lots of messy data wrangling in the background! I calculated the change in estimated number of open museums in areas with different levels of deprivation 🏛️🏛️🏛️
Code: https://github.com/nrennie/tidytuesday/tree/main/2022/2022-11-22
#RStats #R4DS #DataViz #DataVisualisation #DataVizualisation
For the "minimal" prompt on #Day16 of the #30DayMapChallenge, can you guess which city this is just from the road network around it?
Code: https://github.com/nrennie/30DayMapChallenge/blob/main/2022/scripts/16_minimal.R
#RStats #15MinuteMaps #DataViz #DataVisualisation #DataVizualisation #Mapstodon #Maps
A thread about this week’s #TidyTuesday data on page metrics: recreating graphics using #RStats and detecting changes in time series data! To start off with, for this week’s data about page metrics, I recreated the graphic in this article [https://blog.datawrapper.de/why-web-pages-can-have-a-size-problem/](https://blog.datawrapper.de/why-web-pages-can-have-a-size-problem/) 🧵
#DataViz #R4DS #DataVisualisation #DataVizualisation #Statistics
It's #Day13 of the #30DayMapChallenge and the theme is "5 minutes" - so how far can you get from Oxford Train Station in 5 minutes?
Code: https://github.com/nrennie/30DayMapChallenge/blob/main/2022/scripts/13_five_minutes.R
#RStats #15MinuteMaps #DataViz #Mapstodon #DataVisualisation #DataVizualisation #Spatial
Inspired by Calle Börstell to make something akin to radio dials for this week's #TidyTuesday dataset on radio stations in the USA!
Thanks to Frank Hull and Erin for the data this week!
Code: https://github.com/nrennie/tidytuesday/tree/main/2022/2022-11-08
#rstats #r4ds #DataViz #DataVisualisation #DataVizualisation
@thegradient Hello! I'm a #DataScientist and #DataVizualisation enthusiast. I'm currently taking part in the #30DayMapChallenge and remastering my undergrad thesis to be a part of my #Data portfolio.
The "making of" in #ggplot2 recorded with {camcorder}!
YouTube: https://youtube.com/shorts/Z0b7cZJWSDM
#RStats #DataViz #r4ds #GBBO #DataVisualistion #TidyTuesday #DataScience #DataVizualisation
Inspired by Cara Thompson
to make some cakes for this week's #TidyTuesday using Great British Bake Off data! 🍰 🍰 🍰 The {bakeoff} R package is awesome!
Code: https://github.com/nrennie/tidytuesday/tree/main/2022/2022-10-25
#RStats #DataViz #r4ds #GBBO #DataVisualistion #ggplot2 #DataScience #DataVizualisation
Nicht nur 2018 war voll mit spontanvagabundierenden Daten: https://informationisbeautiful.net/visualizations/worlds-biggest-data-breaches-hacks/ #datavizualisation
RT @hernandezguell@twitter.com: Course content from the Knight Center for Journalism in the America's massive open online course (MOOC) "Data Visualization for Storytelling and Discovery." #storytelling #datavizualisation
https://journalismcourses.org/data-viz-course-material.html
🐦🔗: https://twitter.com/hernandezguell/status/1033669058821013504

