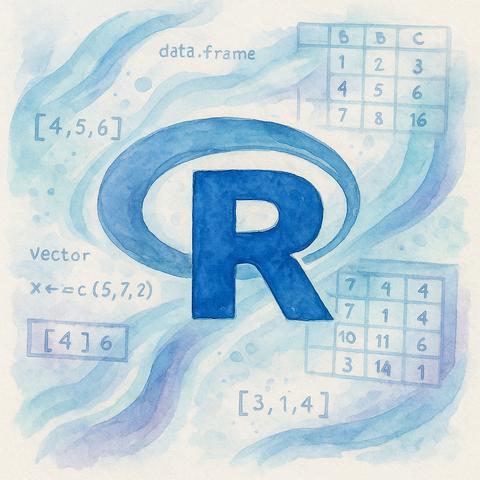
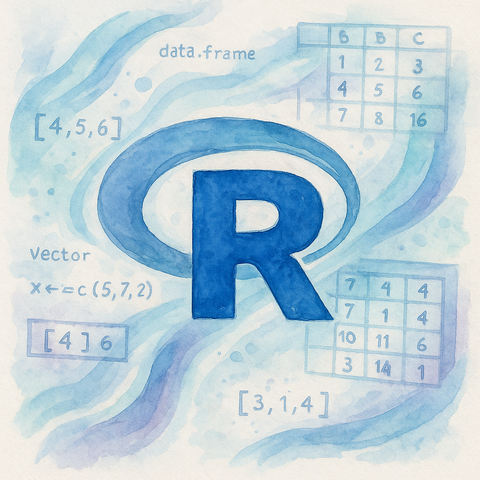
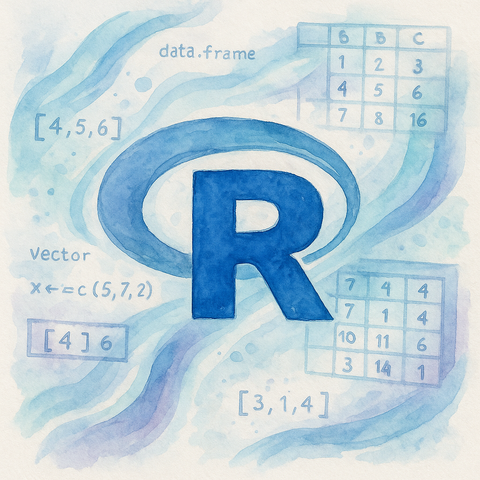
I've talked about creating data.frames and tibbles before, but it is an important topic so I have covered it again. This time specifically from the perspective of creating them from vectors. Post: www.spsanderson.com/steveondata/... #R #RStats #tibble #dplyr #tidyverse #dataframe #baseR #blog
#dplyr
I've talked about creating data.frames and tibbles before, but it is an important topic so I have covered it again. This time specifically from the perspective of creating them from vectors.
Post: https://www.spsanderson.com/steveondata/posts/2025-06-09/
#R #RStats #tibble #dplyr #tidyverse #dataframe #baseR #blog #Technology
# objetivo: Simulación de 100 agentes durante 30 días
# - Cada agente puede estar en 3 estados
# - Cada estado tiene diferentes atributos
# salidas : Tablas de frecuencia de frecuencias de 3 vias:
# - Combinación de estados de 100 agentes cada dia
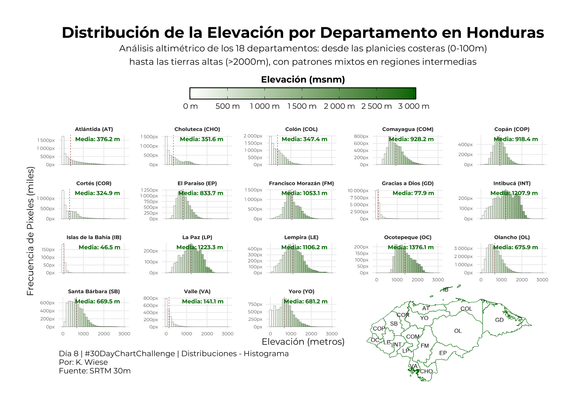
Día 8 | Distribuciones – Histograma | #30DayChartChallenge. | Visualización hecha usando R con los paquetes #ggplot2, #dplyr, #patchwork, #sf, #ggtext, #showtext, #raster, #exactextractr, #ggscale y #scales.
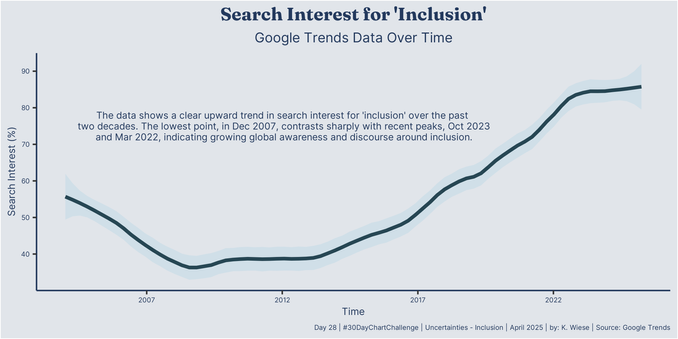
Day 28 | Uncertainties – Inclusion | #30DayChartChallenge. Visualization made with R using #ggplot2, #dplyr, #ggtext and #showtext | Source: Google Trends.
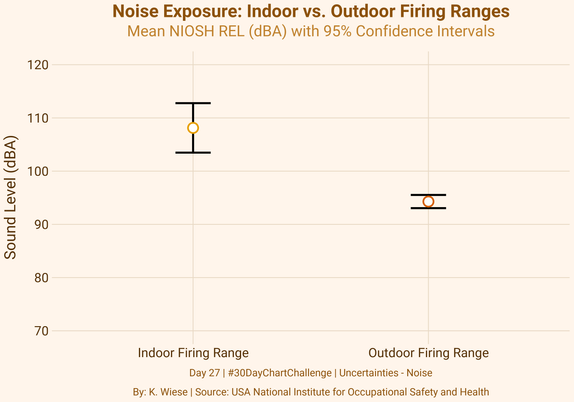
Day 27 | Uncertainties – Noise | #30DayChartChallenge. Visualization made with R using #ggplot2, #showtext and #dplyr | Source: USA - National Institute for Occupational Safety and Health.
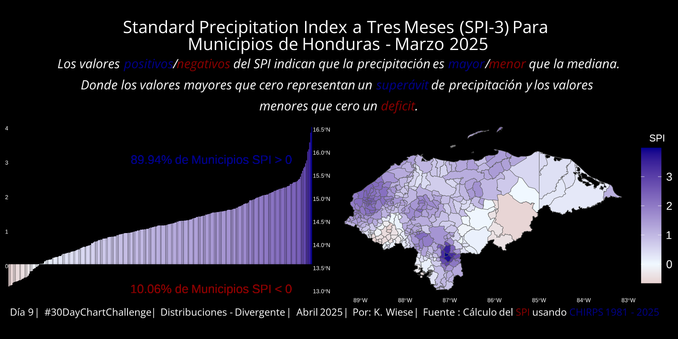
Día 9 | Distribuciones – Divergente | #30DatChartChallenge. | Visualización hecha usando R con los paquetes #ggplot2, #dplyr, #patchwork, #sf, #ggtext, #showtext, #raster, #exactextractr and #SPEI.
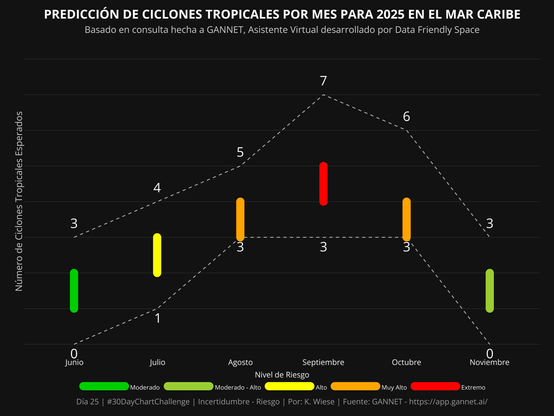
Día 25 | Incertidumbre – Riesgo | #30DayChartChallenge | Visualización hecha usando R a partir de los paquetes #ggplot2, #dplyr, #scales, #showtext y #sysfonts. | Fuente: Gannet – Virtual Assitant (app.gannet.ai) desarrollado por Data Friendly Space. La respuesta fue generada usando tres fuentes – 1) State of the Climate in Latin America and the Caribbean, 2) Latin America and the Caribbean Regional Overview of Food Security and Nutrition y 3) Anticipatory Action and Response Plan.
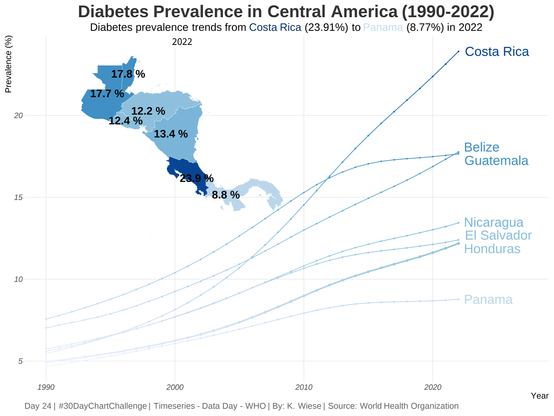
Day 24 | Timeseries – Data Day – WHO | #30DayChartChallenge. Visualization made with R using #ggplot2, #dplyr, #showtext, #patchwork, #ggrepel, #glue, #ggtext, #sf and #rnaturalearth. | Source: WHO.
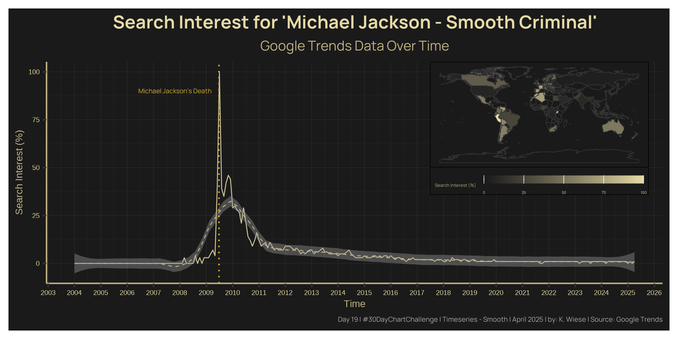
Day 19 | Timeseries – Smooth | #30DayChartChallenge. Visualization made with R using #ggplot2, #dplyr, #ggtext, #showtext, #patchwork, #sf and #rnaturalearth. | Source: Google Trends
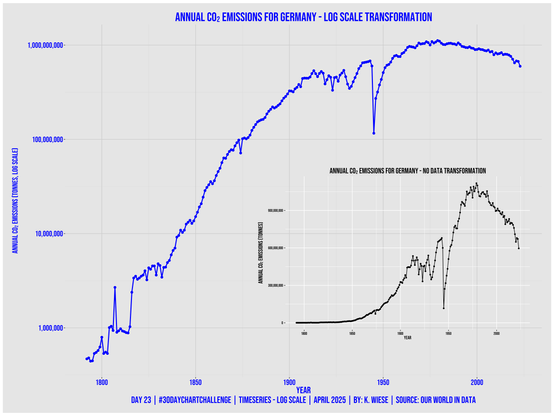
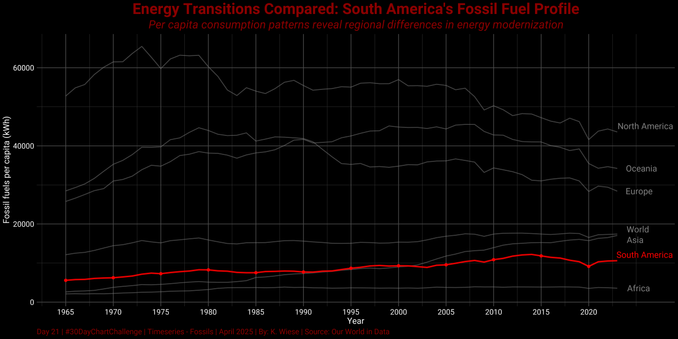
Day 23 | Timeseries – Log Scale | #30DayChartChallenge. Visualization made with R using #ggplot2, #dplyr, #showtext, #patchwork, #janitor and #scales. | Source: Our World in Data
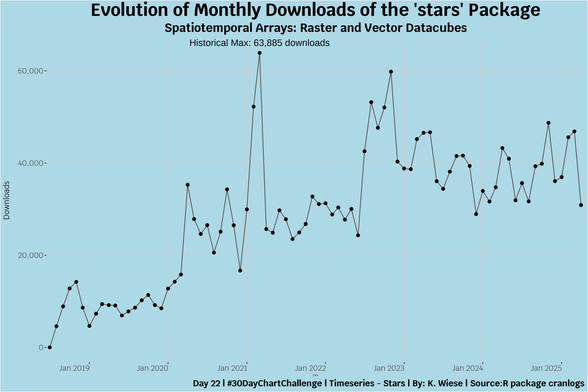
Day 22 | Timeseries – Stars | #30DayChartChallenge. Visualization made with R using #ggplot2, #dplyr, #showtext, #lubridate and #cranlogs. | Source: cranlogs R Package.
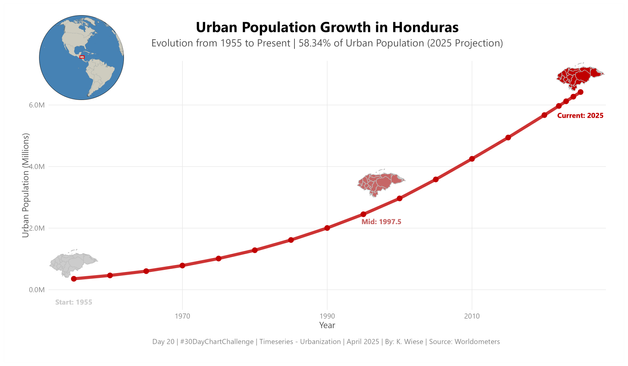
Day 20 | Timeseries – Urbanization | #30DayChartChallenge. Visualization made with R using #ggplot2, #sf, #dplyr, #scales, #grid, #ggshadow, #extrafont and #cowplot. | Source: Worldometers
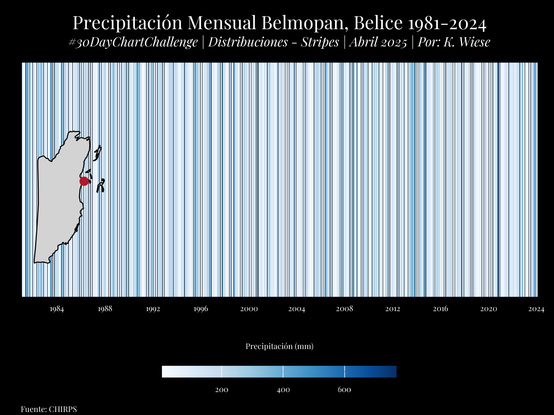
Día 11 | Distribuciones – “Stripes” | #30DayChartChallenge. La visualización fue creada usando R basado en los paquetes: #ggplot2, #dplyr, #sf, #lubridate, #ggtext, #showtext, #RcolorBrewer, #rnaturalearth y #cowplot. Fuente: CHIRPS.
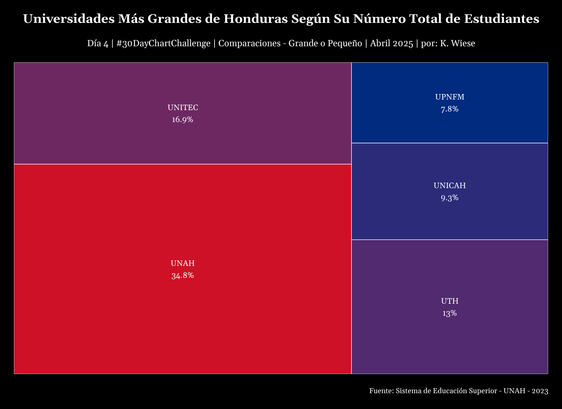
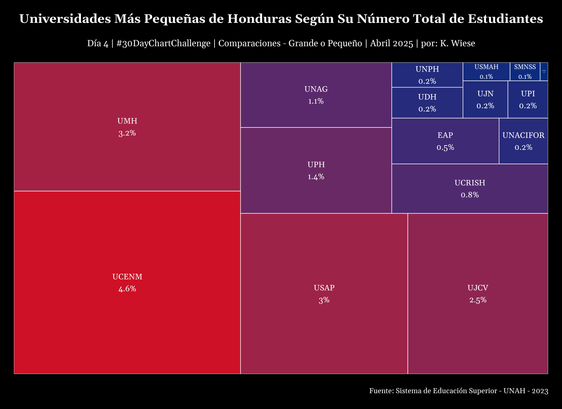
Día 4 | Comparaciones – Grande o Pequeño | #30DayChartChallenge. La visualización fue creada usando R basado en los paquetes: #ggplot2, #dplyr, #treemapify. Fuente: Sistema de Educación Superior - UNAH – 2023.
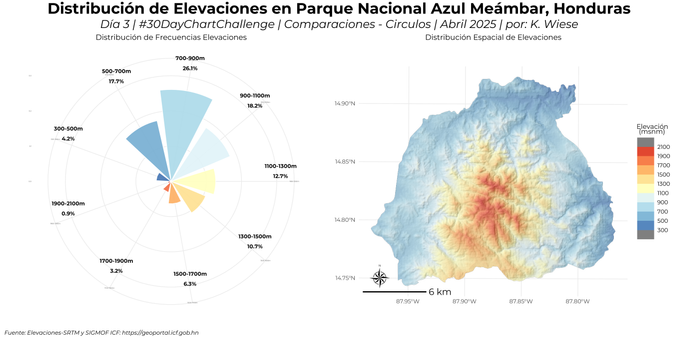
Día 3| Comparaciones – Círculos | #30DayChartChallenge. La visualización fue creada usando R basado en los paquetes #sf, #terra, #tidyterra, #extarctexactr, #ggplot2, #dplyr, #scales, #ggnewscale ,#ggtext, #patchwork y #showtext. Fuente SRTM y SIGMOF ICF - https://geoportal.icf.gob.hn
