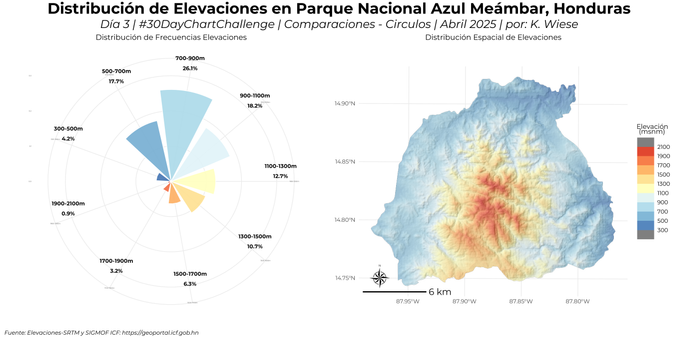
Día 3| Comparaciones – Círculos | #30DayChartChallenge. La visualización fue creada usando R basado en los paquetes #sf, #terra, #tidyterra, #extarctexactr, #ggplot2, #dplyr, #scales, #ggnewscale ,#ggtext, #patchwork y #showtext. Fuente SRTM y SIGMOF ICF - https://geoportal.icf.gob.hn
#ggnewscale
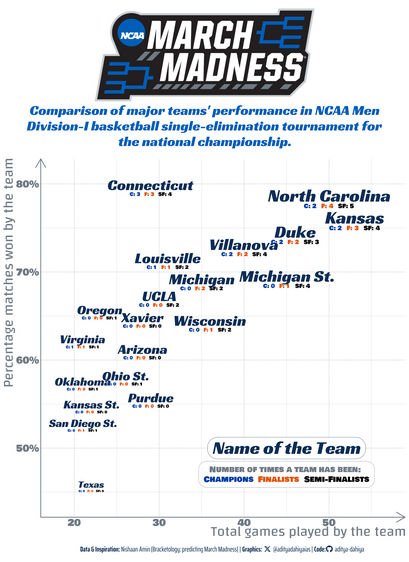
#TidyTuesday Kansas and North Carolina have dominated #MarchMadness historically with the most wins. But Connecticut is an outlier: the highest winning rate.
Data: @kaggle (by Nishaan Amin)
Code: https://tinyurl.com/tidy-nmm
Tools #rstats, #ggplot2, #ggnewscale by @eliocamp, and #ggtext by @clauswilke@genart.social
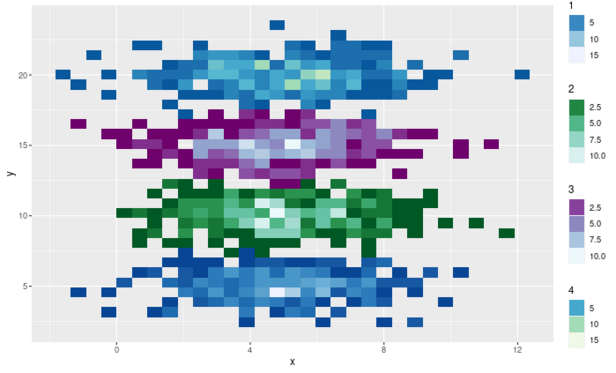
New version of #ggnewscale now fixes a long-standing bug that was introduced a few versions ago and was really hard to debug. Now you can actually add more than 2 scales if the scale is implicit in the geom/stat.
Finally, I've tried to ensure compatibility with other packages, like #gganimate and #ggnewscale. Here's the gganimate gapminder example using a multiply blend.
Client Info
Server: https://mastodon.social
Version: 2025.04
Repository: https://github.com/cyevgeniy/lmst


