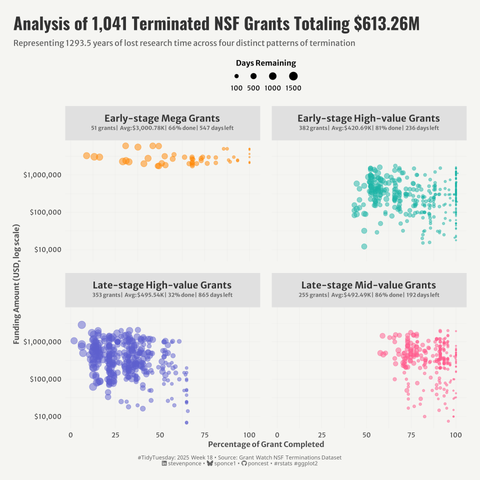
📊 #TidyTuesday – 2025 W18 | NSF Grant Terminations under the Trump Administration
.
🔗: https://stevenponce.netlify.app/data_visualizations/TidyTuesday/2025/tt_2025_18.html
.
#rstats | #r4ds | #dataviz | #ggplot2
#r4ds
Recent @DSLC club meetings:
:rstats: R for Data Science: Quarto & Quarto formats https://youtu.be/6BeeTW2BVvo #RStats #R4DS
From the @DSLC :rstats:chives:
:rstats: "RWTF: Project-oriented workflow" https://youtu.be/LxOsSswRBTs #RStats
:rstats: "Modelado Tidy con R - 19. ¿Cuando deberías confiar en las predicciones?" https://youtu.be/KtqSS9GixTs #RStats
Visit https://dslc.video for hours of new #DataScience videos every week!
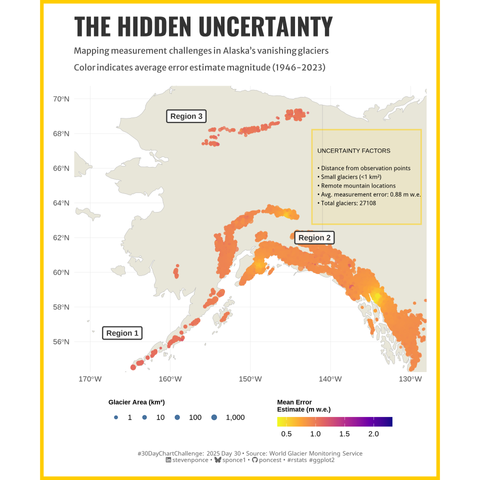
📊 2025 #30DayChartChallenge | day 30 | uncertainties | national geographics (theme)
.
🔗: https://stevenponce.netlify.app/data_visualizations/30DayChartChallenge/2025/30dcc_2025_30.html
.
#rstats | #r4ds | #dataviz | #ggplot2
It's #TidyTuesday y'all! Show us what you made on our Slack at https://dslc.io/join (find the #chat-tidytuesday channel)!
RT @jonthegeek https://fosstodon.org/@jonthegeek/114415898182808932
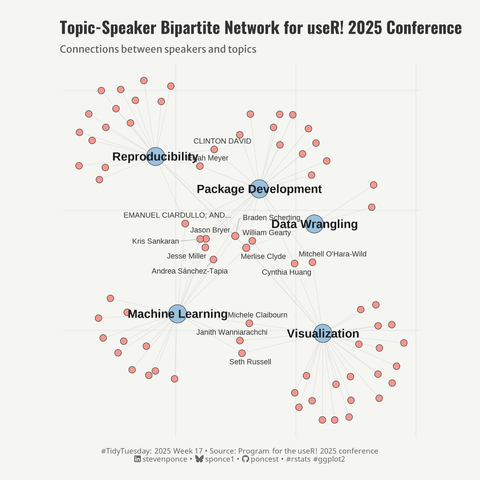
📊 #TidyTuesday – 2025 W17 | useR! 2025 program
.
🔗: https://stevenponce.netlify.app/data_visualizations/TidyTuesday/2025/tt_2025_17.html
.
#rstats | #r4ds | #dataviz | #ggplot2
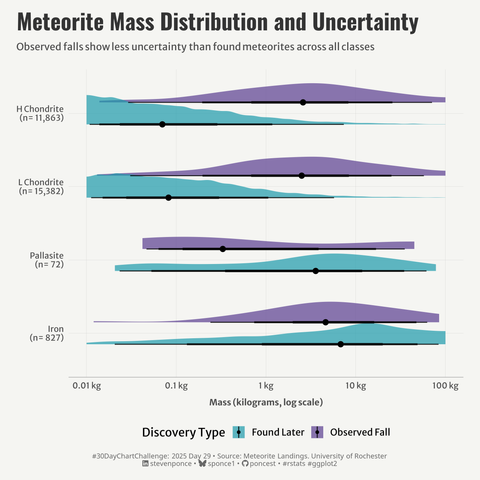
📊 2025 #30DayChartChallenge | day 29 | uncertainties | extraterrestrial
.
🔗: https://stevenponce.netlify.app/data_visualizations/30DayChartChallenge/2025/30dcc_2025_29.html
.
#rstats | #r4ds | #dataviz | #ggplot2
Curator: @minecr
https://DSLC.io welcomes you to week 17 of #TidyTuesday! We're exploring useR! 2025 program!
📂 https://tidytues.day/2025/2025-04-29
🗞️ https://user2025.r-project.org/
Submit a dataset! https://github.com/rfordatascience/tidytuesday/blob/main/.github/CONTRIBUTING.md
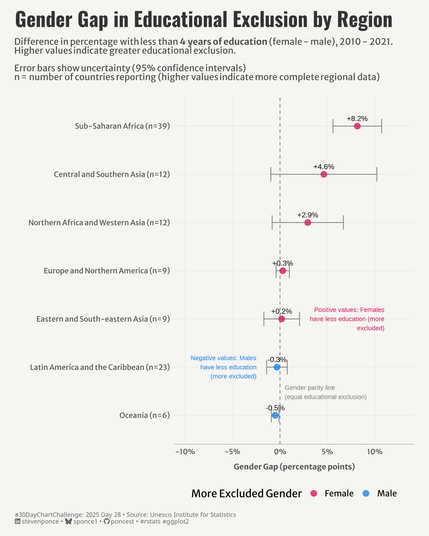
📊 2025 #30DayChartChallenge | day 28 | uncertainties | inclusion
.
🔗: https://stevenponce.netlify.app/data_visualizations/30DayChartChallenge/2025/30dcc_2025_28.html
.
#rstats | #r4ds | #dataviz | #ggplot2
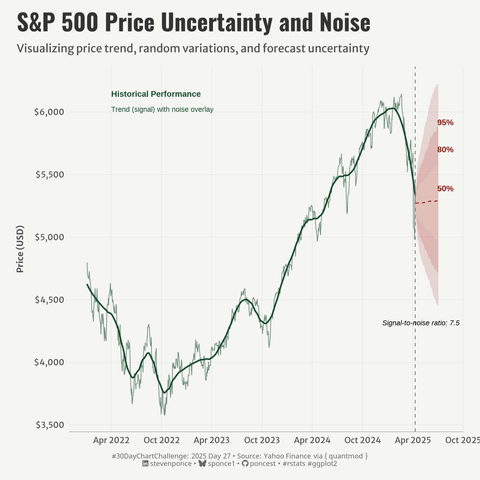
📊 2025 #30DayChartChallenge | day 27 | uncertainties | noise
.
🔗: https://stevenponce.netlify.app/data_visualizations/30DayChartChallenge/2025/30dcc_2025_27.html
.
#rstats | #r4ds | #dataviz | #ggplot2
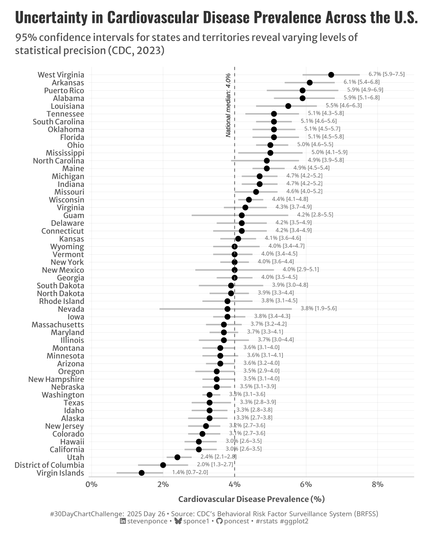
📊 2025 #30DayChartChallenge | day 26 | uncertainties | monochrome
.
🔗: https://stevenponce.netlify.app/data_visualizations/30DayChartChallenge/2025/30dcc_2025_26.html
.
#rstats | #r4ds | #dataviz | #ggplot2
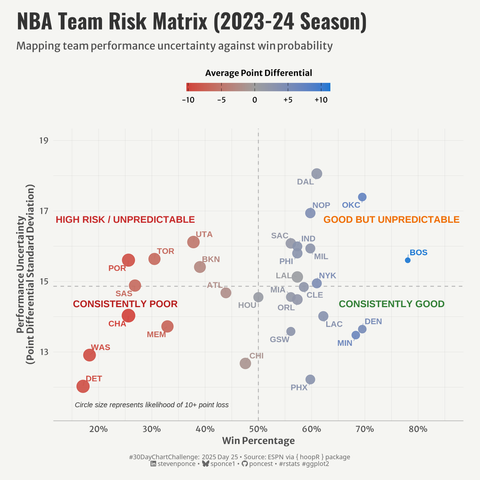
📊 2025 #30DayChartChallenge | day 25 | uncertainties | risk
.
🔗: https://stevenponce.netlify.app/data_visualizations/30DayChartChallenge/2025/30dcc_2025_25.html
.
#rstats | #r4ds | #dataviz | #ggplot2
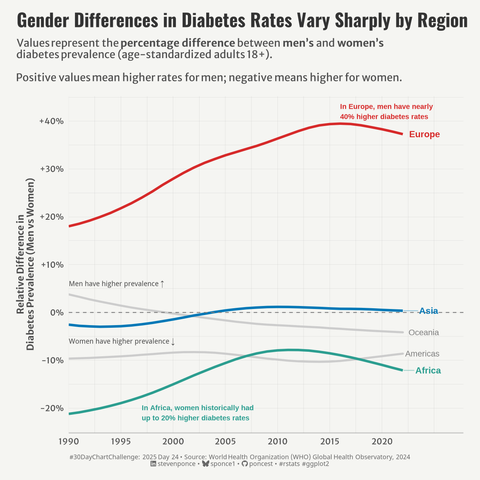
📊 2025 #30DayChartChallenge | day 24 | timeseries | Word Health Organization (data)
.
🔗: https://stevenponce.netlify.app/data_visualizations/30DayChartChallenge/2025/30dcc_2025_24.html
.
#rstats | #r4ds | #dataviz | #ggplot2
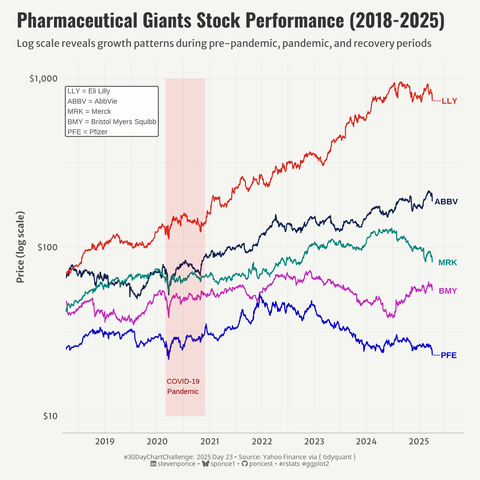
📊 2025 #30DayChartChallenge | day 23 | timeseries | log scale
.
🔗: https://stevenponce.netlify.app/data_visualizations/30DayChartChallenge/2025/30dcc_2025_23.html
.
#rstats | #r4ds | #dataviz | #ggplot2
It's #TidyTuesday y'all! Show us what you made on our Slack at https://dslc.io/join (find the #chat-tidytuesday channel)!
RT @jonthegeek https://fosstodon.org/@jonthegeek/114376279976367936
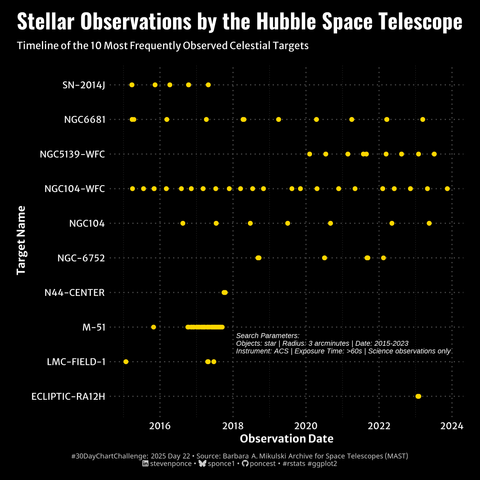
📊 2025 #30DayChartChallenge | day 22 | timeseries | stars
.
🔗: https://stevenponce.netlify.app/data_visualizations/30DayChartChallenge/2025/30dcc_2025_22.html
.
#rstats | #r4ds | #dataviz | #ggplot2
Curator: @jonthegeek
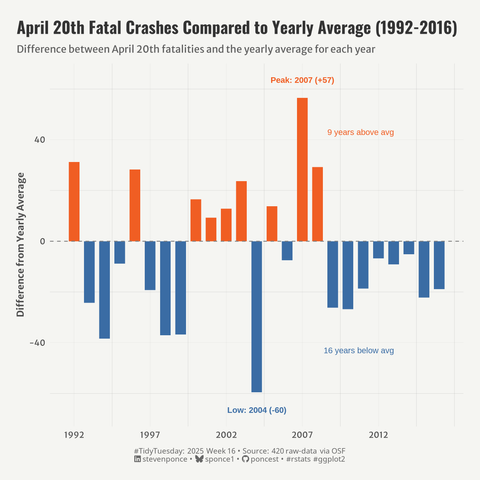
https://DSLC.io welcomes you to week 16 of #TidyTuesday! We're exploring Fatal Car Crashes on 4/20!
📁 https://tidytues.day/2025/2025-04-22
📰 https://osf.io/preprints/osf/tzcsy_v1
Submit a dataset! https://github.com/rfordatascience/tidytuesday/blob/main/.github/CONTRIBUTING.md
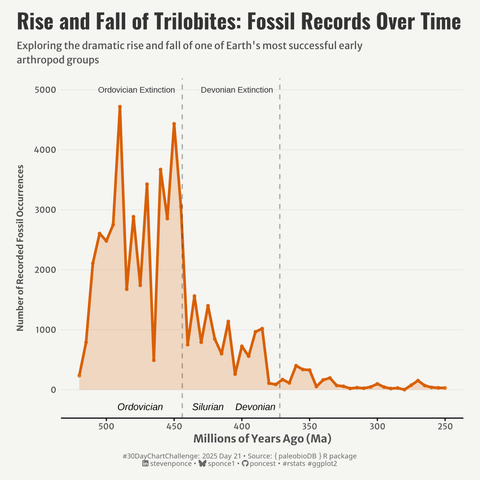
📊 2025 #30DayChartChallenge | day 21 | timeseries | fossils
.
🔗: https://stevenponce.netlify.app/data_visualizations/30DayChartChallenge/2025/30dcc_2025_21.html
.
#rstats | #r4ds | #dataviz | #ggplot2
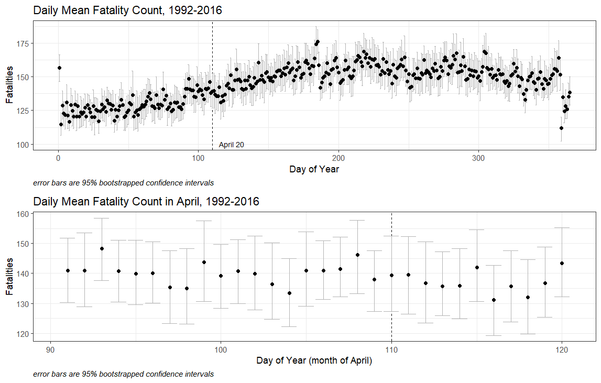
📊 #TidyTuesday – 2025 W16 | Fatal Car Crashes on 4/20
.
🔗: https://stevenponce.netlify.app/data_visualizations/TidyTuesday/2025/tt_2025_16.html
.
#rstats | #r4ds | #dataviz | #ggplot2
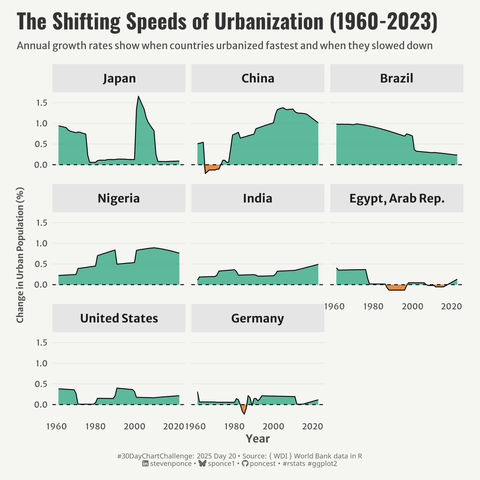
📊 2025 #30DayChartChallenge | day 20 | timeseries | urbanization
.
🔗: https://stevenponce.netlify.app/data_visualizations/30DayChartChallenge/2025/30dcc_2025_20.html
.
#rstats | #r4ds | #dataviz | #ggplot2
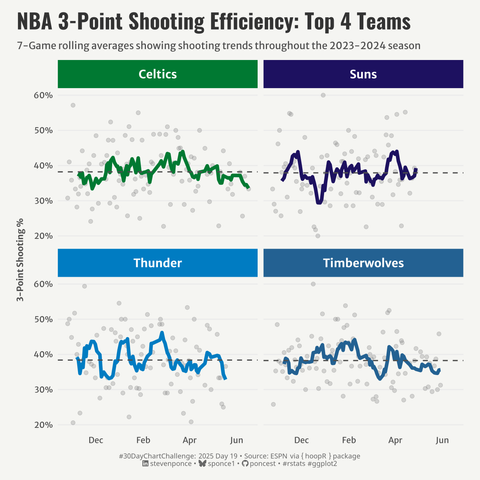
📊 2025 #30DayChartChallenge | day 19 | timeseries | smooth
.
🔗: https://stevenponce.netlify.app/data_visualizations/30DayChartChallenge/2025/30dcc_2025_19.html
.
#rstats | #r4ds | #dataviz | #ggplot2
