🔹 Study Key Intraday Indicators
Moving Averages (EMA 9, 20, 50)
RSI (momentum)
MACD (trend + momentum)
VWAP (volume-weighted average price – popular for day trading)
i am forex indicator provider
🔹 Study Key Intraday Indicators
Moving Averages (EMA 9, 20, 50)
RSI (momentum)
MACD (trend + momentum)
VWAP (volume-weighted average price – popular for day trading)
🔹 1. Learn the Basics
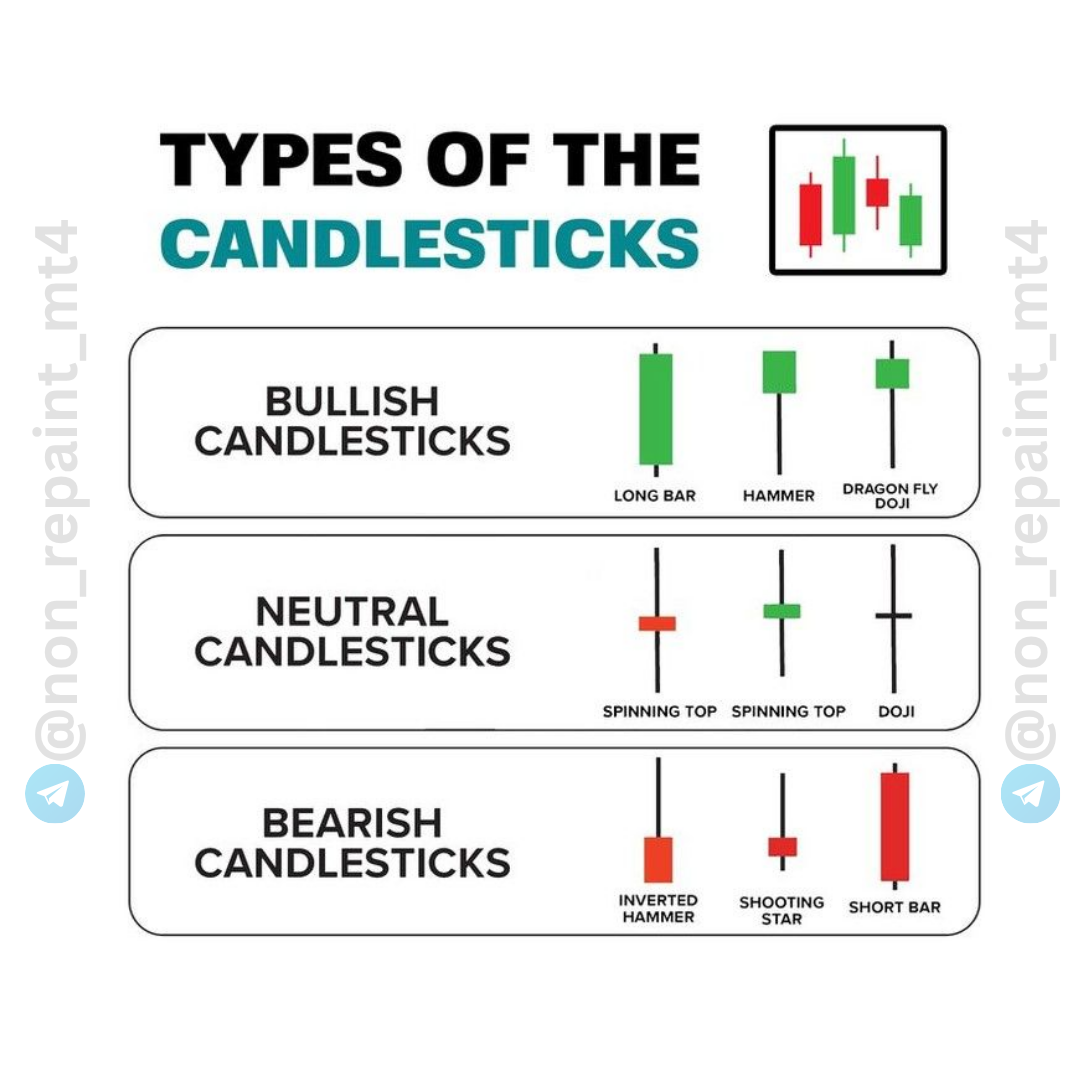
Candlestick patterns (Doji, engulfing, etc.)
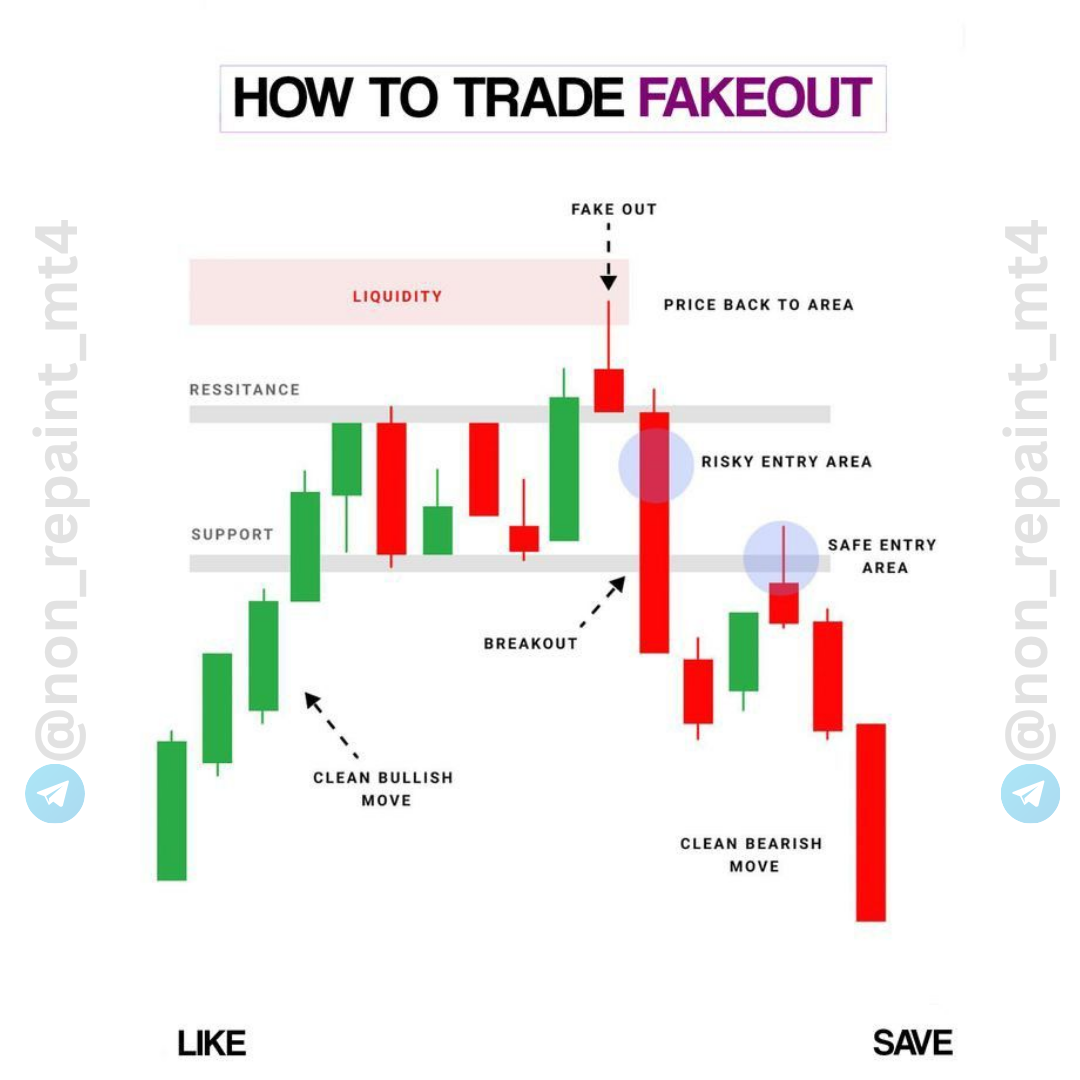
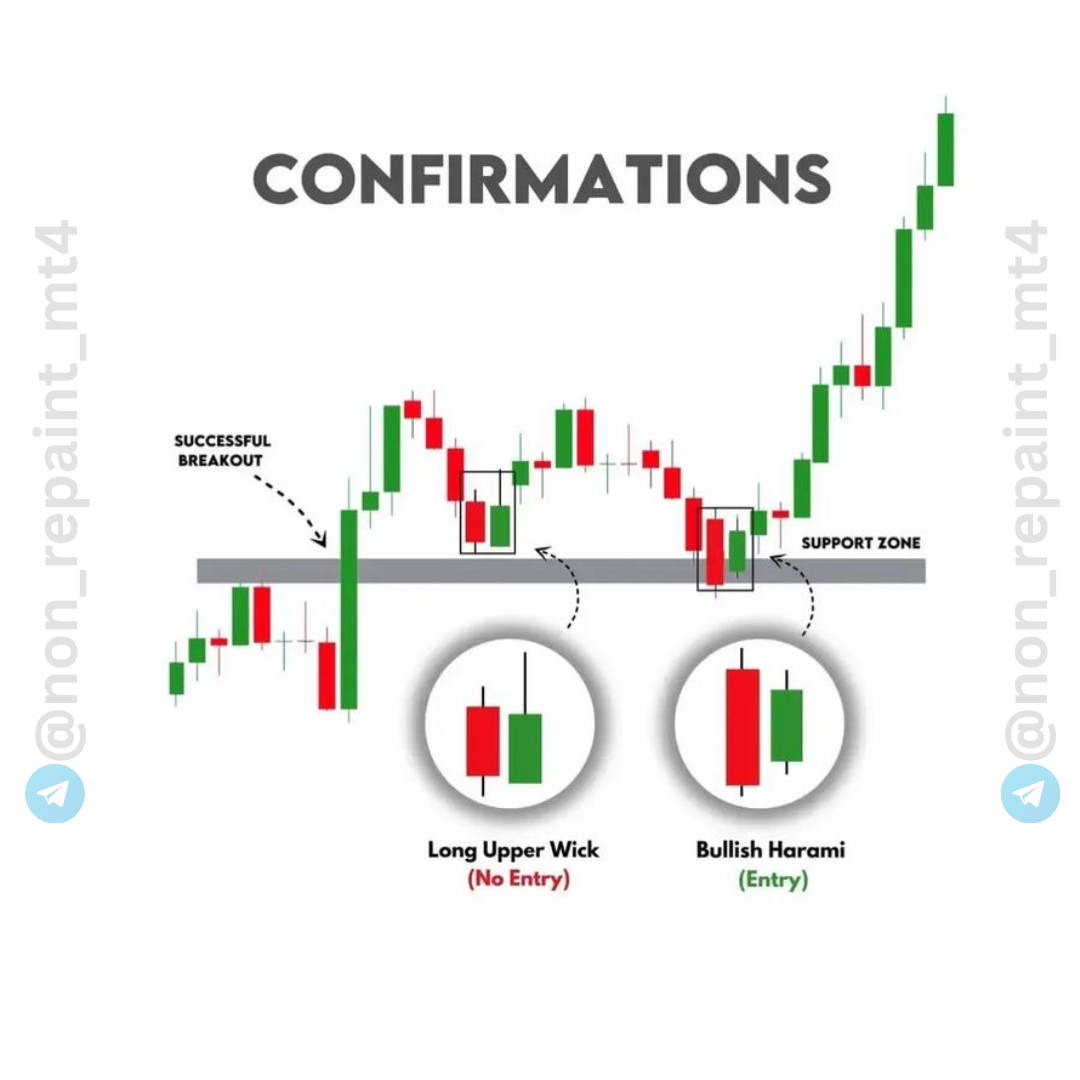
Support & resistance
Trendlines & chart patterns (flags, triangles)
✅ 1. Understand the Basics of Technical Analysis
Start with the foundational concepts:
Price action: How price moves on a chart
Support & resistance: Key price levels where price tends to react
Candlestick patterns: Doji, engulfing, hammer, etc.
Trendlines and channels
These types of candlesticks patterns are usually categorized into three categories: bullish, bearish, and continuation patterns.
#forex #trading #forextrader #bitcoin #forextrading #money #forexsignals #trader #cryptocurrency #crypto #forexlifestyle #investing
Backtesting is essential for developing and optimizing trading strategies. A non-repainting indicator ensures that past signals reflect actual historical data without any post-event adjustment. This allows for realistic performance evaluation, helping traders gauge the true win rate, drawdown, and profitability of a strategy.
Repainting indicators can distort backtesting by showing ideal entry points that did not exist at the time of trading, leading to false confidence and eventual losses.