Link to the papers: https://journals.plos.org/plosgenetics/article?id=10.1371/journal.pgen.1008432, https://www.nature.com/articles/s10038-020-00851-4, https://www.biorxiv.org/content/10.1101/2023.07.06.548007v1.abstract
SFGravel
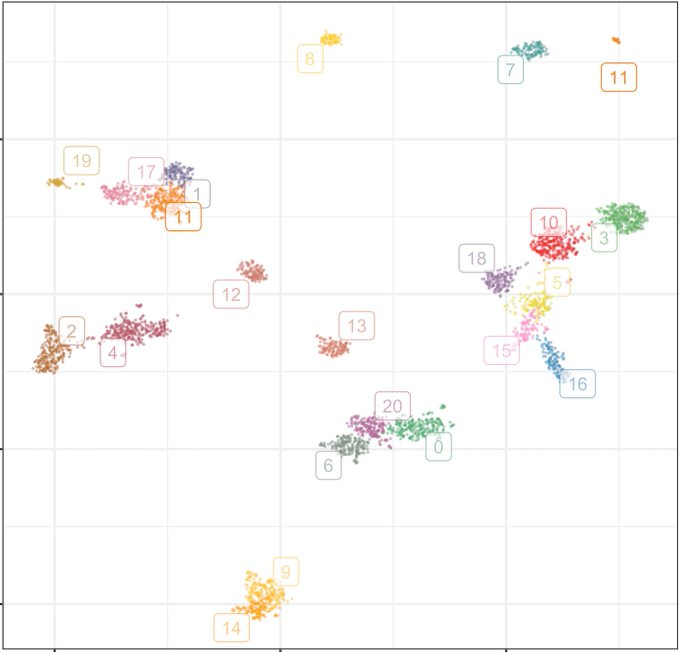
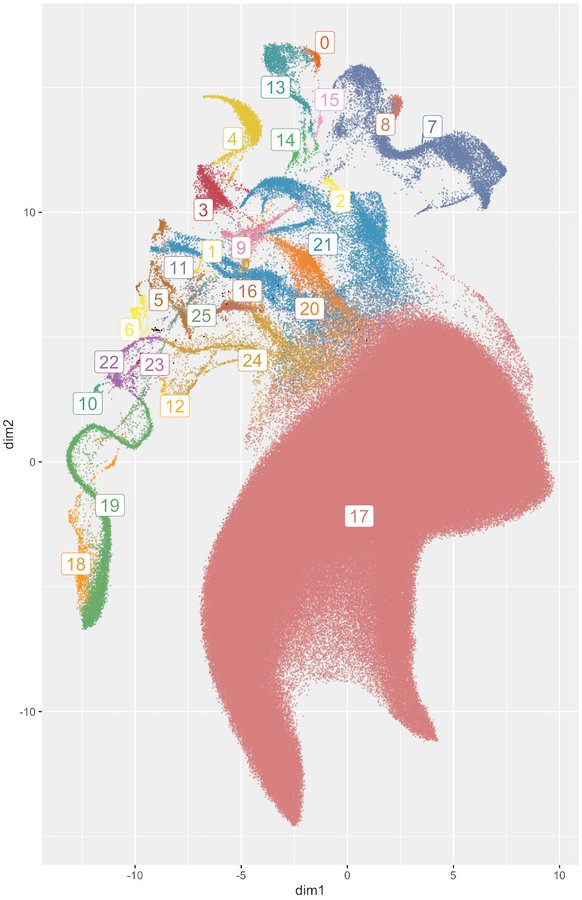
UMAP gives roughly equal visual space for each participant. This makes UMAP distances meaningless, but also makes UMAP useful to visualize the composition of a cohort. A large UMAP feature includes many individuals. We probably want to understand it. 6/n
But yes, UMAP can be misinterpreted and misused. We have years of papers documenting misuses of PCA and admixture plots, and people still mess them up. I expect the same will occur with UMAP. More discussion on this topic at @SMBE 2024, and do check out @adp_diaz’s papers. 8/n
A UMAP feature does not mean something is real or relevant. But showing a UMAP plot and discussing what we see is a good way to identify relevant structure in the data. Labeled properly, it emphasizes continental groupings less than most PCA or admixture plots. 7/n
UMAP is appealing because it can reveal patterns in the data that would not have been obvious otherwise. By contrast with PCA or admixture, it can reveal multiple levels of discrete and continuous population structure in one plot. See @adp_diaz’s papers & thesis on the topic. 5/n
The most useful method depends on what we want to do. UMAP has become popular to summarize cohorts. Critics have lamented this, arguing that the plots are pretty but misleading. They can be both, but presumably that is not the main reason they are popular. 4/n
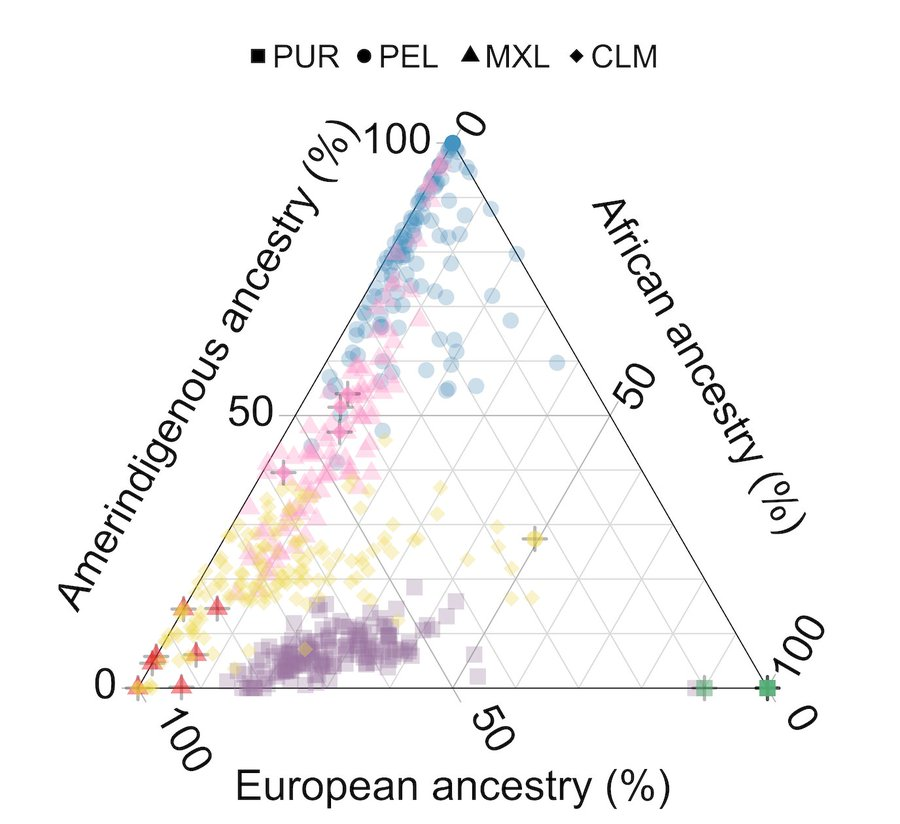
PCA flattens data and puts different populations on top of each other. Admixture plots assume that there are “true” type populations that mix in different proportions to create individuals. UMAP (massively) distorts distances to show each data point and preserve neighborhoods. 3/n
UMAP is used to get a visual representation of complex (high-dimensional) data. To do this, it distorts the data. A lot. This is unavoidable: genetic data is high dimensional, and any plot that fits on a piece of paper has the potential to hide and mislead.
A figure in the All of Us paper was criticized on many fronts, including the use of a dimension reduction technique (UMAP). Some people concluded that UMAP is not appropriate for representing genetic ancestry. I disagree.
@alxsim @coevolution
You can find it here: https://github.com/diazale/phd_thesis.
My understanding is that the S t-SNE refers to the fact that we are considering distances between neighbouring points as drawn from a distribution, and we are trying to align low- and high-dimensional distributions. In principle one could use this to estimate uncertainty in representation, but the truth is that the "best" representation is so hard to find, due to many local minima, that other sources of uncertainty dominate.
Before you ask: Alex is now headed to Brown to postdoc with
@s_ramach
SFGravel boosted:
On Friday,
@diazale successfully defended a wonderful thesis on modelling high-dimensional genetic data. A must-read if you are working with UMAP or genetic clustering, or if you just like well-written and thoughtful scientific writing. Congratulations!
On Friday,
@diazale successfully defended a wonderful thesis on modelling high-dimensional genetic data. A must-read if you are working with UMAP or genetic clustering, or if you just like well-written and thoughtful scientific writing. Congratulations!
TT position in UQ Chicoutimi in genomic medicine. It welcomes human popgen with large genealogies. UQAC hosts the world's best genealogical resource for human popgen (IMO).
http://www.uqac.ca/emploi/emplois/dad-715-professeure-reguliere-ou-professeur-regulier-en-genomique-appliquee-a-la-sante-genetique-et-environnement/
We have an open rank search at @mcgillu in genomic medicine: https://www.nature.com/naturecareers/job/12805776/victor-philip-dahdaleh-chair-in-genomic-medicine-at-mcgill-university/.
A rare opportunity with enough resources to build computational + experimental programs!
Evolutionary approaches welcome!
That was a while back! It ended up being a different issue, but we keep it in our toolkit!
SFGravel boosted:
A new preprint by me and Graham Coop (@gcbias)
"The contribution of gene flow, selection, and genetic drift to five thousand years of human allele frequency change"
https://www.biorxiv.org/content/10.1101/2023.07.11.548607v1
Happy to get feedback on this manuscript.
1/6
SFGravel boosted:
Out now! We study genetic structure in large biobanks using topological data analysis via UMAP and HDBSCAN.
This approach is fast, easy-to-use, fits into existing pipelines, uses data you already have, and is downright fascinating.
Our pre-print is on bioRxiv and we have our code with a demo up on github: https://github.com/diazale/topstrat
Mini-workshop next week, please share!
------------
Adaptation in structured populations
Thursday, June 29
------------
Featuring Aaron Ragsdale, Amy Goldberg, Jennifer Blanc, Lluis Quintana-Murci, and Nandita Garud.
Free registration: https://mcgill.zoom.us/meeting/register/tZcqcuivrjguG9EP_IMKA9bD4Mwq5DB7eb9J
Program overview:
Using millions of genealogical records and thousands of genotypes, our paper led by Luke Anderson-Trocmé presents a detailed model for the appearance of population structure over space in time: https://www.science.org/doi/10.1126/science.add5300.
We consider the effects of migrations, rivers, mountains, and asteroids (yes, asteroids) in shaping genetic diversity among French-Canadians in Quebec. The work includes a freely downloadable dataset of 1,4 million genomes simulated according to a population-scale genealogy.
Client Info
Server: https://mastodon.social
Version: 2025.04
Repository: https://github.com/cyevgeniy/lmst