
@datavisfriendly Here's Xaquín G.V. @xocasgv's version (2017) https://twitter.com/xocasgv/status/901863006799323137/
Data Visualisation @ UTwente
28 june 16:00, SmartXP, University of Twente
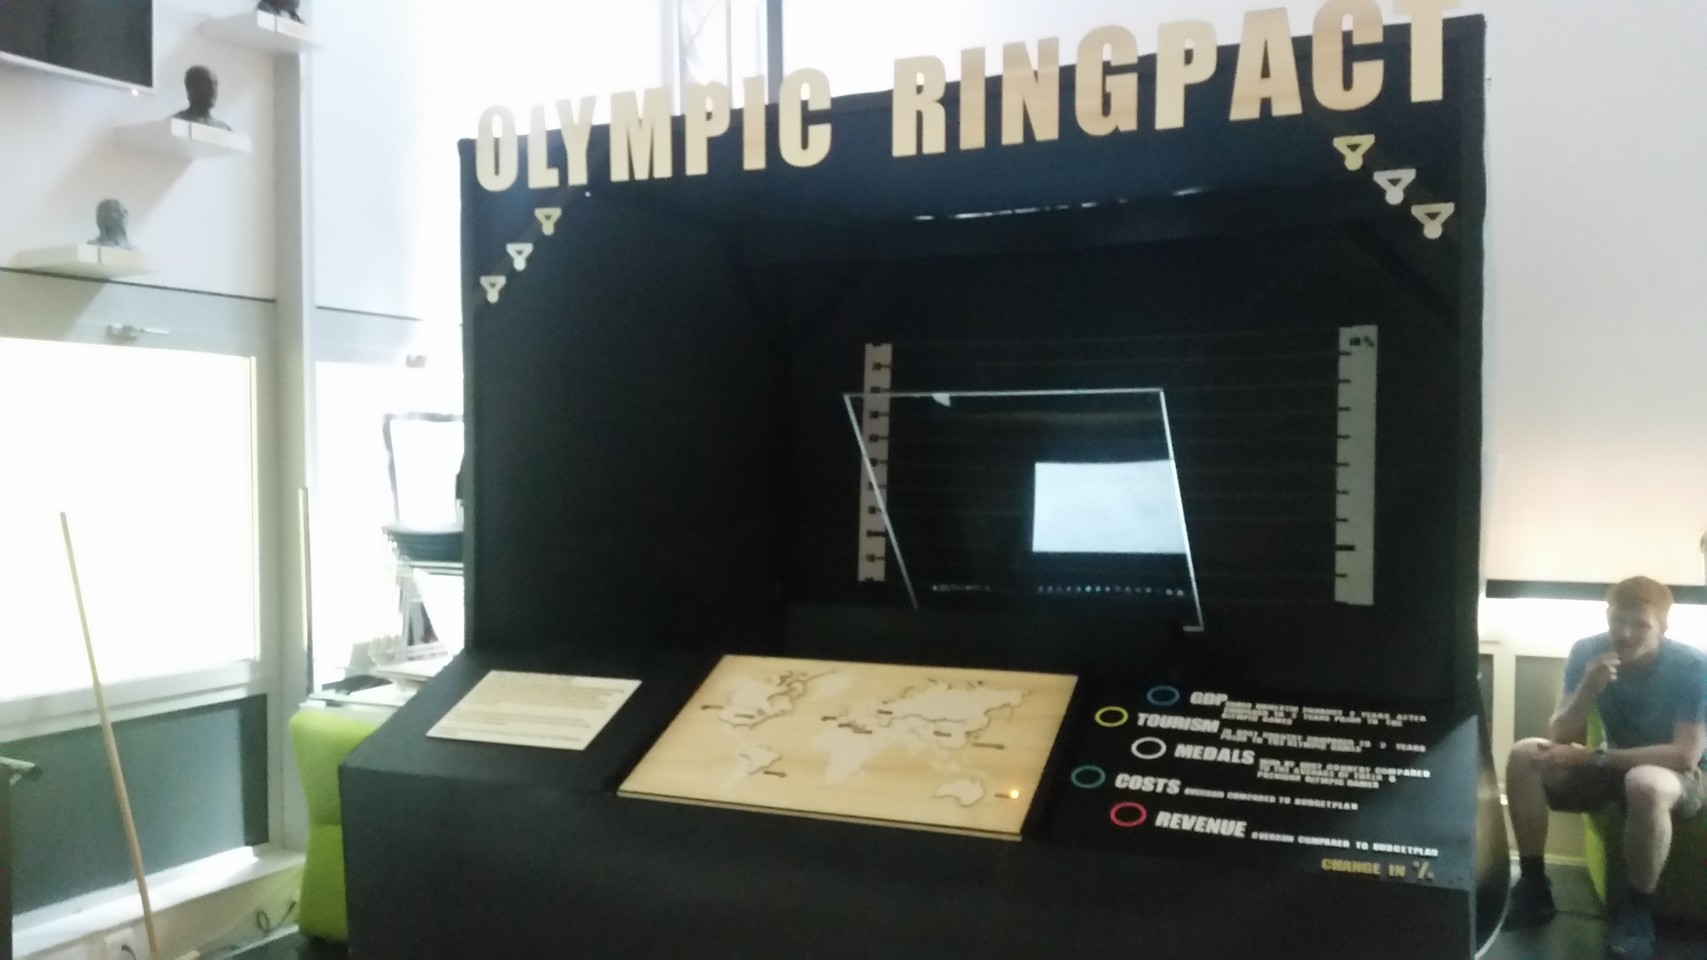
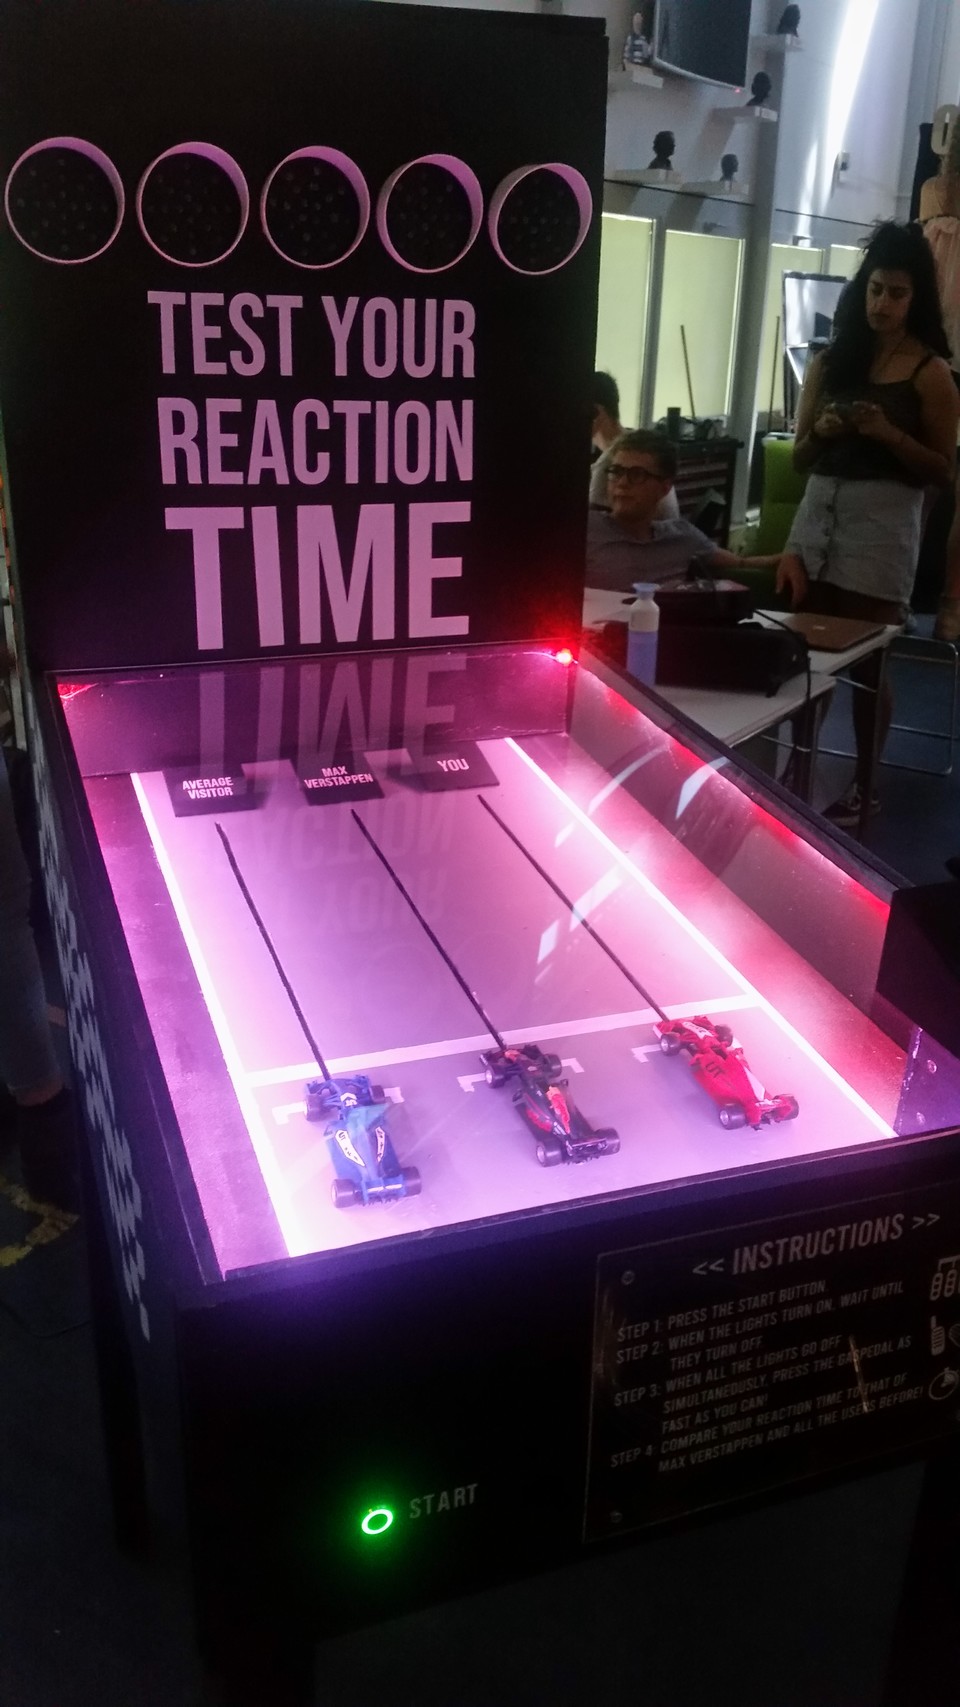
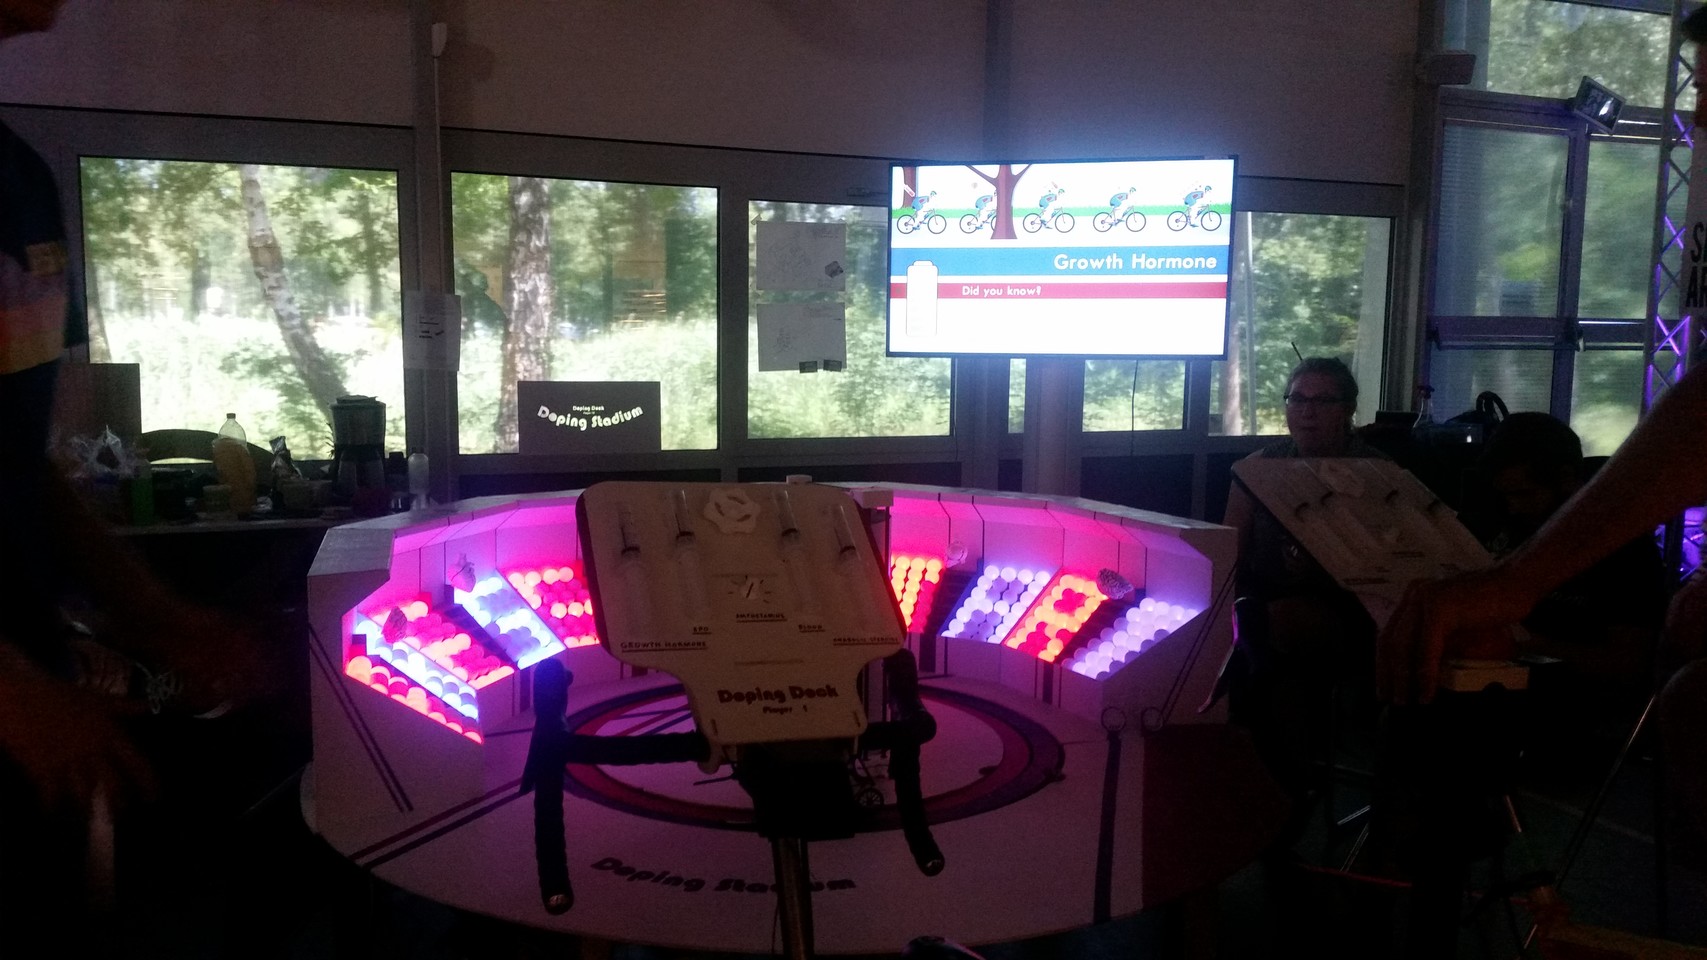
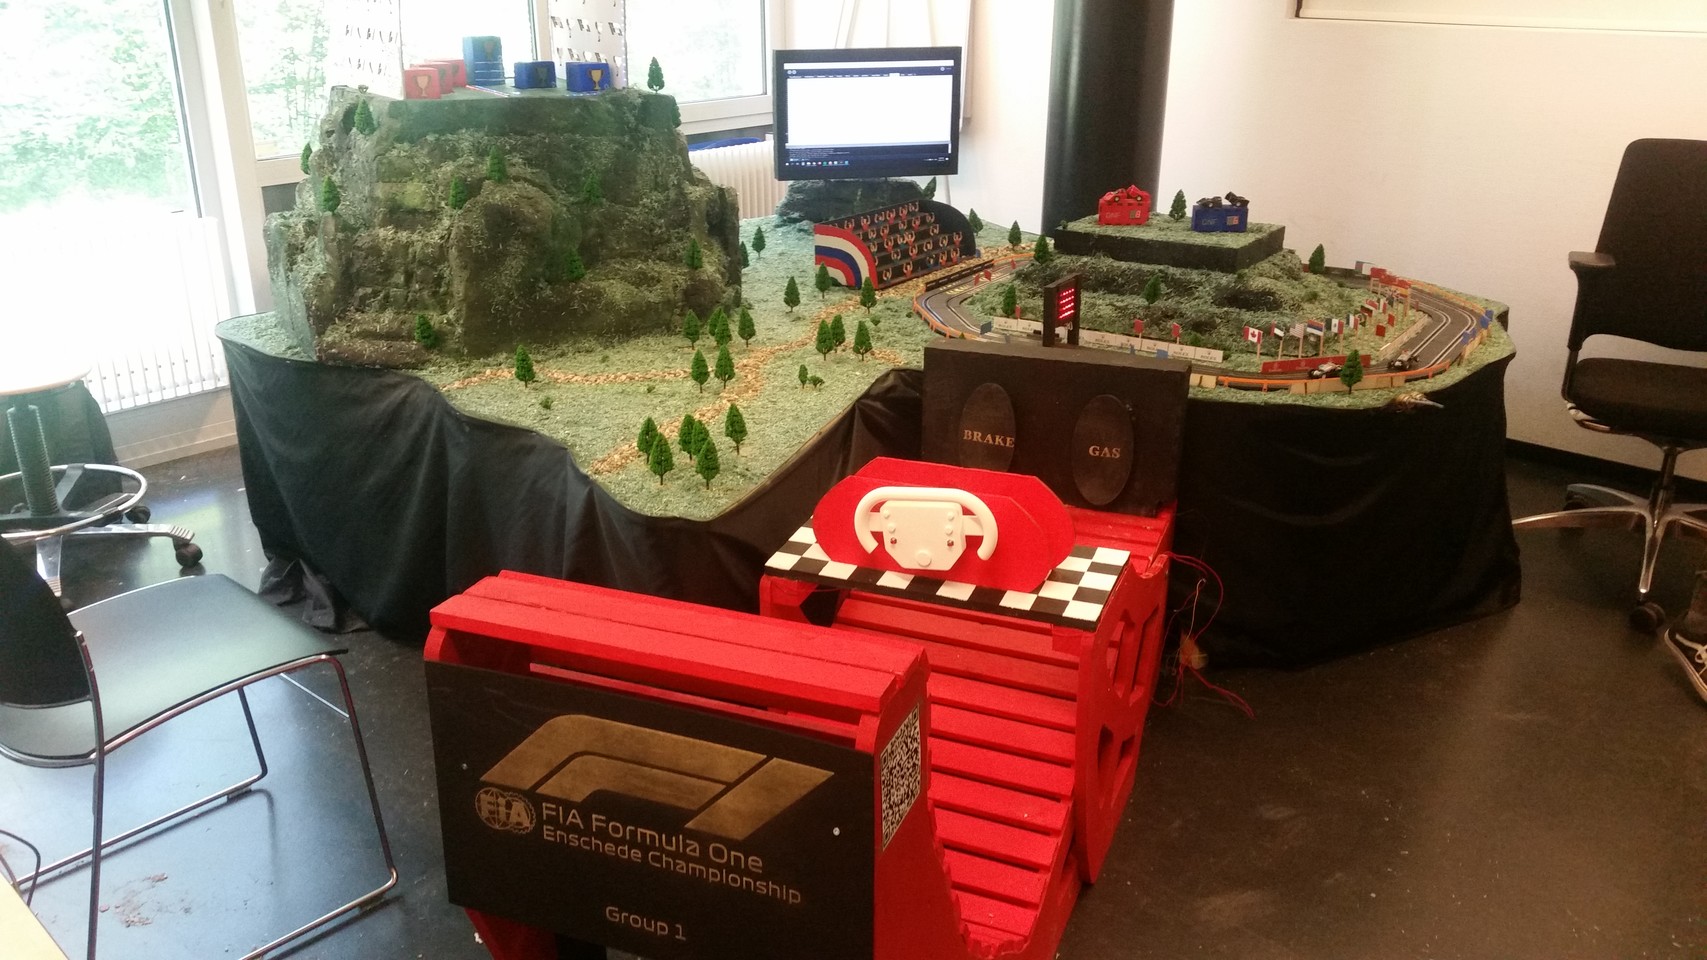
The exposition of Hybrid Worlds 2019 will be today in the SmartXP building, on the campus of the University of Twente. Free entrance, and below a small glimpse of projects that you can see there. Feel free to drop by!
Data Visualisation @ UTwente boosted:
Awesome projects by the second year students of the bachelor Creative Technology at the University of Twente!
Featuring four members of 'Orkest van het Oosten'!
Toot 2/2
:utwente:, @proto
Data Visualisation @ UTwente boosted:
Awesome projects by the second year students of the bachelor Creative Technology at the University of Twente!
Toot 1/2
:utwente:, @proto
Data Visualisation @ UTwente boosted:

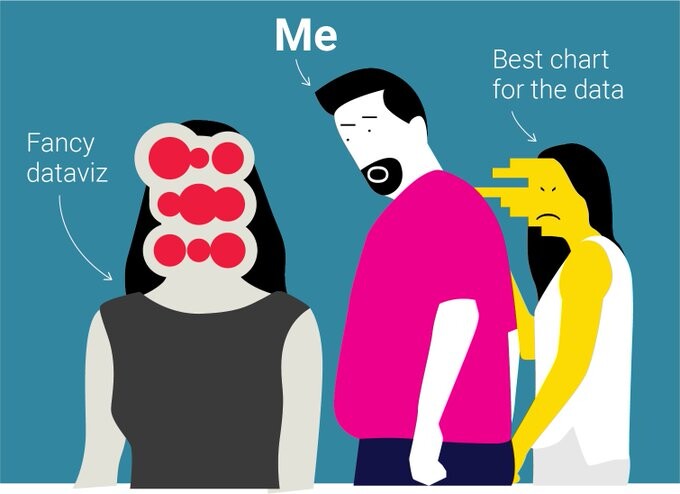
A session by @maartenzam@twitter on https://xeno.graphics. Challenges me to think about my automated choices when visualizing data (through conventions) and the alternatives (when using stranger charts) which may be more suited for the task!
Data Visualisation @ UTwente boosted:
Impressive: a display of changes in available resources&environmental impact as a "spot the difference" puzzle. Very creative, a way to reach a different target group, definitely out of the box (for hackathons)!
Data Visualisation @ UTwente boosted:

‘It was a dream of mine to organise a data camp’ :utoday: https://www.utoday.nl/news/65558/it-was-a-dream-of-mine-to-organise-a-data-camp
More pictures!
Featuring a.o:
Filip de Blois, Yuri Engelhardt (@yuri), David Klein, Edwin Hans and Rania Kounadi!
Data Visualisation @ UTwente boosted:
Some higher quality pictures, to give an impression of the :datavizcamp: SDG DataVizCamp :datavizcamp: at the :utwente: University of Twente :utwente: this week!
Featuring, amongst others: Frederik Ruys, Maarten Lambrechts (@maarten) , Tariq Khokhar, Filip de Blois, Steffan Gómez and Yuri Engelhardt (@yuri) !
#datavisualisation
#datavizcamp2018h
#utwente
#designlab
#sdgs
Skype session with Tariq Khokar, Senior Data Scientist at The World Bank!
Day three of the SDG DataVizCamp. Maarten Lambrechts on XenoGraphics! (xeno.graphics)!
Data Visualisation @ UTwente boosted:
Really cool! Merlijn Buits of Infotopics visualizes the location and call data that Will Ockenden's telecom provider collected from his phone. :datavizcamp: #datavizcamp2018
Visualising politics!
Day 2 has started, with @yuri introducing our speaker, Frederik Ruys!
Data Visualisation @ UTwente boosted:
The #SDG DataVizCamp has started! More pictures will be shared by @datavis_utwente !
Client Info
Server: https://mastodon.social
Version: 2025.07
Repository: https://github.com/cyevgeniy/lmst