People tell me nobody wants to look at climate curves anymore, yet here we are!!! Please enjoy our interactive journey through 485 million years of climate history and dive into the fascinating and important work of paleoclimate scientists.
juliustroeger
Head of Data and Visualization ZEIT ONLINE (zeit.de)
juliustroeger boosted:
Ich liebe guten Datenjournalismus. Hier zur Mietenentwicklung auf Stadtteilebene und in Verbindung mit den dortigen Einkommen.
Und weil ich das so wichtig finde, für alle als Geschenklink:
@xeophin So good!
juliustroeger boosted:
Wieder ein sehr ansprechendes Beispiel der Visualisierung von DWD-Daten - dieses Mal von Zeit Online zu Temperatur und Niederschlag im Jahr 2024 in Deutschland. Macht Freude das durchzuklicken und vermittelt gemeindegenau #Wetter- und #Klimadaten
https://www.zeit.de/wissen/2025-01/deutscher-wetterdienst-temperatur-niederschlag-2024
juliustroeger boosted:
Russland führt längst Krieg gegen Europa – nicht nur gegen die Ukraine. Verunsichern, verängstigen, spalten, zersetzen sind die Ziele dieses hybriden Krieges. Die russischen Geheimdienste scheinen dabei auch vor zivilen Opfern nicht mehr zurückzuschrecken. Eine Liste:
https://www.zeit.de/politik/ausland/2024-12/russische-sabotage-europa-spionage-pipelines-hackerangriffe
We are happy to welcome a new member to the Data and Visualization team at @zeitonline
@atschatscha joins our team as Data Visualization Developer. Previously she worked as a web developer at the Berliner Tagesspiegel and the Interactive Media Lab Dresden.
Welcome!

Wir suchen eine/n Datenjournalist/in für unser Ressort Daten und Visualisierung bei @zeitonline und freuen uns ab sofort über Bewerbungen! Meldet euch auch gern direkt bei mir. https://zeit-verlagsgruppe.softgarden.io/job/42320390
We are looking for a data journalist for our data and visualization department at @zeitonline and are looking forward to receiving applications! You are also welcome to contact me directly.
juliustroeger boosted:
We're super happy to announce that our data and visualization team at @zeitonline continues to grow.
Gregor Aisch (@gka) will join us as Senior Visual Data Journalist. Previously, he was co-founder and CTO of Datawrapper and Graphics Editor at the New York Times.
Welcome to the team!

juliustroeger boosted:
Happy to share that starting in May, I'll be joining @juliustroeger and his amazing team at @zeitonline as Senior Visual Data Journalist. Very excited to getting my hands back on journalism.
Of course, my ❤️ still belongs to @datawrapper and I will continue to be part of it (I'm staying on 1d/week) in a more background/advisory role.
We're super happy to announce that our data and visualization team at @zeitonline continues to grow.
Gregor Aisch (@gka) will join us as Senior Visual Data Journalist. Previously, he was co-founder and CTO of Datawrapper and Graphics Editor at the New York Times.
Welcome to the team!
juliustroeger boosted:
How many rotations does it take to charge an electric car with green electricity or to power a household? Test it yourself with our interactive wind turbine at @zeitonline
https://www.zeit.de/wirtschaft/2024-01/windenergie-strom-windrad-elektroauto-haushalt
How many rotations does it take to charge an electric car with green electricity or to power a household? Test it yourself with our interactive wind turbine at @zeitonline
https://www.zeit.de/wirtschaft/2024-01/windenergie-strom-windrad-elektroauto-haushalt
juliustroeger boosted:
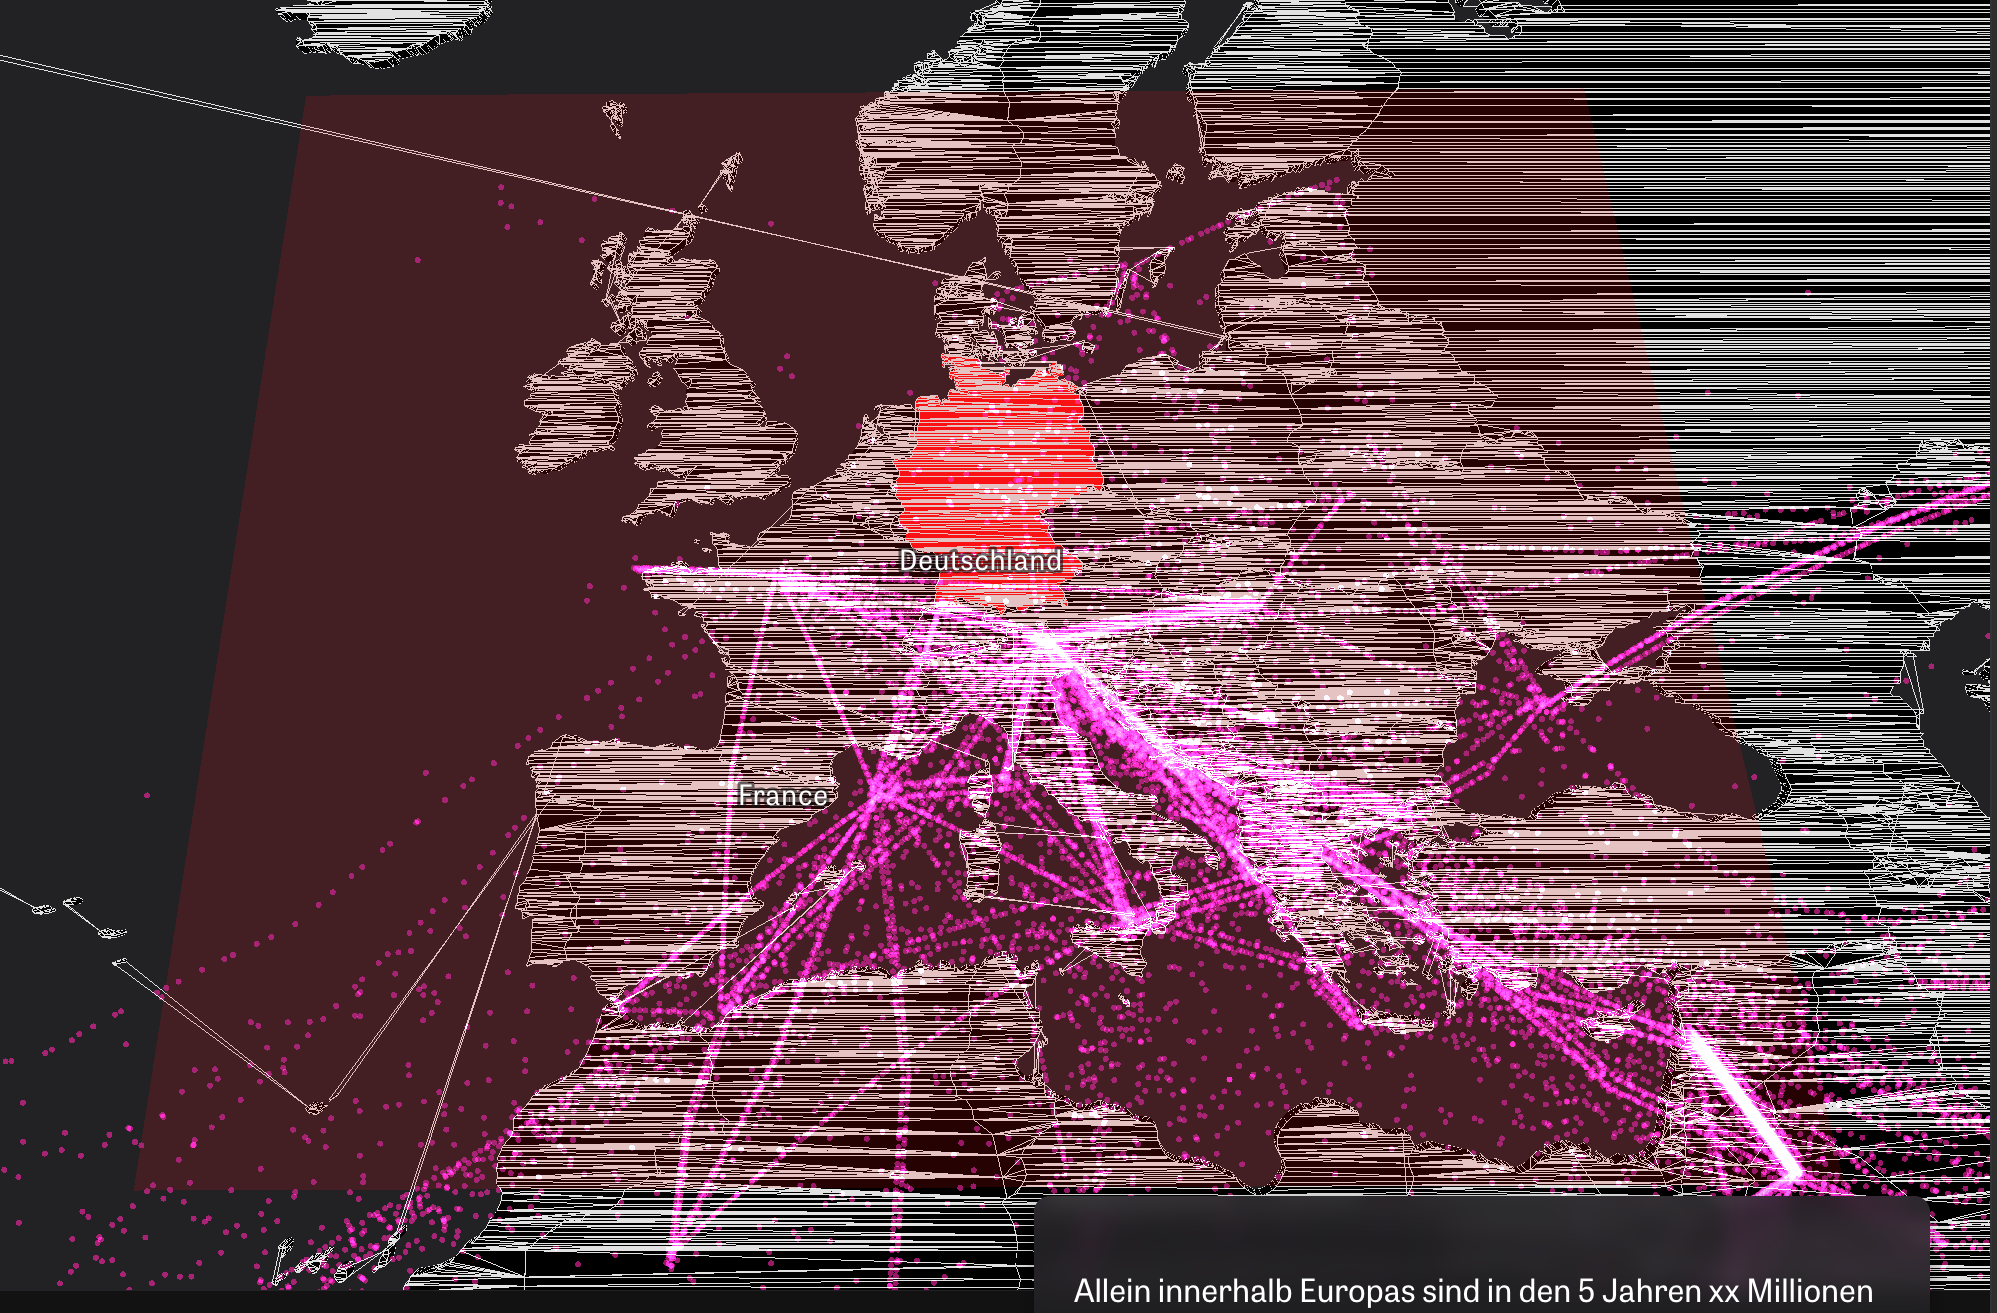
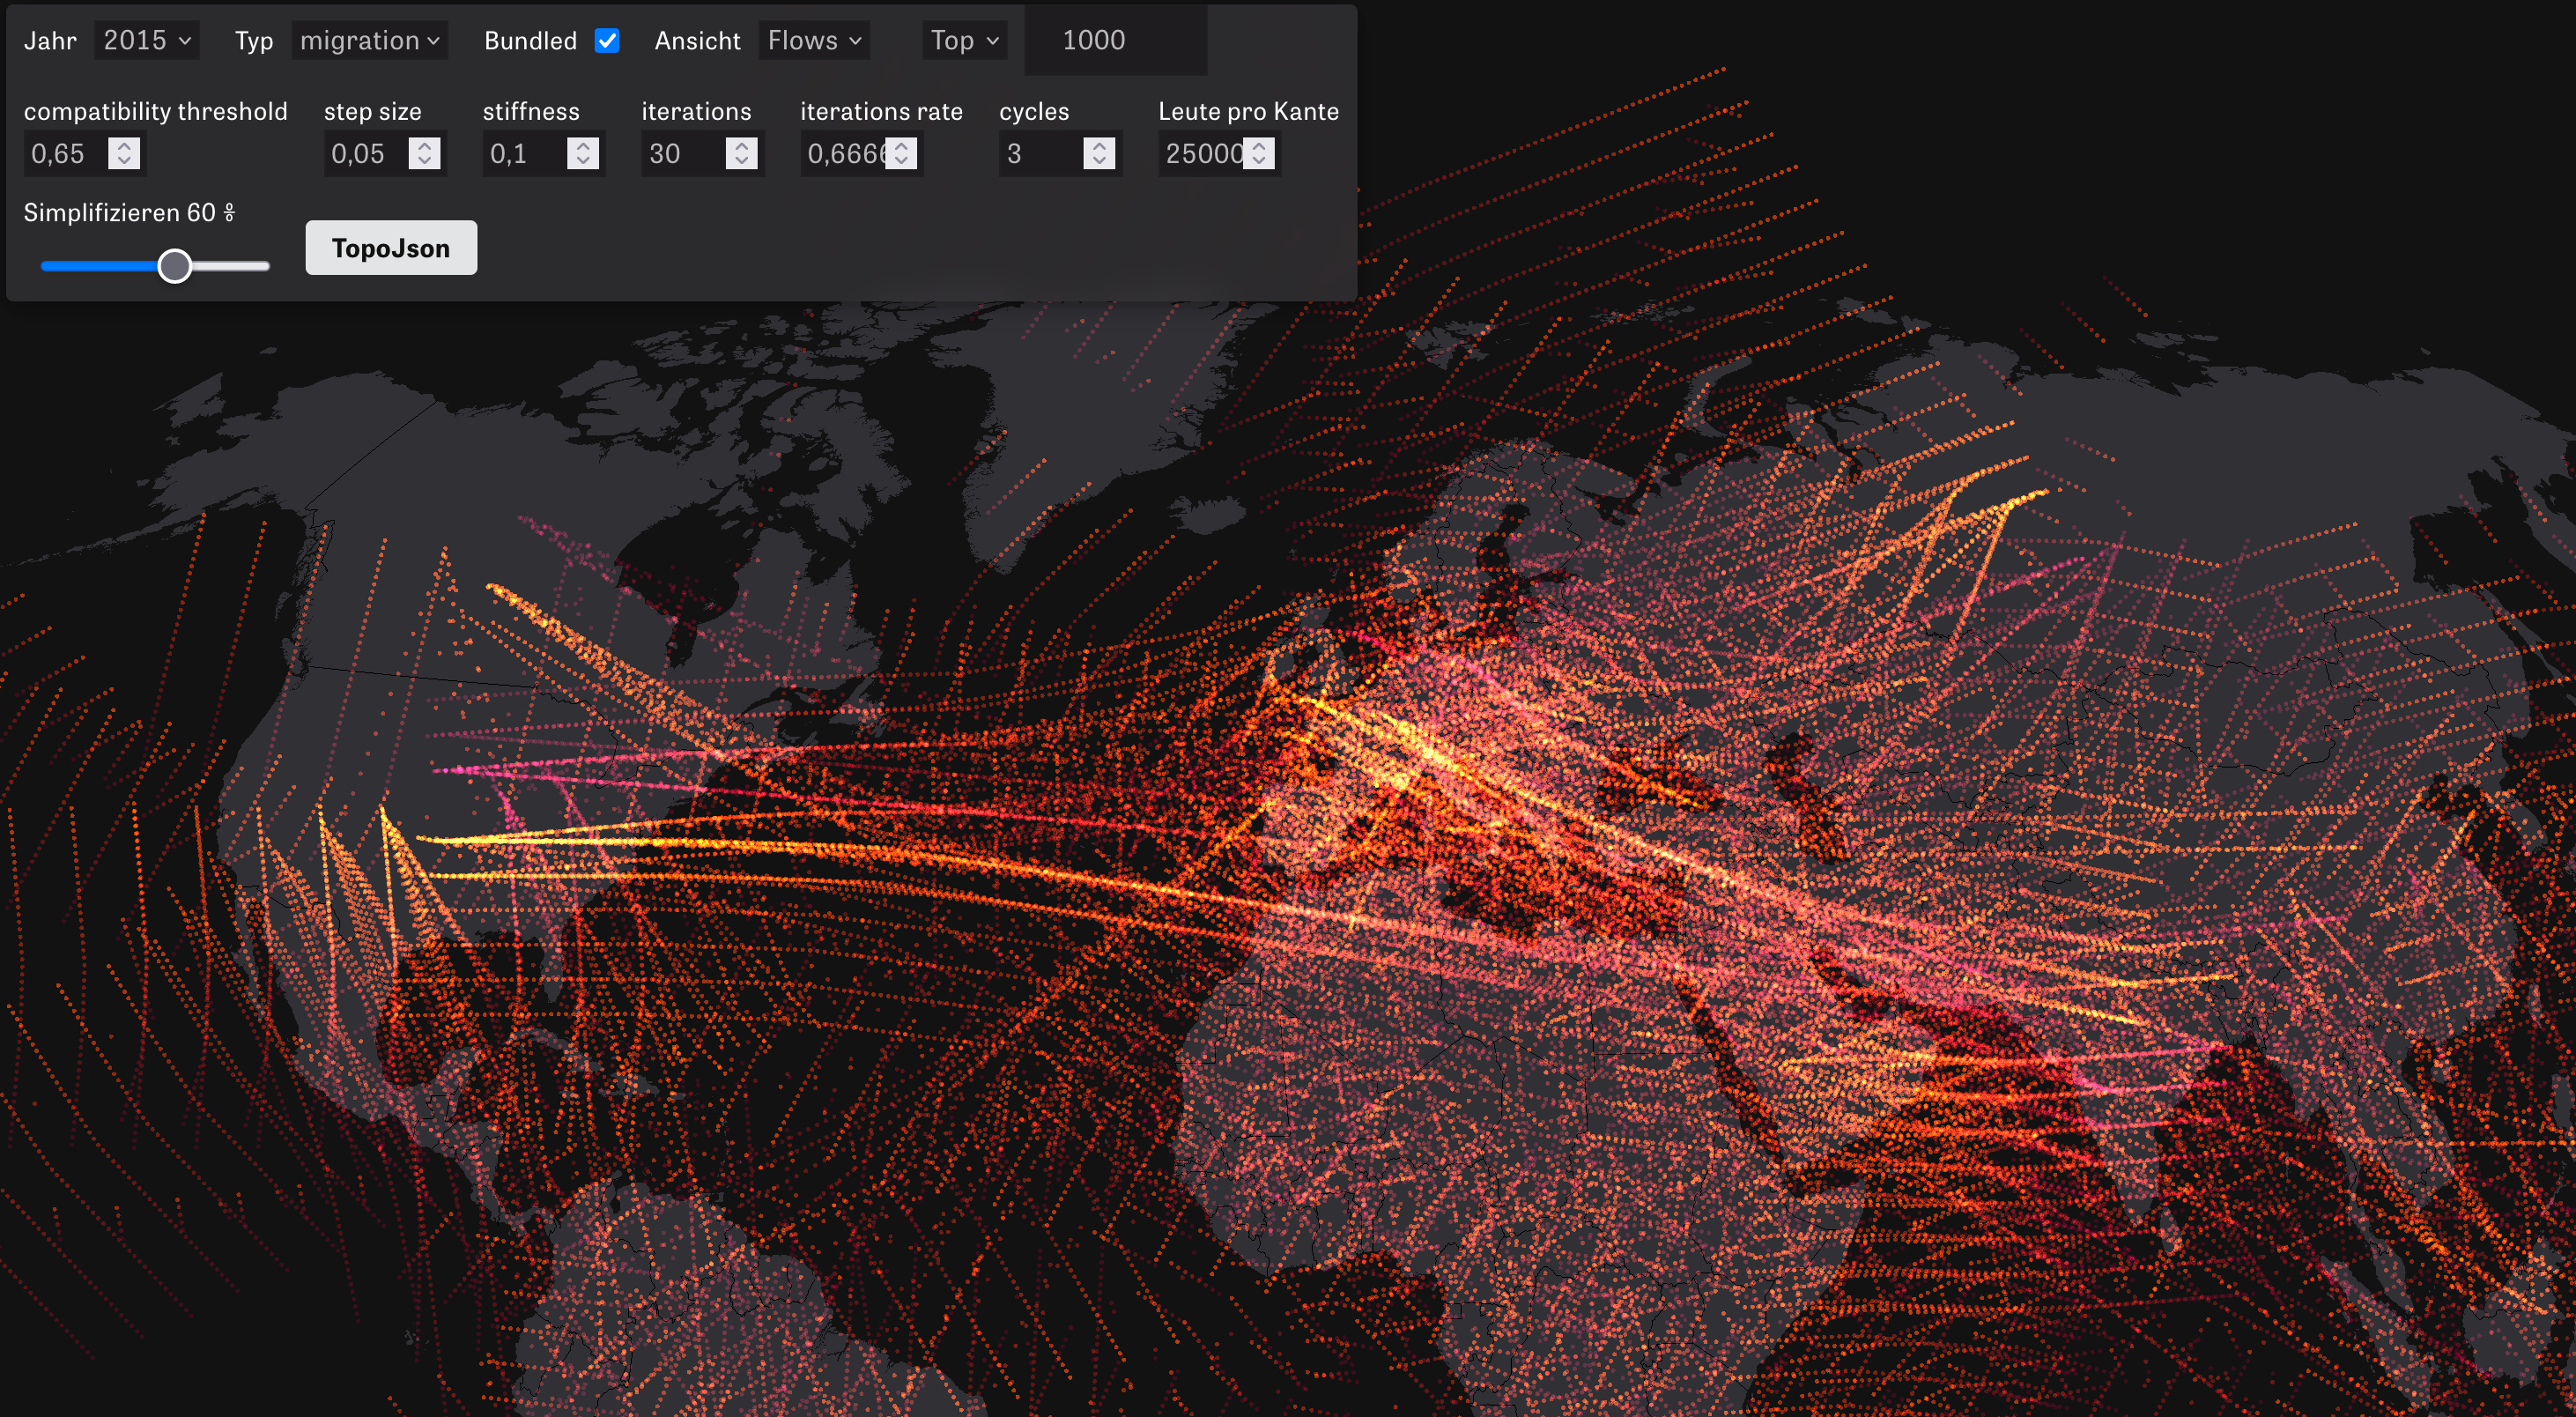
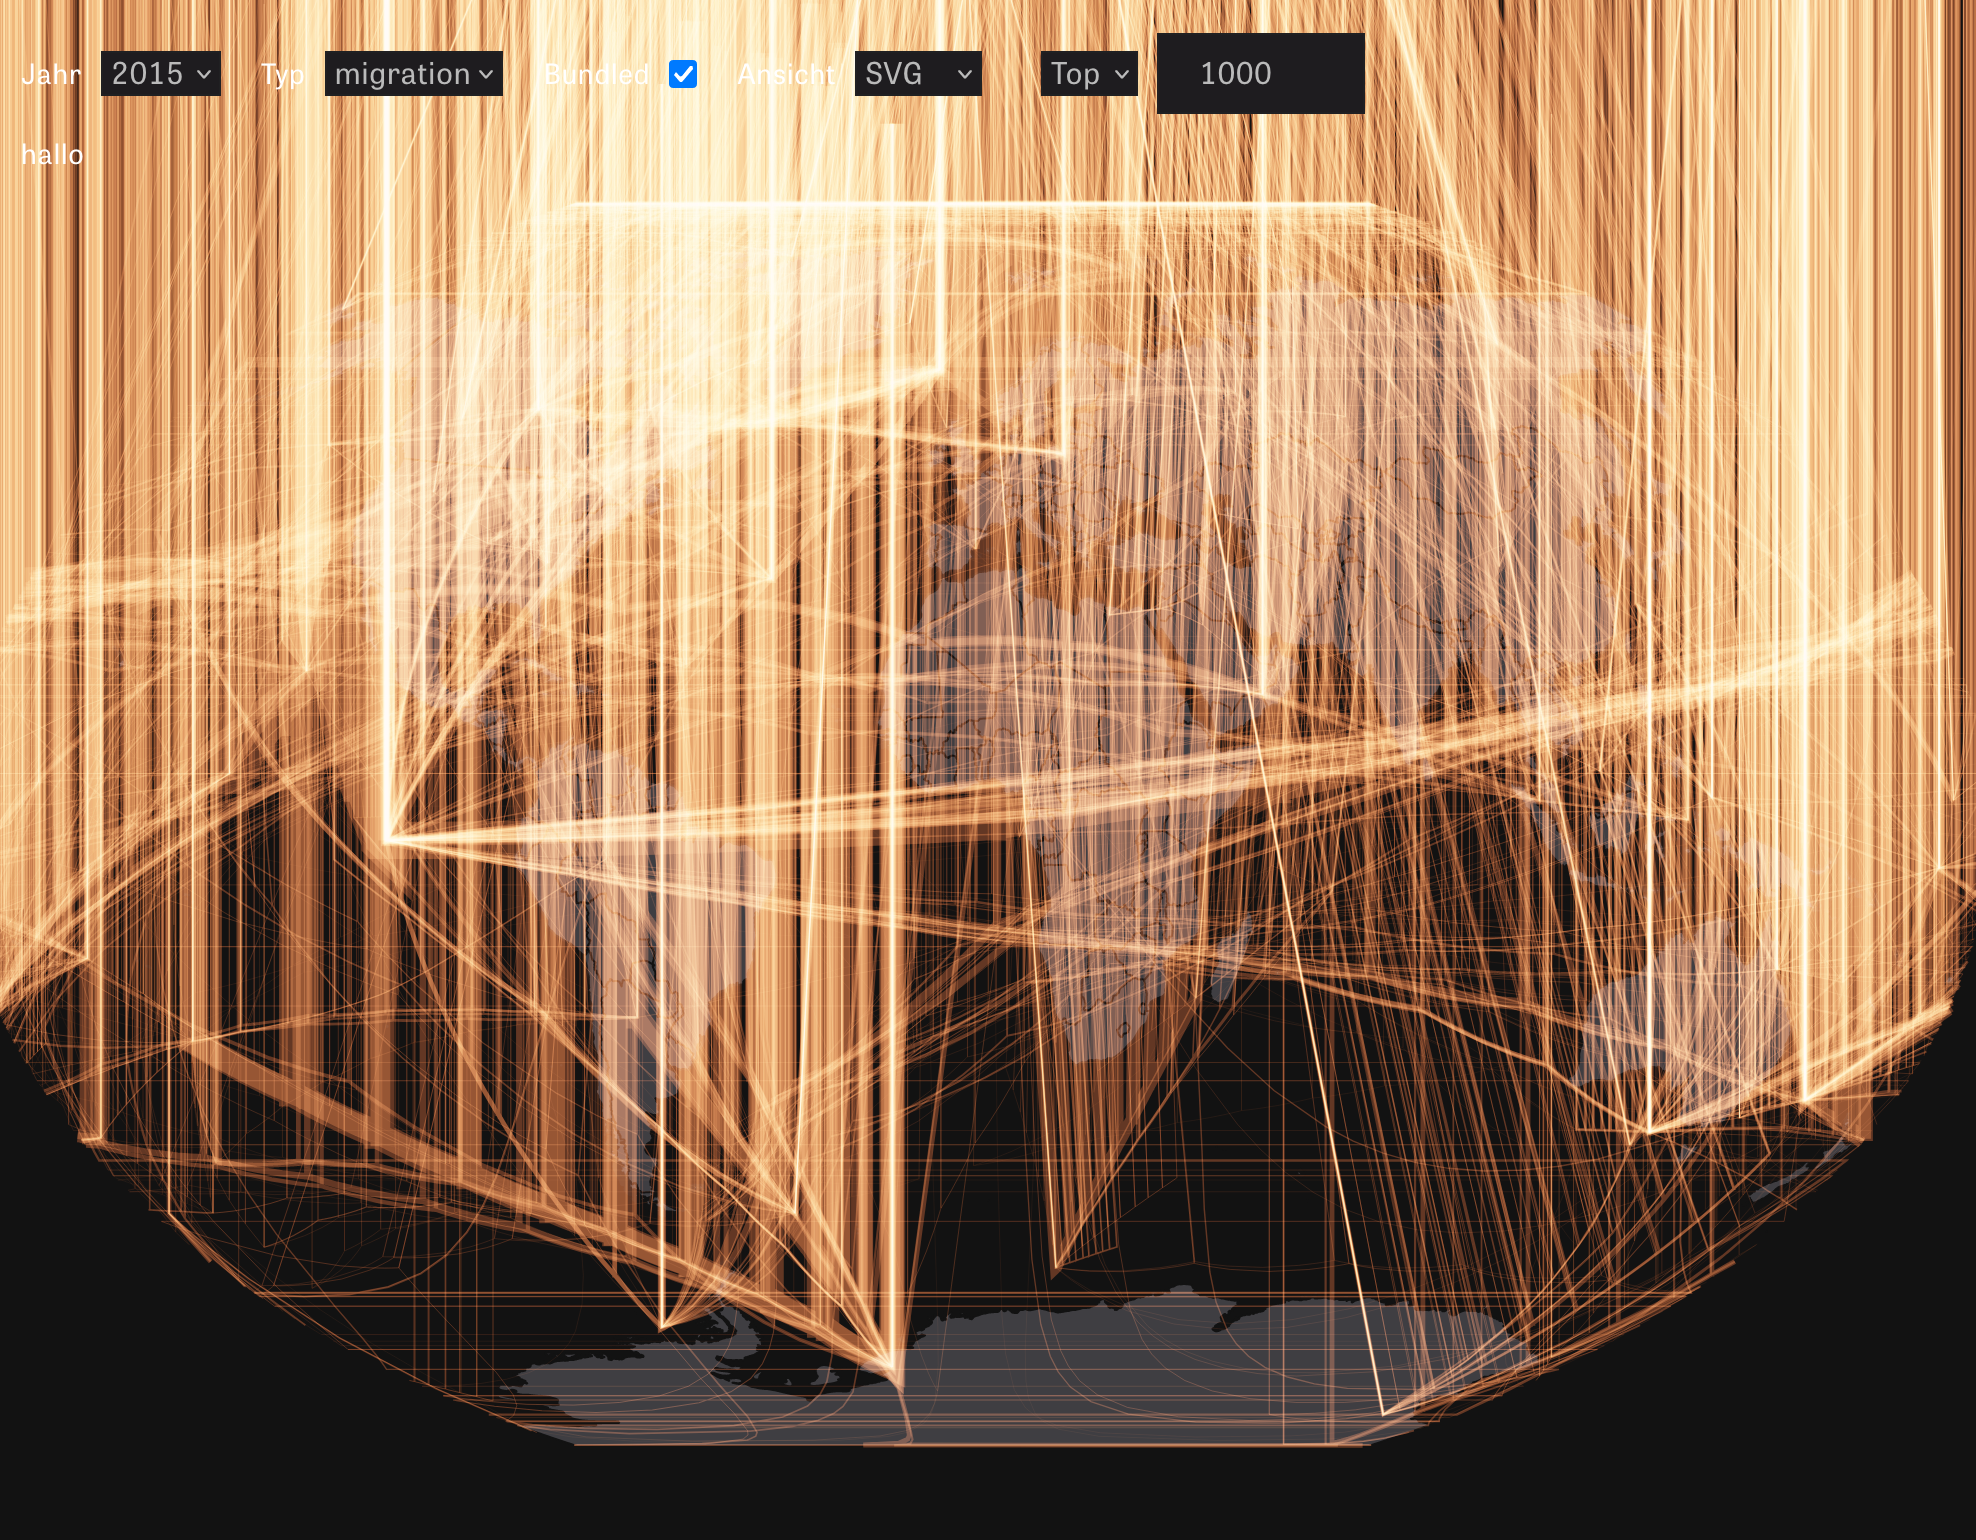
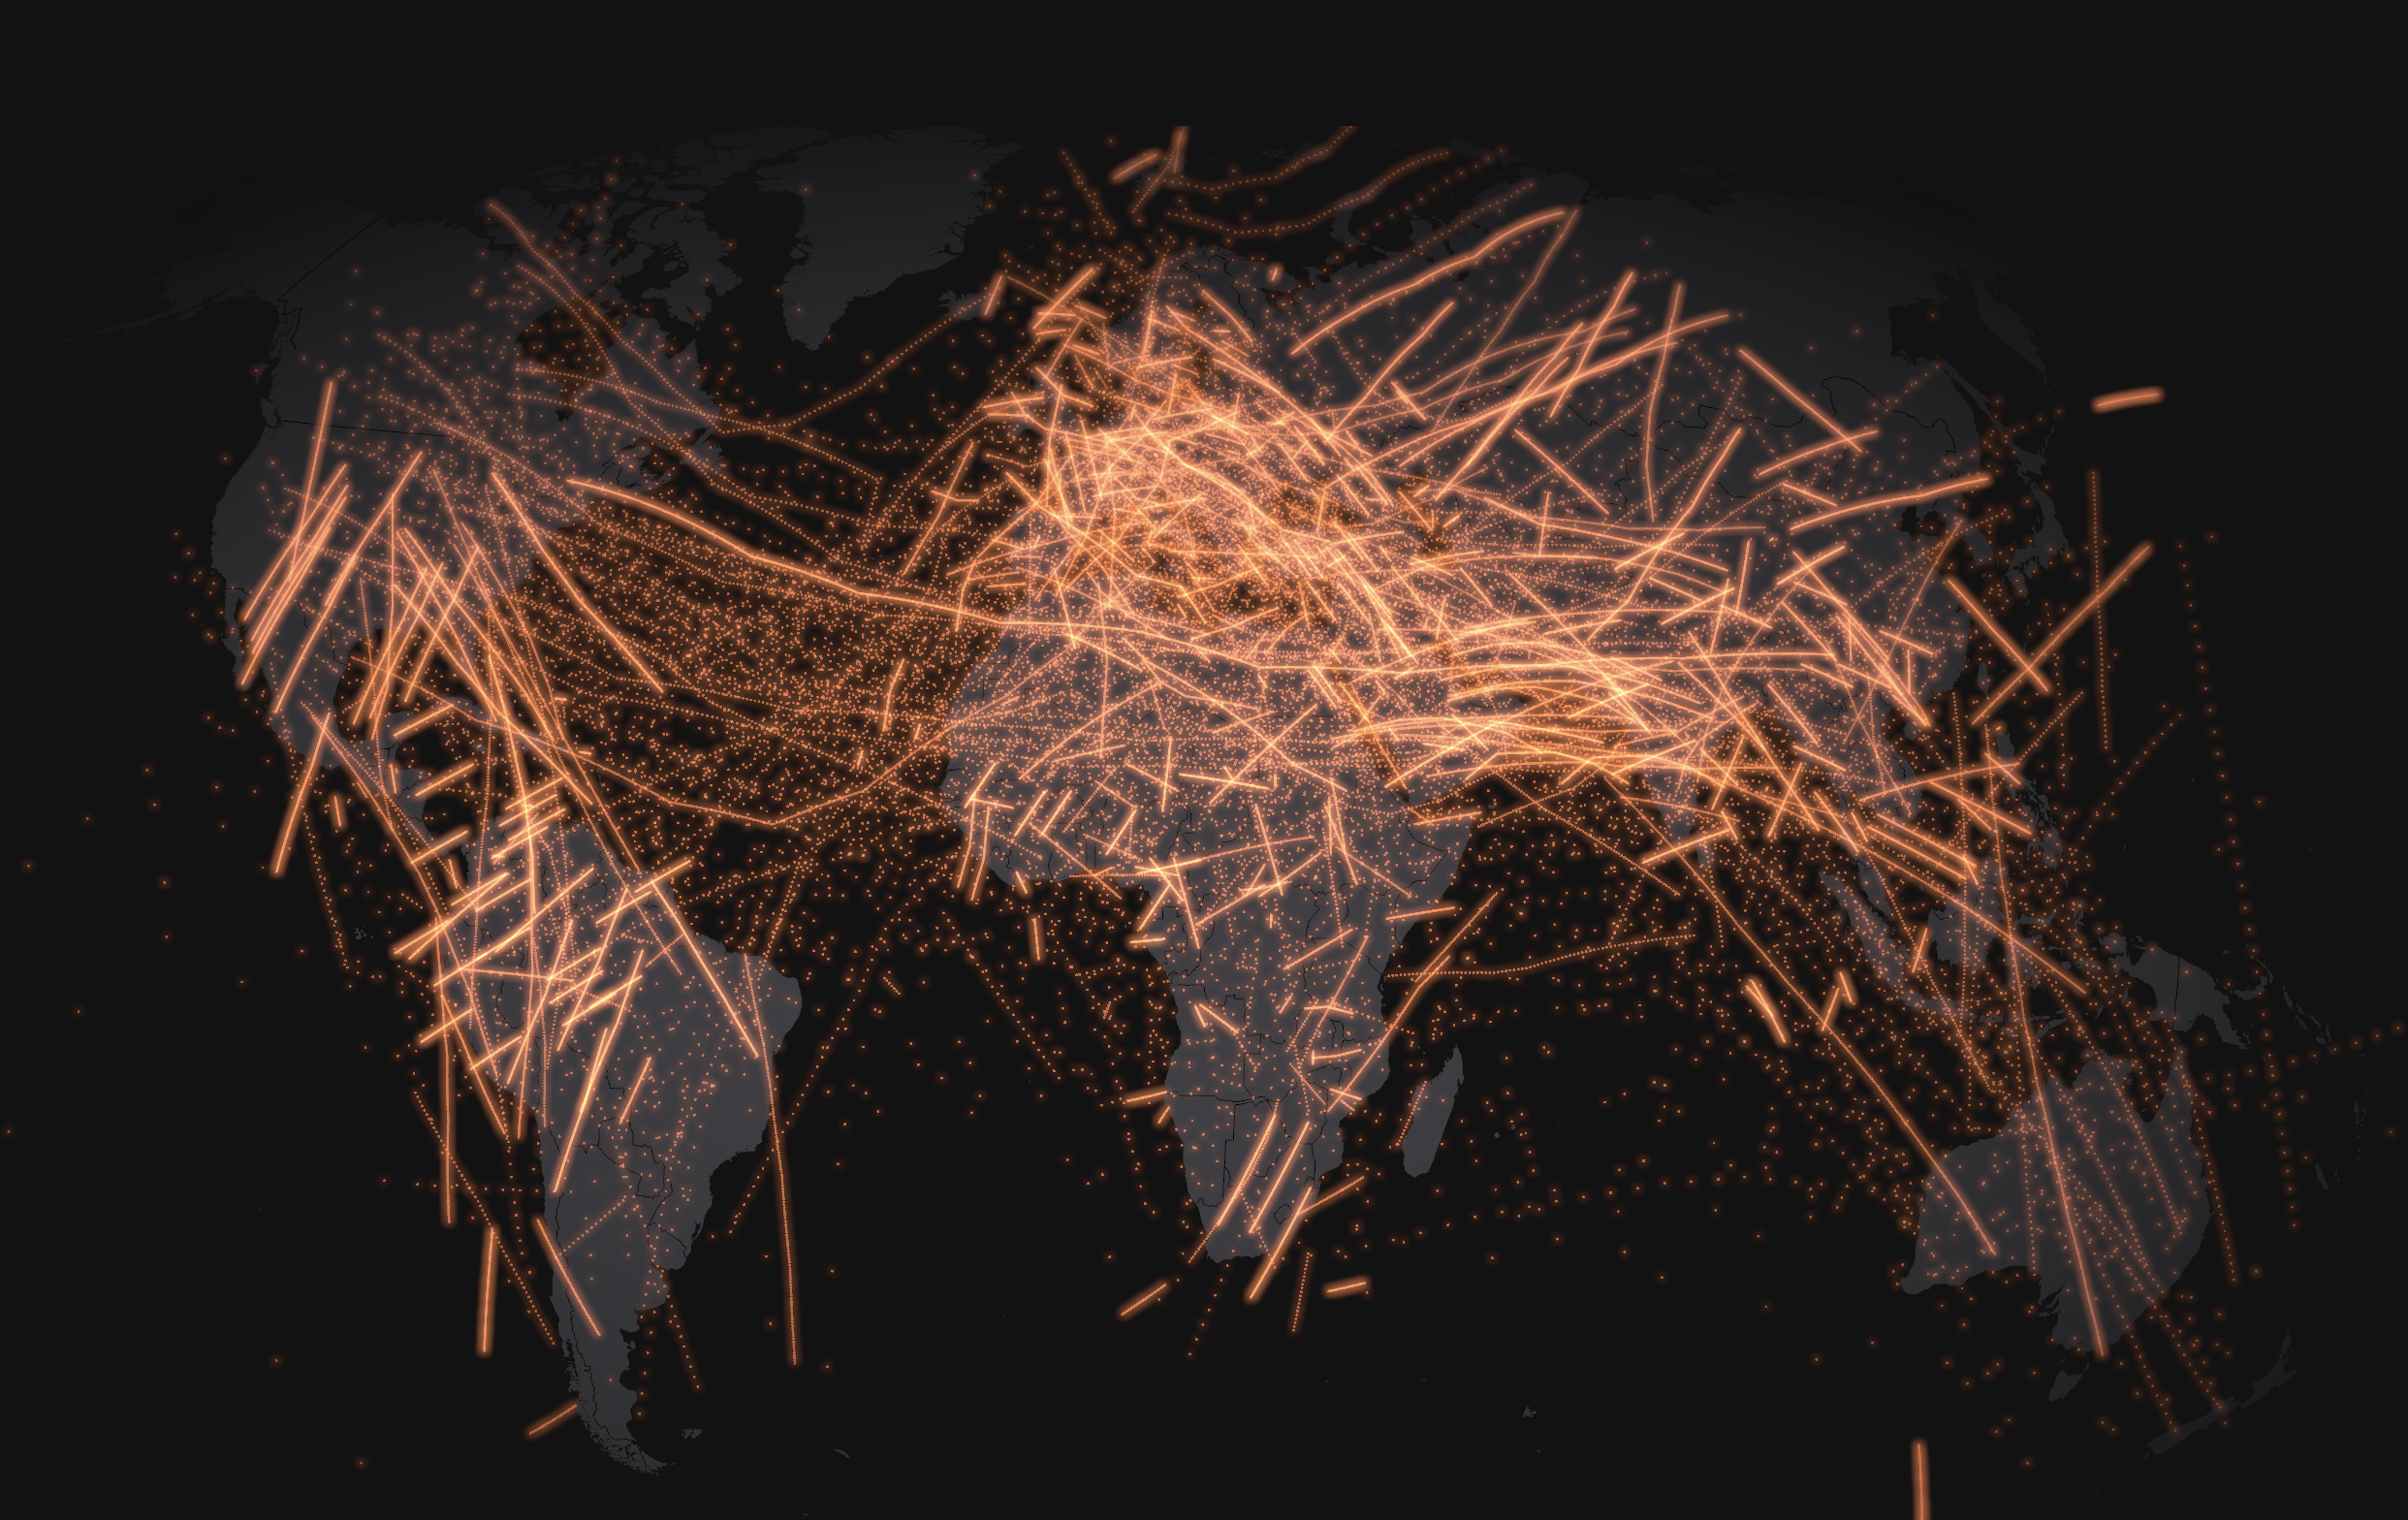
Outtakes from https://www.zeit.de/politik/2023-12/migration-weltweit-entwicklung-daten (article in German)
Many thanks to the fantastic team and the entire editorial team!
An overview of other projects can be found at https://www.zeit.de/daten-und-visualisierung
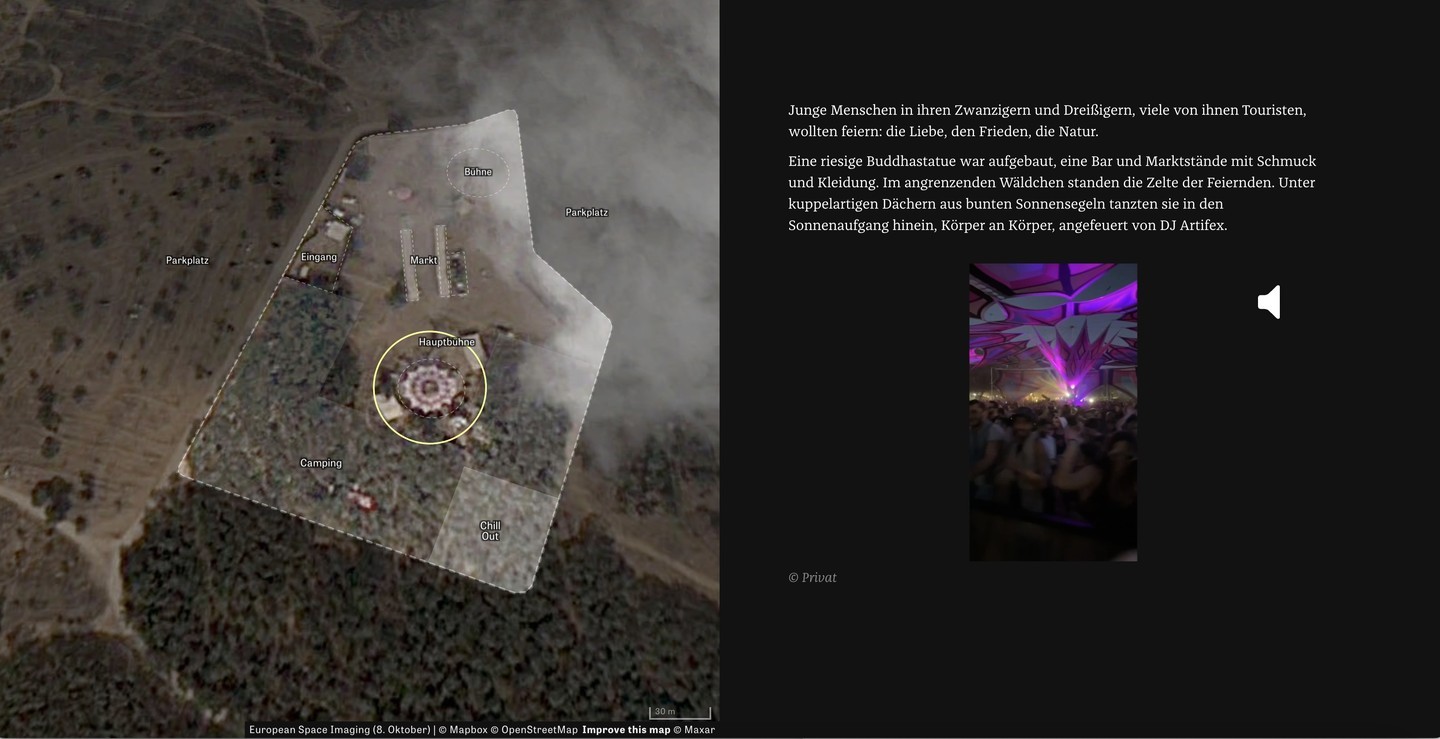
Hamas carried out a massacre at the Supernova Festival. Together with the Investigative Department, we show a reconstruction with satellite images and videos. https://www.zeit.de/politik/ausland/2023-10/supernova-festival-israel-hamas-angriff-musikfestival
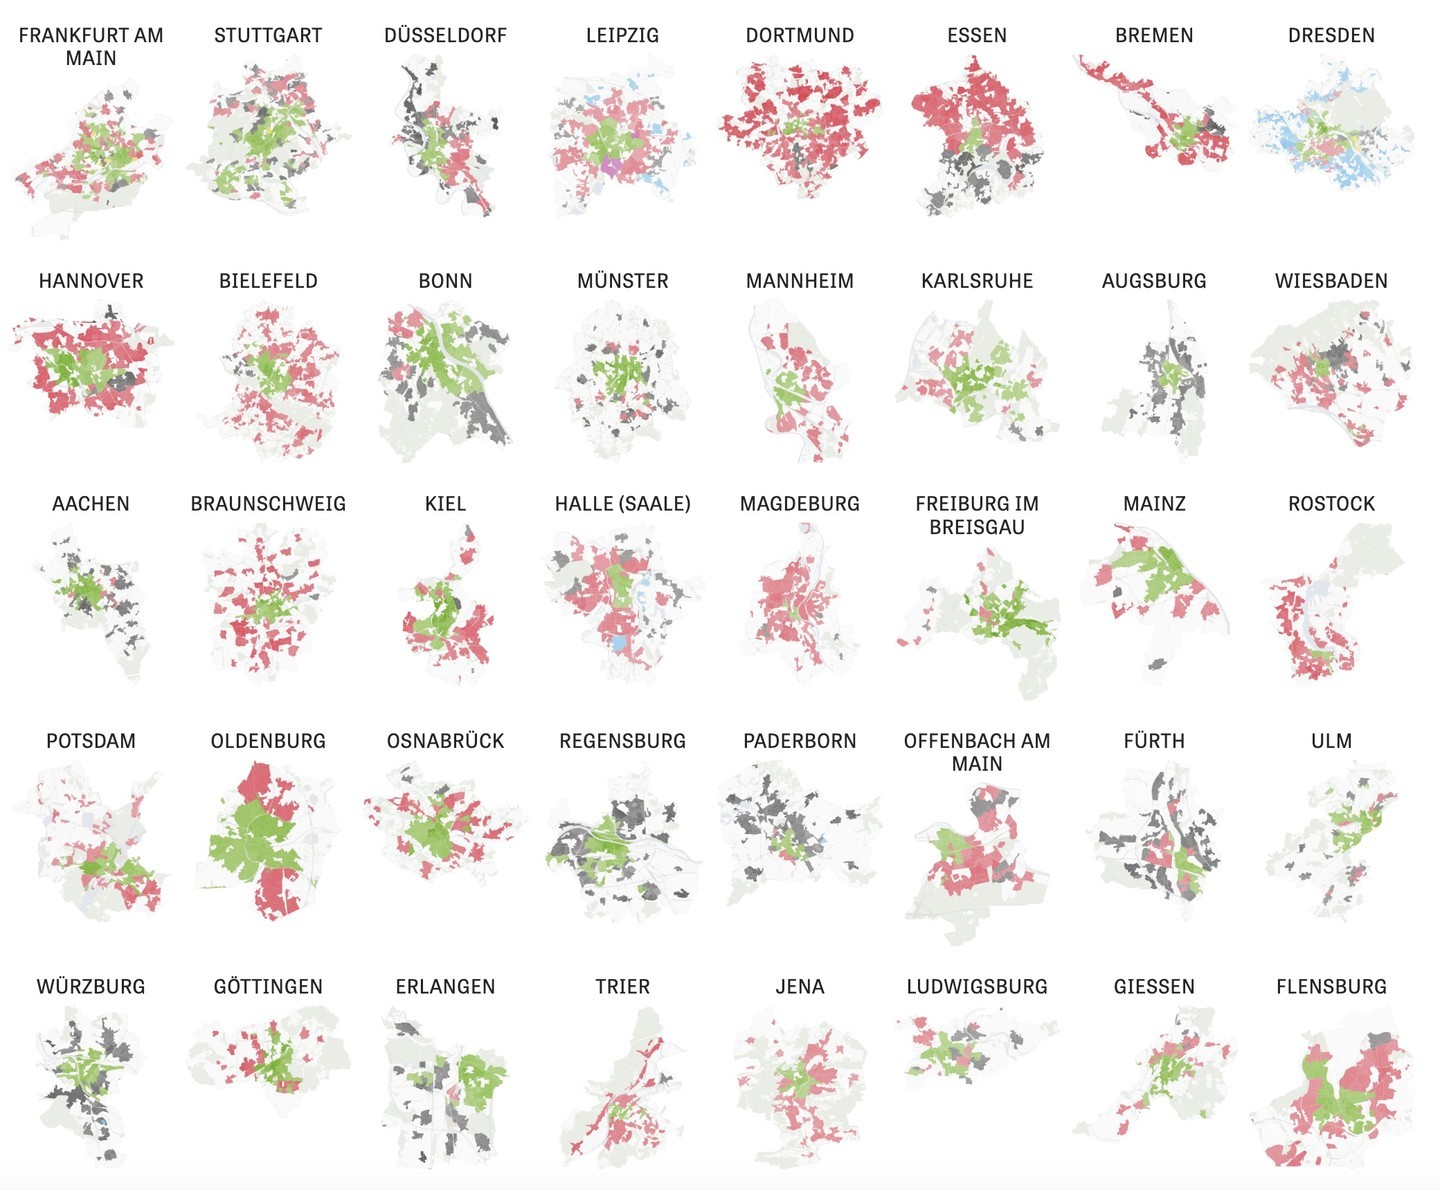
There is often talk of an urban-rural divide when it comes to political lines of conflict in Germany. In reality, however, many divisions run right through the cities. We have remapped the political landscape in Germany. https://www.zeit.de/politik/deutschland/2023-09/wahlverhalten-staedte-bundestagswahl-wahlkarte-analyse
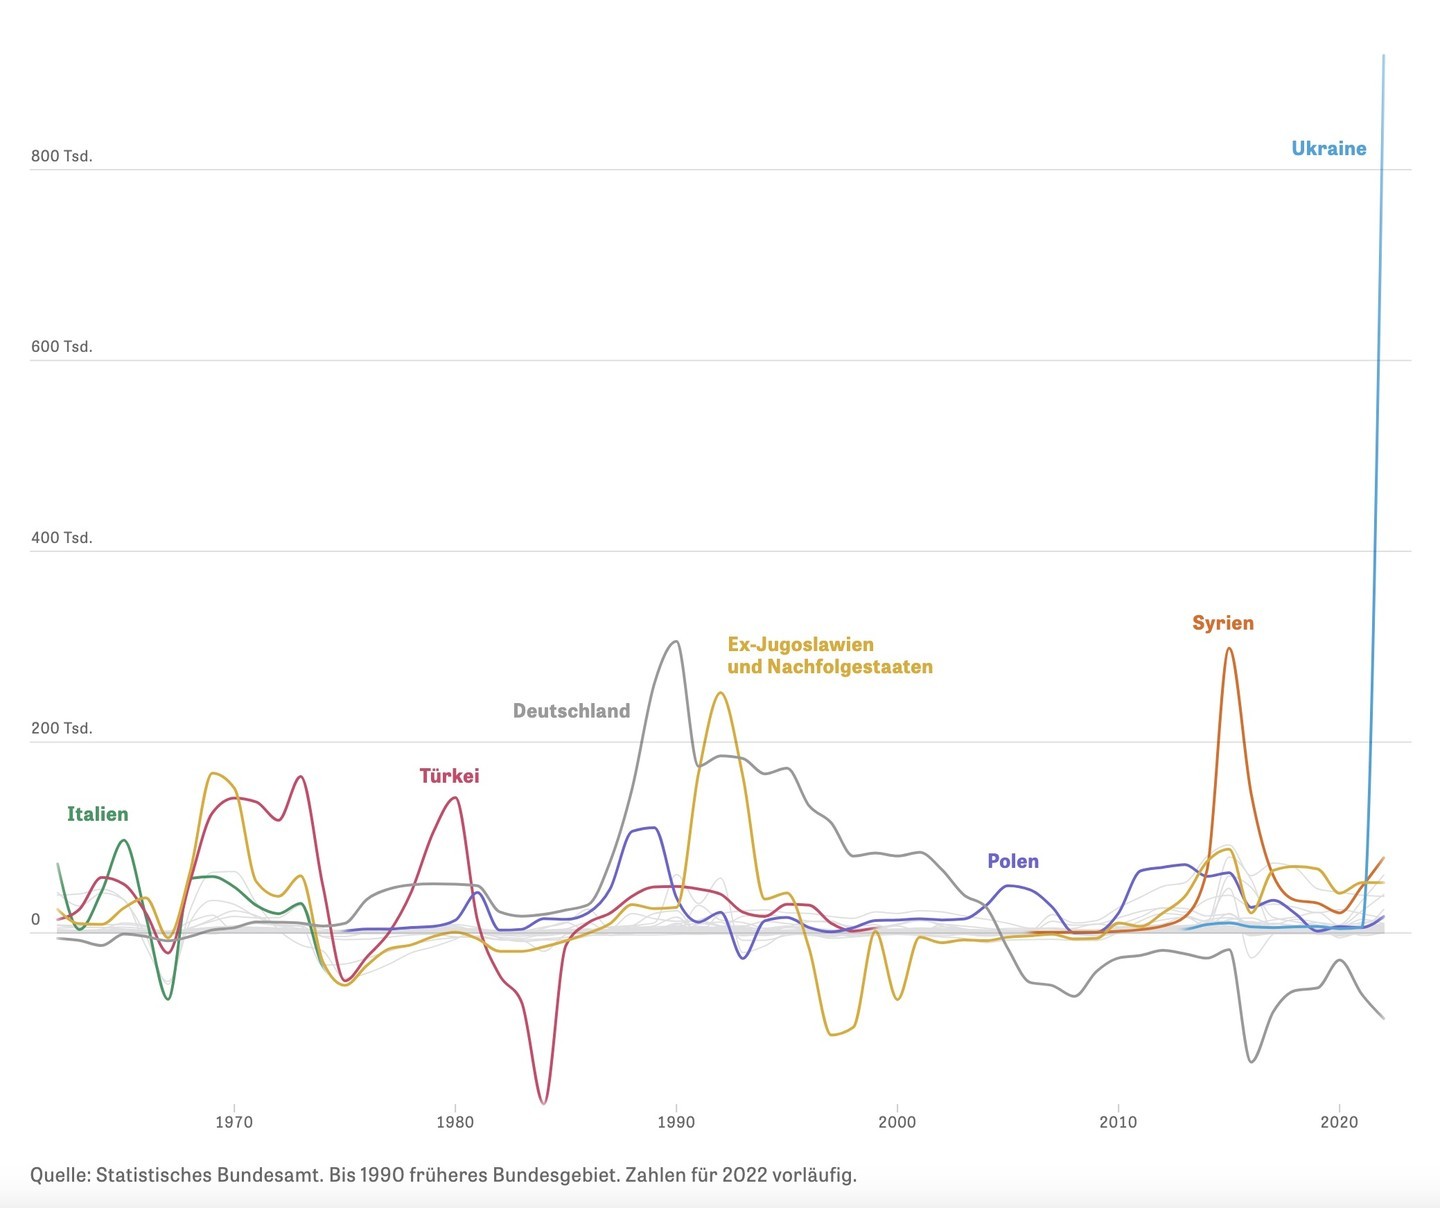
In 2022, Germany experienced the highest immigration in 70 years. Even before that, Germany was the second largest immigration country in the world. But how did this happen? And who are the millions who have come to Germany since then? https://www.zeit.de/gesellschaft/2023-05/migration-gefluechtete-einwanderungsland-wanderungsstatistik-gastarbeiter
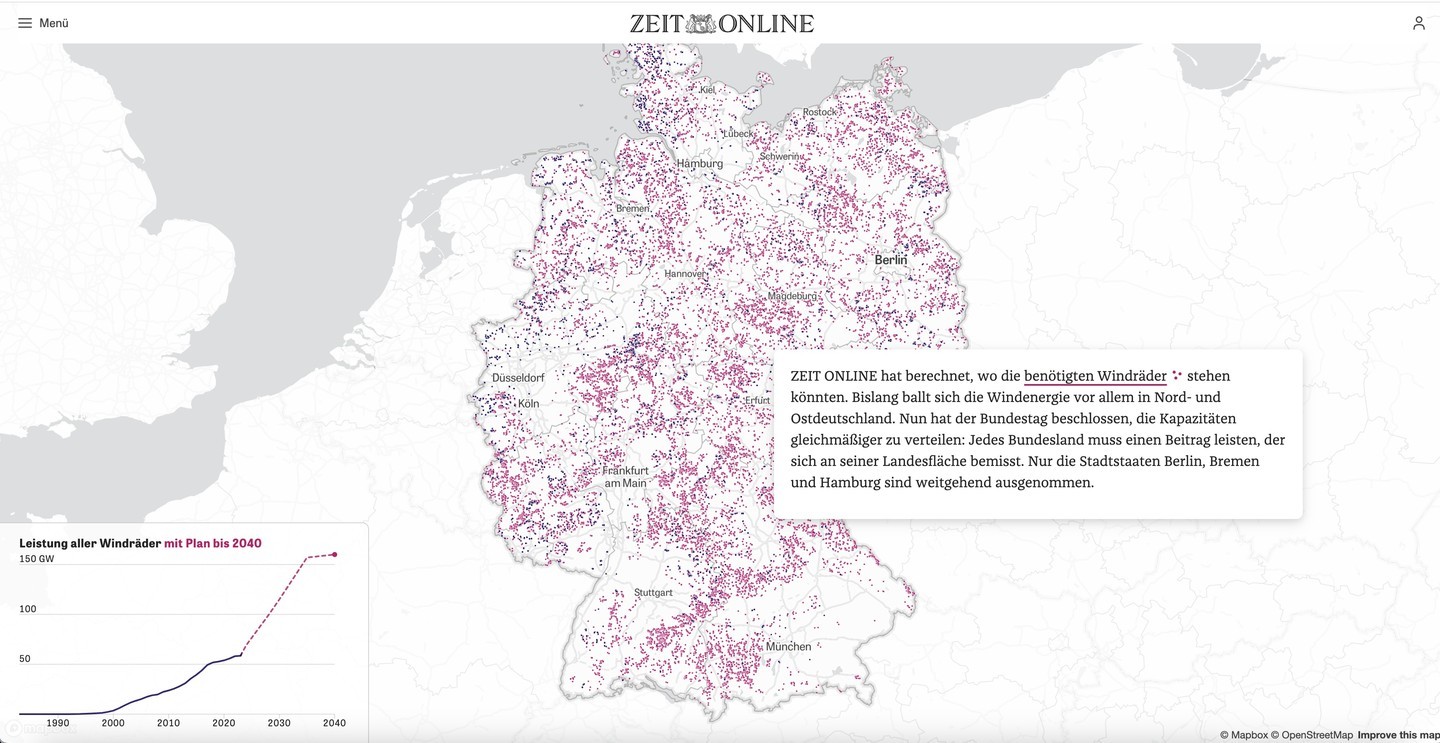
The energy transition is not possible without tens of thousands of new wind turbines. For the first time, we have calculated that there is enough space for all the wind turbines that would be needed for the energy transition in Germany. https://www.zeit.de/wissen/umwelt/2023-04/energiewende-deutschland-windkraft-ausbau-windraeder-flaechen-karte
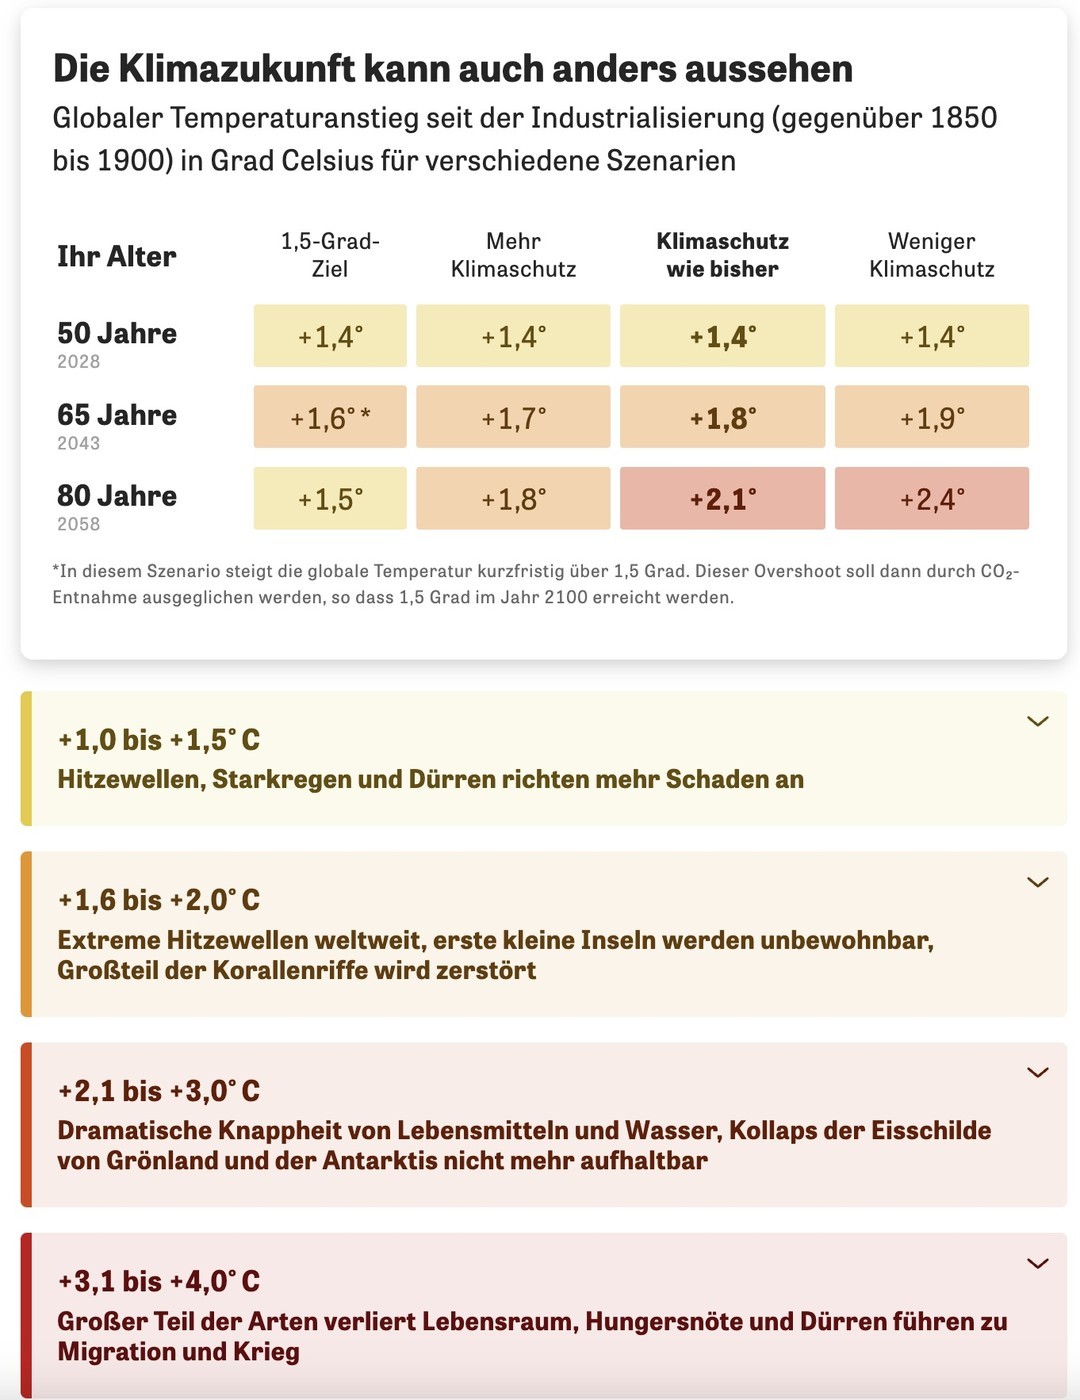
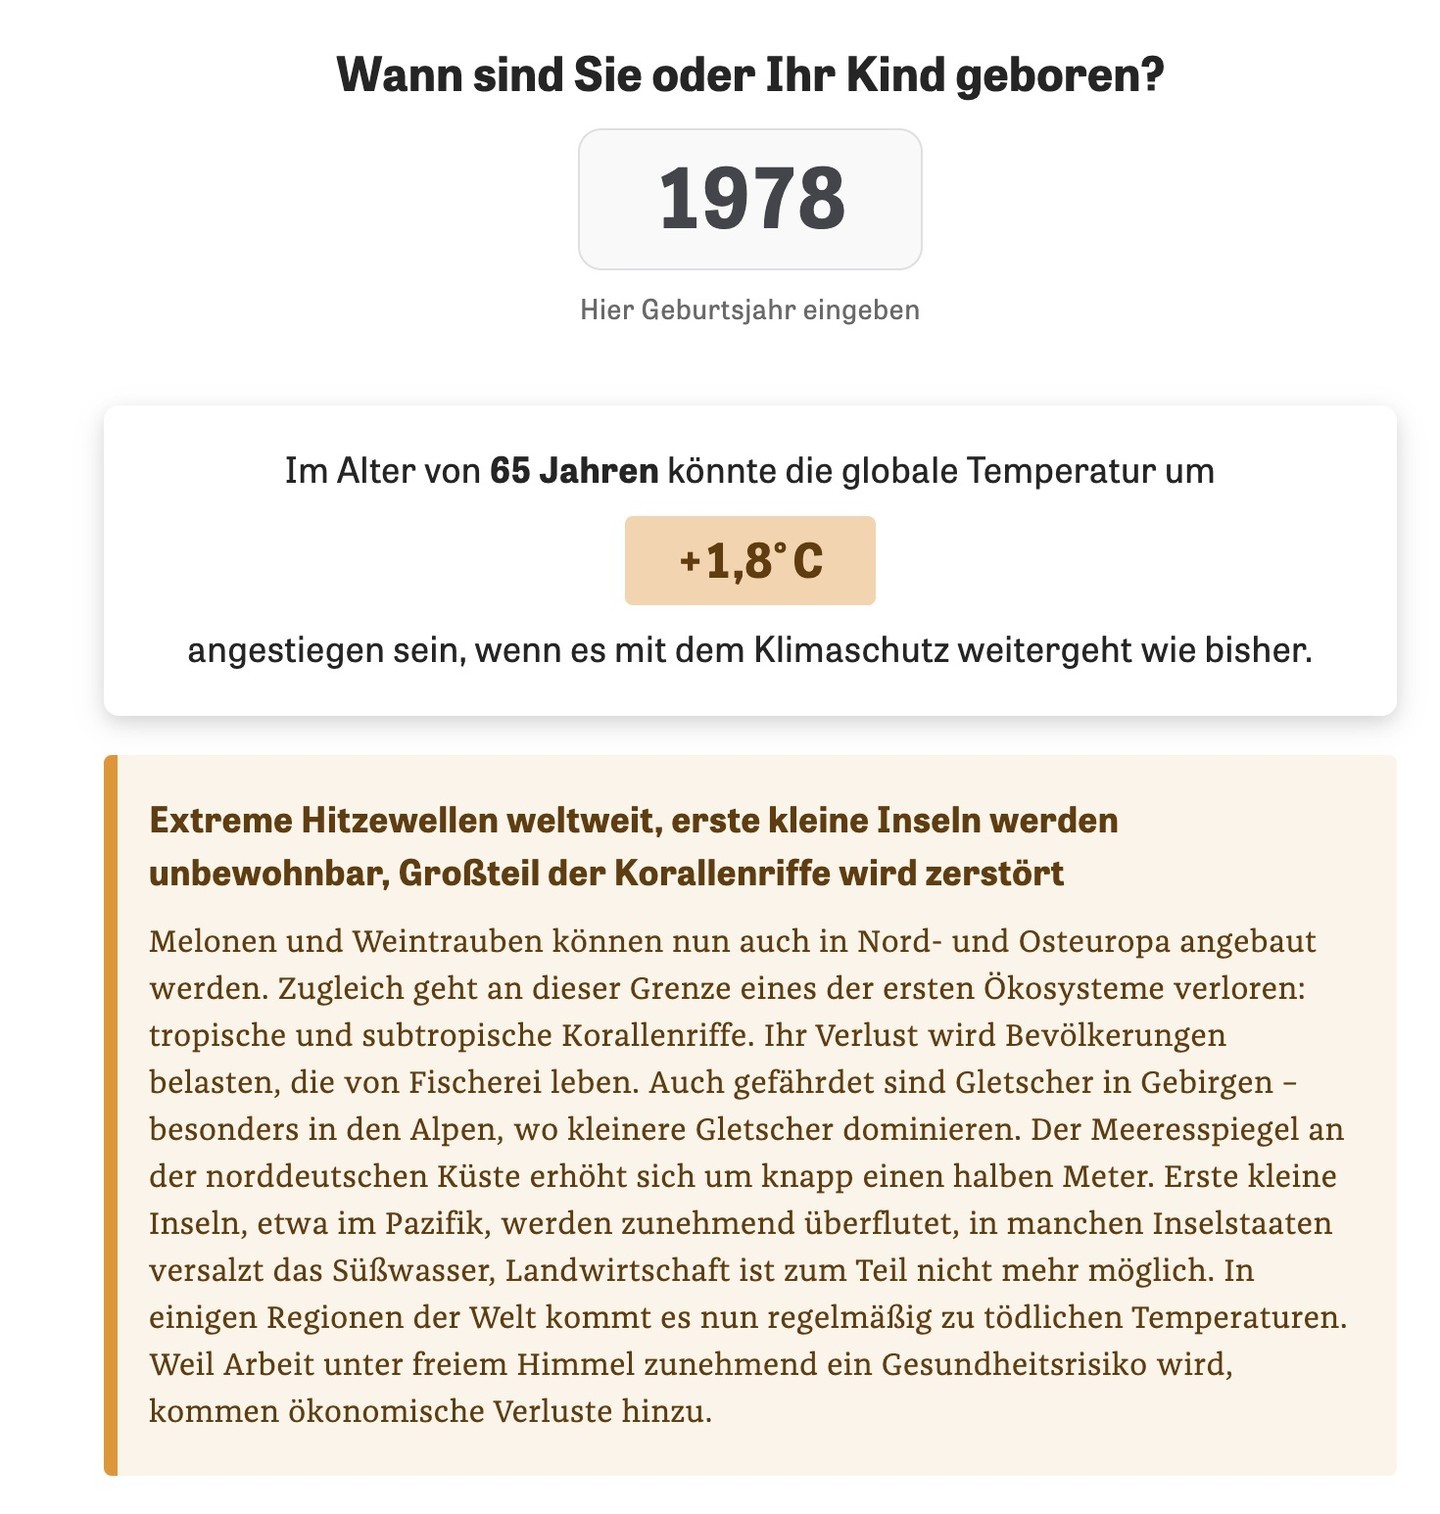
Climate change will soon fundamentally alter the Earth. But what do these abstract scenarios from the Intergovernmental Panel on Climate Change mean? Our interactive calculator shows what future we, our children and grandchildren can expect. https://www.zeit.de/wissen/umwelt/2023-03/ipcc-bericht-klimawandel-weltklimarat-zukunft
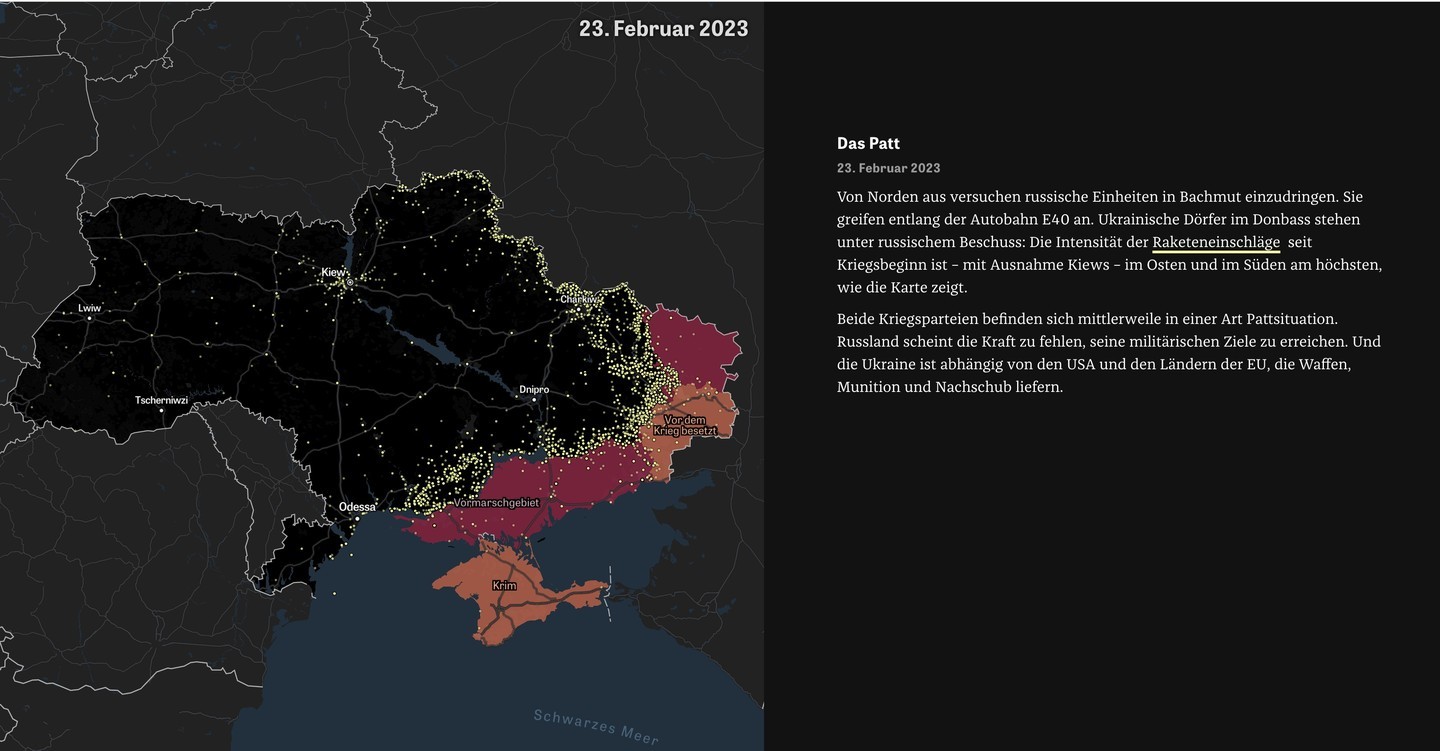
Invasion, resistance, counter-offensive, trench warfare: on the anniversary of Russia's attack on Ukraine, we show the most important phases in maps and satellite images. https://www.zeit.de/politik/ausland/2023-02/ein-jahr-krieg-ukraine-russland-schauplaetze-chronik-satellitenbilder
Client Info
Server: https://mastodon.social
Version: 2025.04
Repository: https://github.com/cyevgeniy/lmst