It seems that I have been blessed with my first clawdbot (or similar) interactions on one of my repositories. I really hope this sort of noise doesn't end up (a) wasting maintainer's time (b) putting people off trying the underlying technology where it's actually useful.

Laurence Tratt
Shopify / Royal Academy of Engineering Research Chair in Language Engineering.
Website
@phairupegiont @lritter @oxidecomputer That is a design choice that has consequences: those consequences might be OK in some situations and not in others. Alas, there is no universal answer.
@david_chisnall When I last looked into this, there was good quality evidence that too high PSI is worse in the real world -- but IIRC there was no evidence either way for the (I suspect probable) opposite that too low PSI is also worse. Certainly, on cars, too low is bad, and I suspect that holds true for bikes too. That said, I wouldn't up the pressure for other reasons: the comfort of low pressure tyres on wrists is underappreciated!
Laurence Tratt boosted:

Load-store elimination, now with type-based alias analysis (TBAA)
In the futurementary Terminator, I don't remember Skynet starting off with open-source repositories https://theshamblog.com/an-ai-agent-published-a-hit-piece-on-me/ (I also strongly suggest following the link to the GitHub PR, because it makes much more sense with that as context).
@david_chisnall One possibility: it may have had a hand-written lexer that had this limitation / design decision? Maybe even because lex hadn't been invented at that point (IIRC it postdates yacc by a year or two).
In the past fortnight, 50% of my conversations have seen me say "today's AI cannot do that and we have no idea if and when it will".
In the other 50% I've said "today's AI can do that, really, and you just need to try it".
Our collective calibration is currently very wonky!
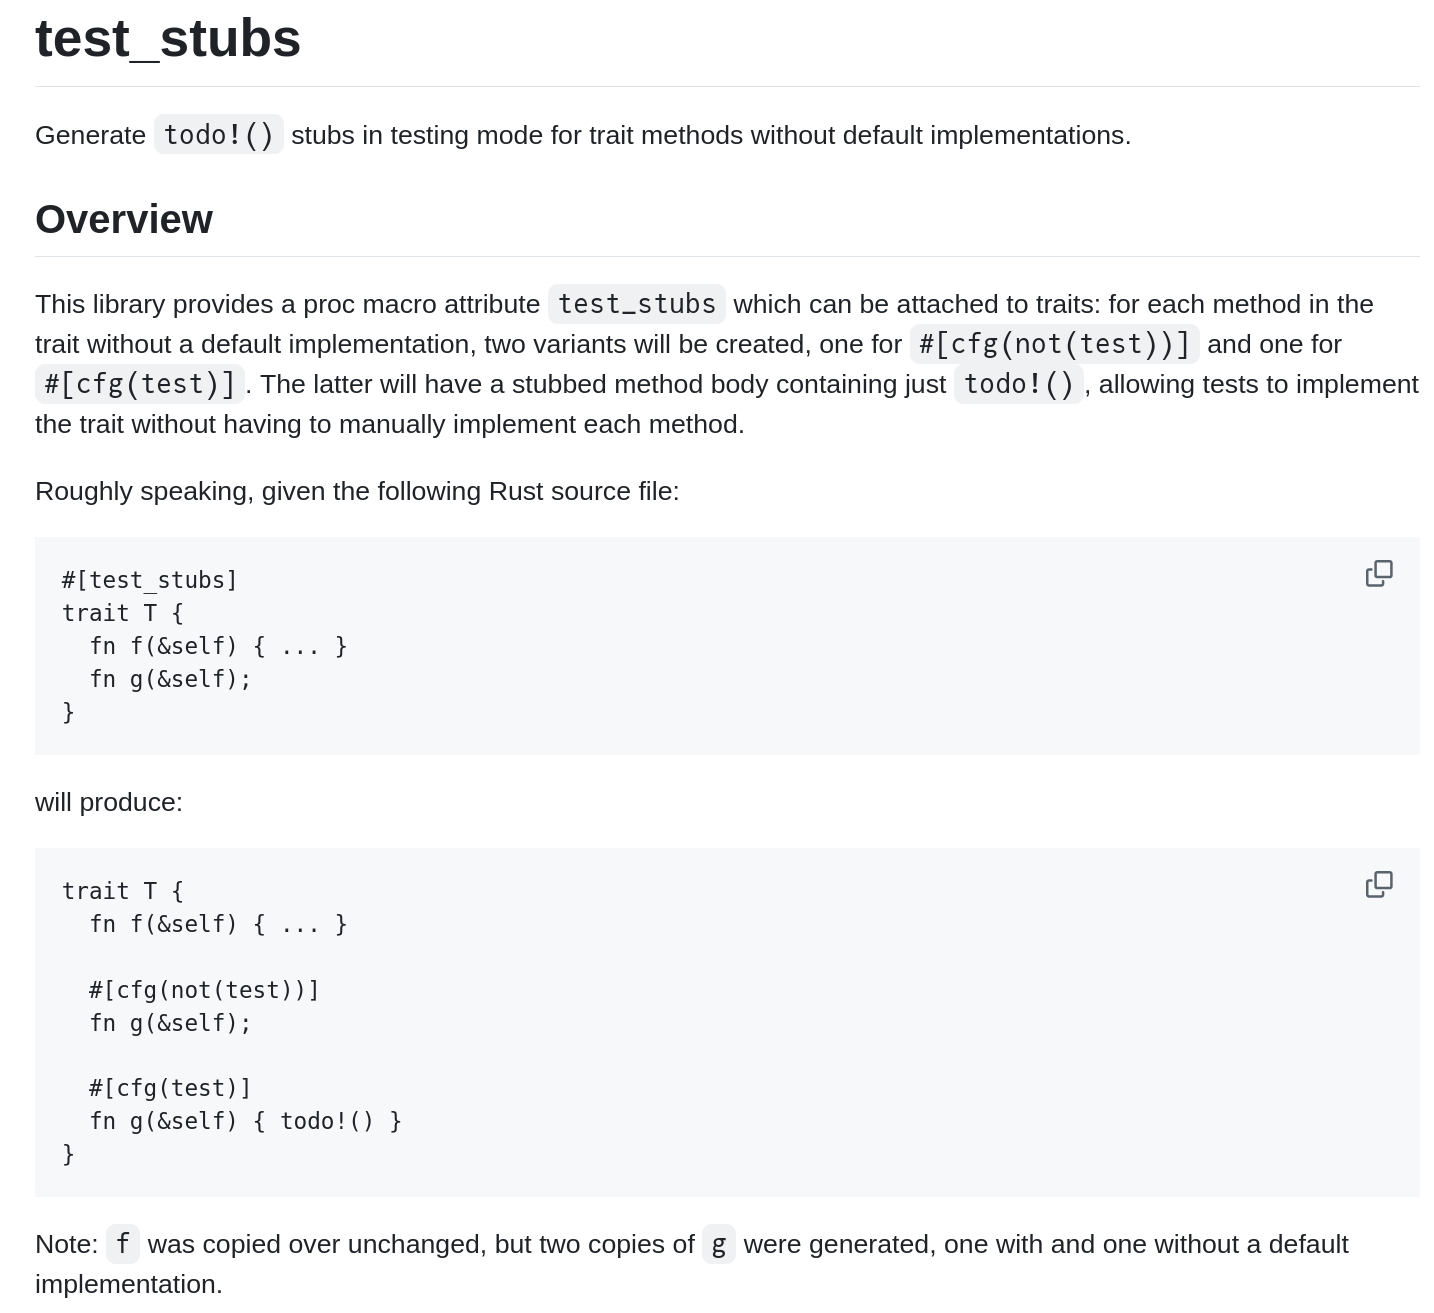
Scratched a Rust itch with an experimental new crate `test_stubs`. I have traits with lots of methods. "Proper" code should implement all methods, but test code need not. `test_stubs` means that test code doesn't have to manually create `todo!()` methods.
This has saved me 950LoC in one Rust program alone. Comments welcome -- I definitely consider this experimental right now! https://github.com/ykjit/test_stubs
There's nothing more surprising than an agent, in the middle of doing some useful refactoring, asking if it can run a Python script which solely prints "HI" (yes, in uppercase) to stdout.
If you're thinking of applying to PLISS, you've got three days left! https://pliss.org/2026/registration.html
@david_chisnall I agree that conferences now do far too much gold-plating of things where no plate of any kind is needed. Whether or not big conferences are a good idea is above my pay grade!
Re: fees. For PLISS, thanks to sponsorship, we subsidise each attendee far more than any conference I know of. I suspect Dagstuhl is similar, but I don't know their figures. In no small part, this is because potential sponsors understand that many students need subsidies, and are thus motivated to help.
A first: I awoke to a PR on one of the Rust projects I maintain that results from a proposed fix to a rustc oversight. Our code should never have compiled, IMHO, so the rustc fix is a good one!
For those interested in the rustc change: https://github.com/rust-lang/rust/pull/150681
When I read Walter Bagehot's (d. 1877) "The English Constitution" years ago, I was surprised at how much time he spent contrasting it to the US constitution. I now realise he had thought deeply about the plausible futures of both and how they could adapt and/or go wrong.
This is definitely a book I need to reread. Honestly, I read it in the past in part because he grew up near me. I soon realised I was in the hands of a master, even if I didn't quite understand the depths of that.
Laurence Tratt boosted:

I've used conditional breakpoints and logging in lldb to make it approximate a trace-based system. This is basically letting me add conditional printfs to a program without recompiling it. That's the kind of feature I'd like to see front and centre in a debugger.
That said, I completely agree on reverse debugging. I had one test case in the Objective-C runtime that was an intermittent memory corruption bug. It triggered on one in (maybe) twenty CI runs and made the CI flaky. Occasionally I could reproduce it with a debugger attached, but never with enough information to debug.
When I was working on the Windows port, I used WinDbg. It had a time-travel mode, so I ran the test case until I got a crash, put a watchpoint on the address with the corrupted state, and ran it backwards to get to the place where the corruption happened. The fix was then trivial.
We have an internal tool that I hope we'll open source once it's a bit more mature that provides a gdbserver interface from a CPU instruction trace. This lets you single step forwards and backwards in time and inspect the state at any point.
@david_chisnall Agreed, and I do the same! I have a trivial script `try_repeat` (https://tratt.net/laurie/src/try_repeat/) which works really well with `try_repeat <num> rr record ...`. It's been an absolute godsend for nondeterministic crashes!
@djc No. I am happy they have a business model, but that makes it difficult for me to imagine using it at the scale I would need to get comfortable with it. Neither they nor my employment situation are at fault: it's just a mismatch in possibilities.
It's so good that I am willing to overlook how terrible the (gdb) debugger UI is. I don't need most of the weird hard-to-remember features, as they're much less necessary (for me) when reverse debugging.
I've never been a fan of debuggers. Examining the state at the point of a crash rarely helps me: the problem is nearly always earlier in time. `printf` is more useful to follow the trail forwards.
Reverse debugging, specifically `rr`, has changed this calculus for me. By starting at the error and working backwards (and sometimes forwards), I have a sort of uber-powerful `printf` that allows me to examine the trail.
A reminder for those interested in PLISS 2026: there are 10 days left to register your interest. https://pliss.org/2026/registration.html
@david_chisnall Good allocators definitely make a _big_ difference, but I attribute one of the hard-to-quantify costs of small allocations to fragmentation. Very program dependent, of course, but bunching up small allocations sometimes puts things next to each other that otherwise might have been separated. For example, I just flattened a Rust Vec<Vec<X>> into Vec<X> and could measure the speedup (with a good allocator). More code for me, but I assume the fragmentation benefit was the main win.
Client Info
Server: https://mastodon.social
Version: 2025.07
Repository: https://github.com/cyevgeniy/lmst