and here is the visual inspiration and sketches:
Shirley Wu
½ code ⌨️ ½ art 🎨; work-in-progress
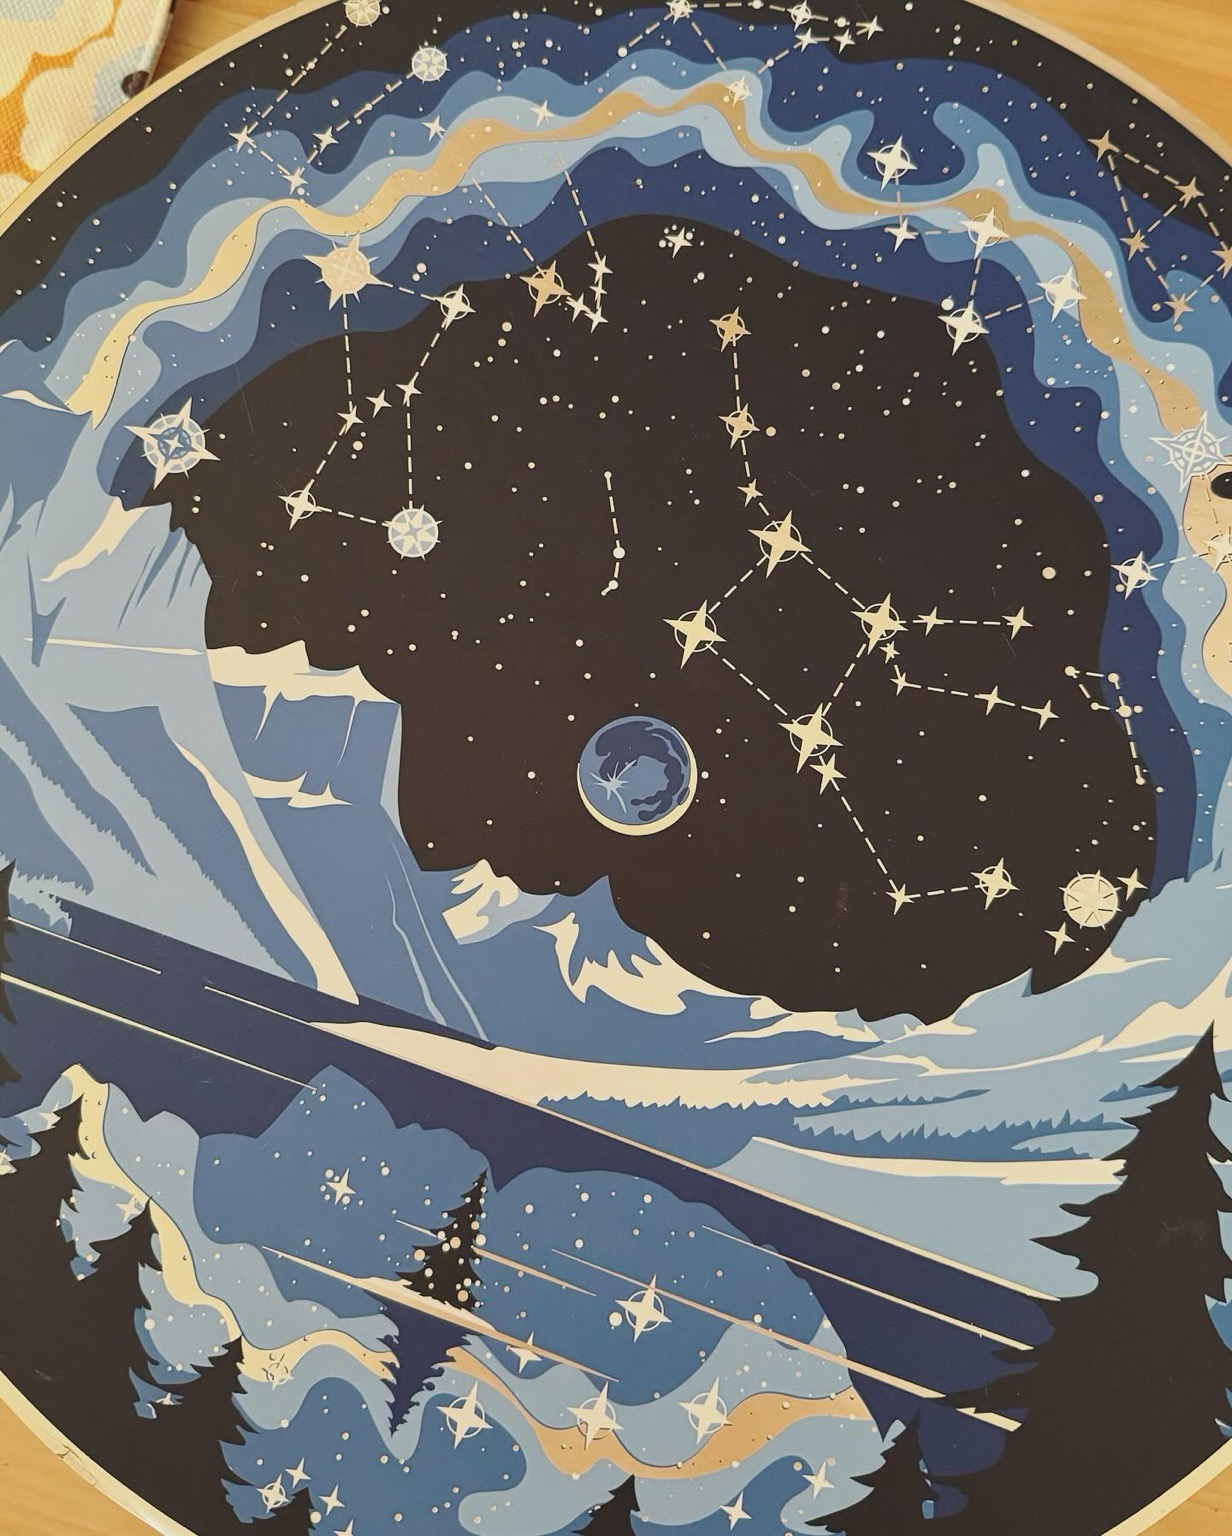
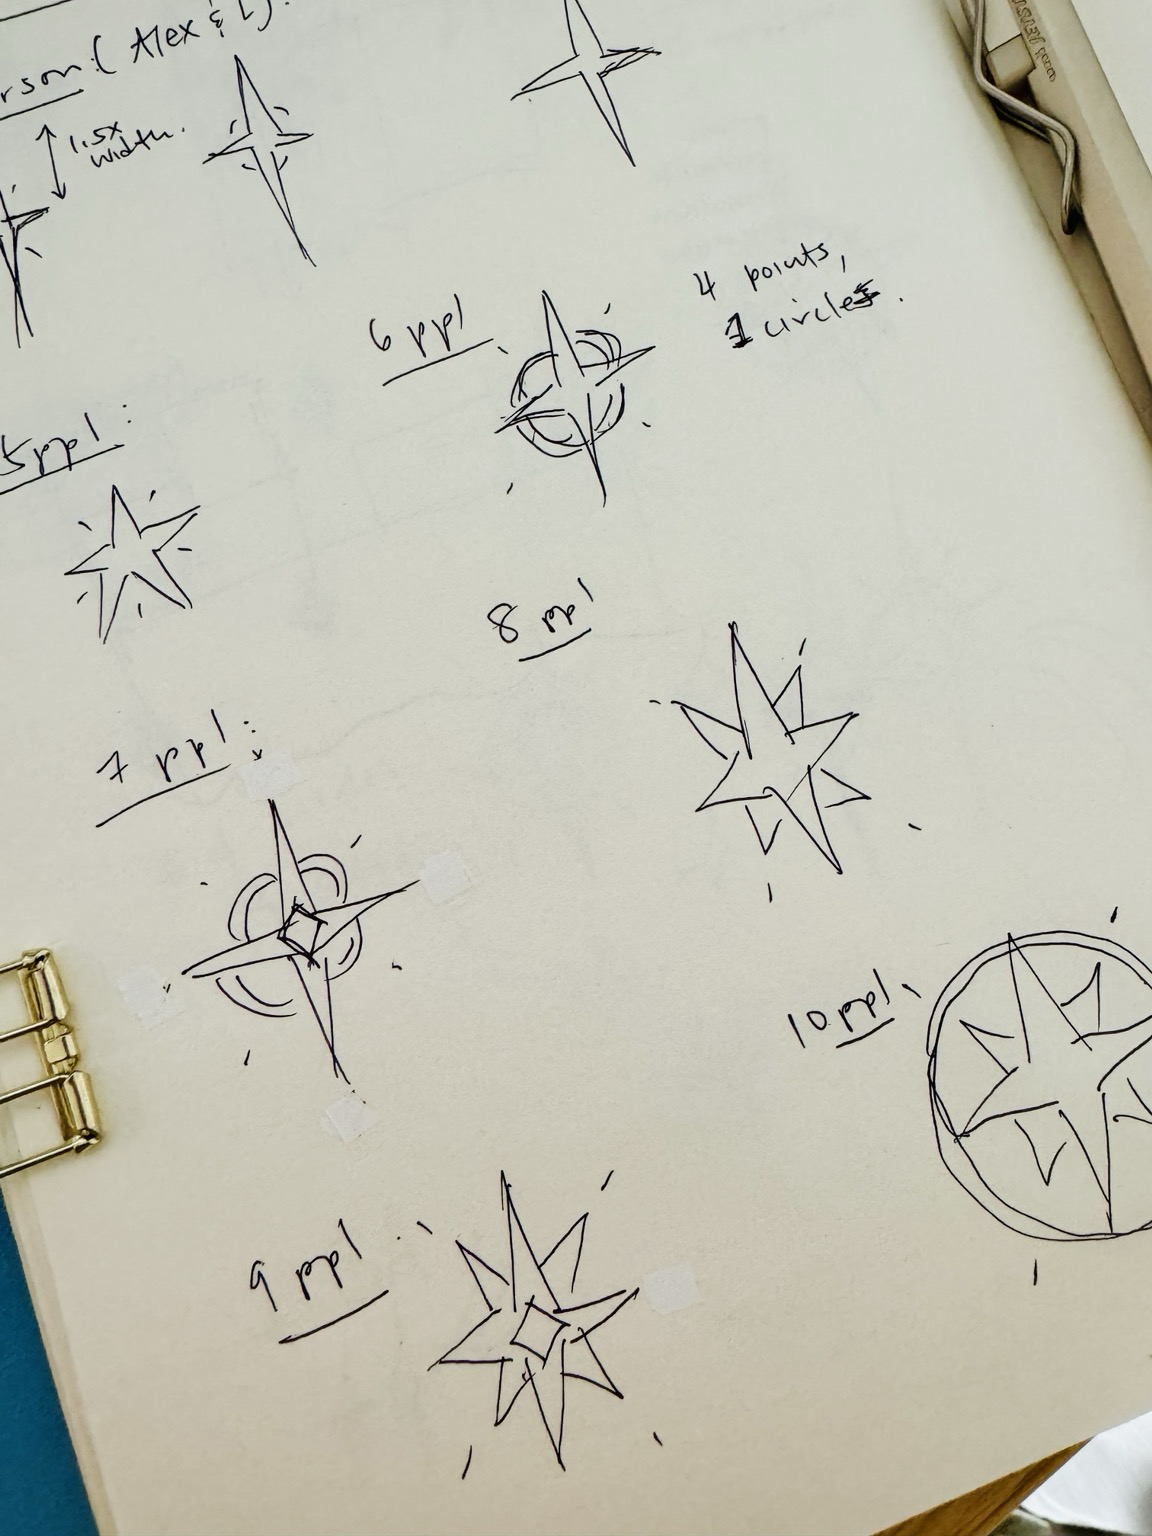
a little something in the works that I’m really excited for ✨
@GuillaumeRossolini ok after a few more days of using svelte i'm starting to see how i can use it for blog instead this is very appealing
@michaelslade thank you! going to try and get better with mastodon again (I'm also trying out bluesky at the same time)
(omg who wrote these tutorial examples some of them the snark—amaaaaaaaazing hahahahaha)
@GuillaumeRossolini noooo this is for a client, but could potentially eventually be a blog revival! though actually the blog will probably still use eleventy now i think about it......
also hi guillaume!!!
impression so far: a lot of concepts feel very similar to vue (have no idea what react looks like these days lol) but with a lot less code/structure overhead—which I appreciate~
@mikebrondbjerg *high five*
@jeffpalmer @wattenberger @puddingviz oooh good to hear!
hello happy (belated) new year! I've been wanting to learn #svelte for a while and figured today is as good a day as any and I'm already so delighting in their tutorial it's so good 😊
can't wait to figure out all the hype I've heard from @wattenberger + @puddingviz 💖
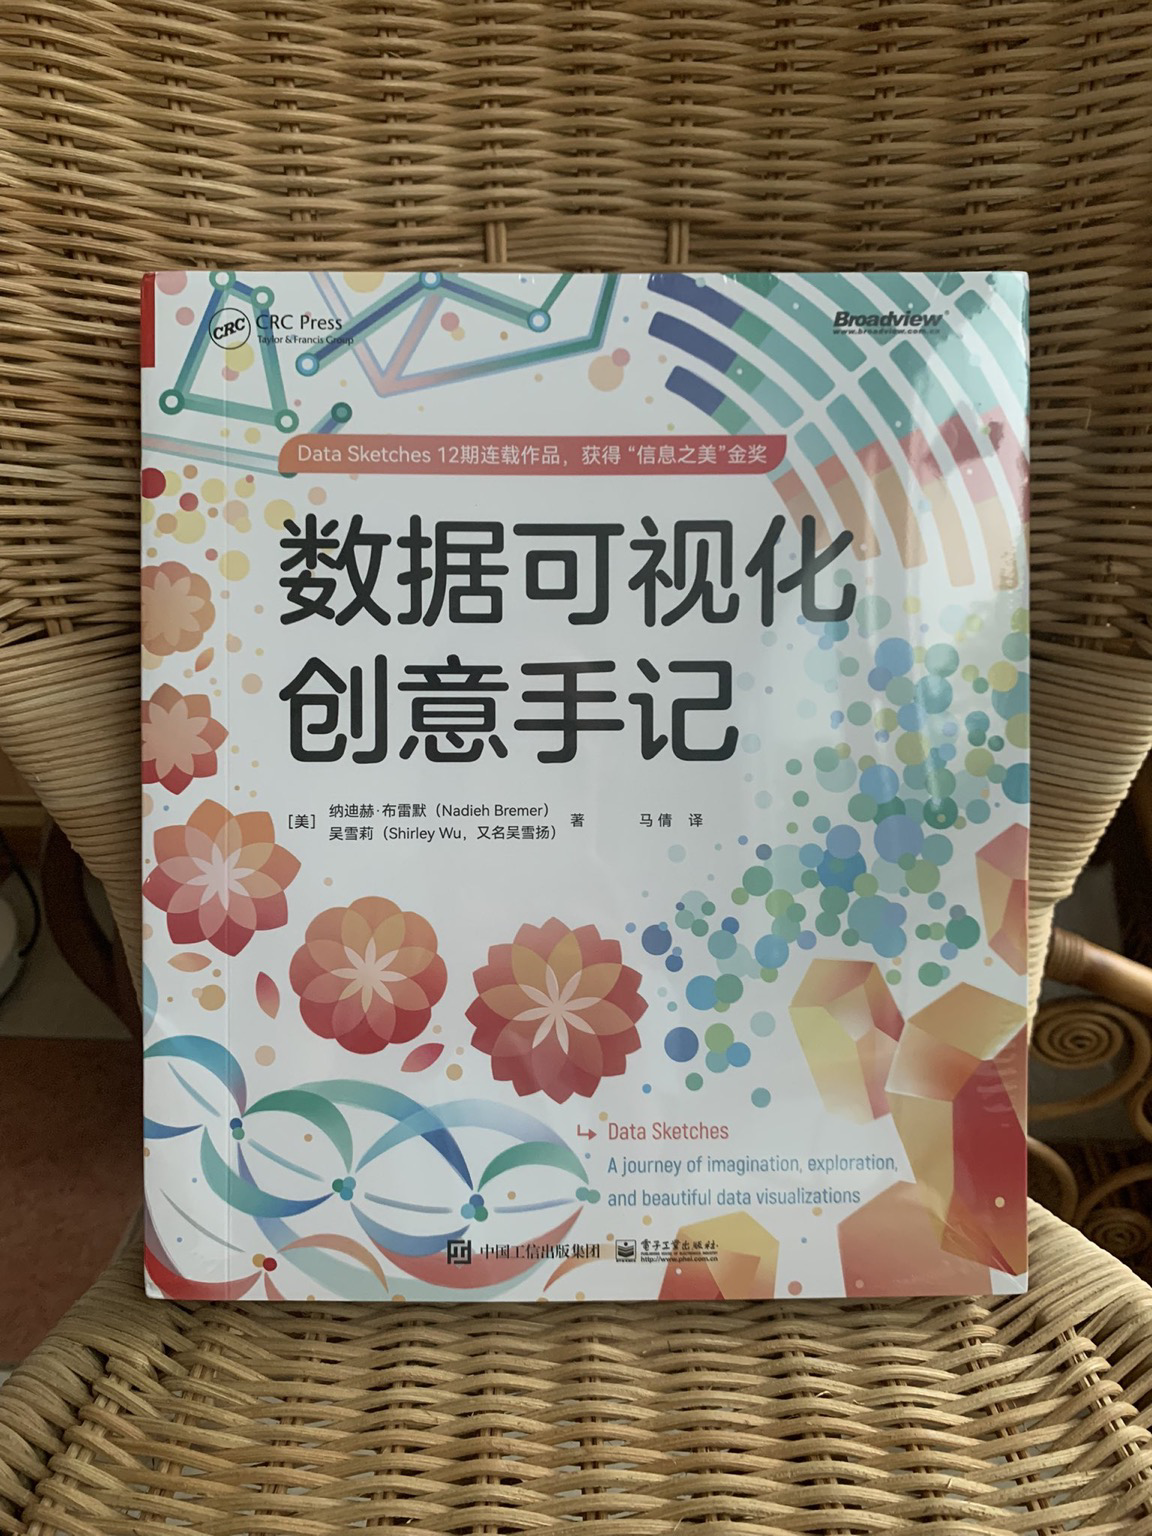
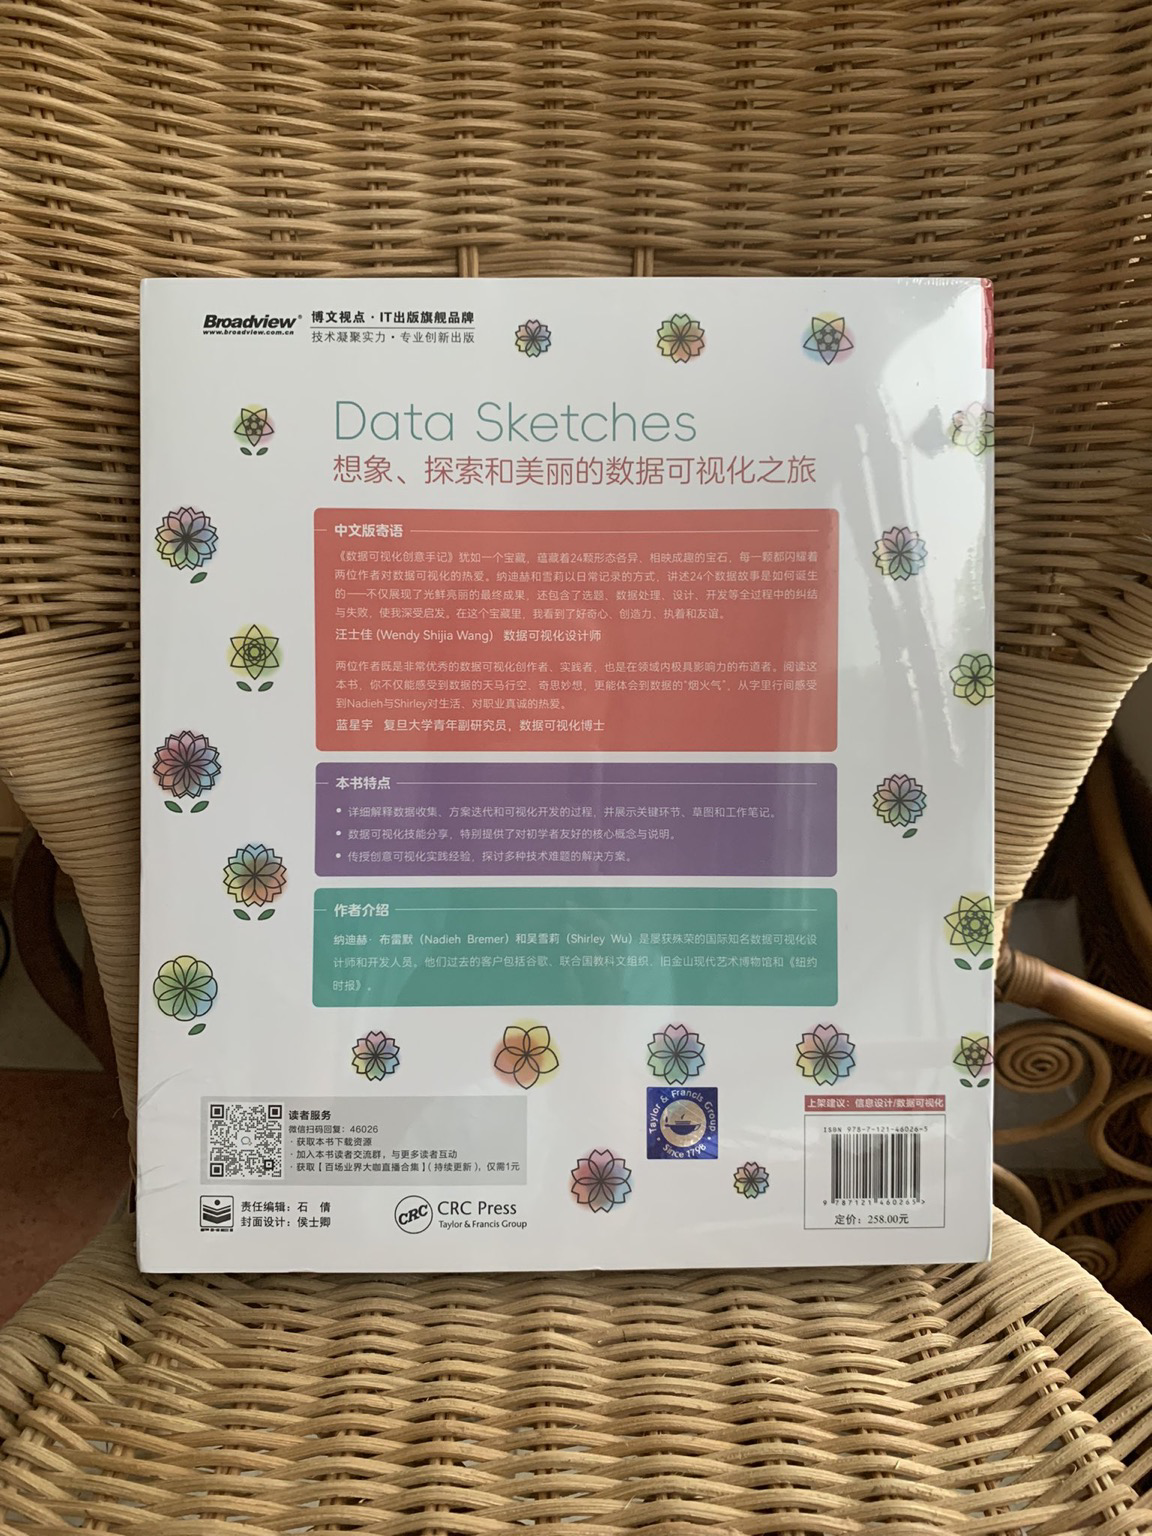
🎊 OMG IT’S HAPPENING 🎊
I’ve been waiting on the edge of my seat for this Chinese translation of @NadiehBremer & I’s Data Sketches book bc it means my grandparents can read it and that means the world to me 🥺
tysm @EMorsia at @CRCPress & Catherine Qian Ma for translating 💖
Shirley Wu boosted:
if you and your organization need any help with data visualizations, data physicalizations, or creative technology work I’m opening up my October and November and I’d love to work with you!
— @shirley
https://shirleywu.substack.com/p/a-balance-of-client-and-art-work
Shirley Wu boosted:
Awesome collection of free infographics/dataviz chapters from the newest books in the AK Peters Visualization series. Including work from Making with Data, @shirley and @nadieh, @ChristiansenJen, @nigelblue, and @theneilrichards https://www.routledge.com/go/data-visualization-freebook
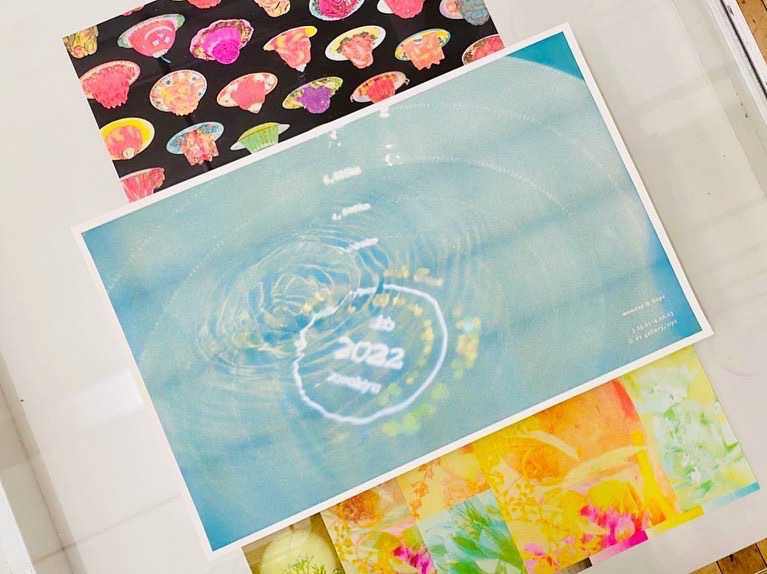
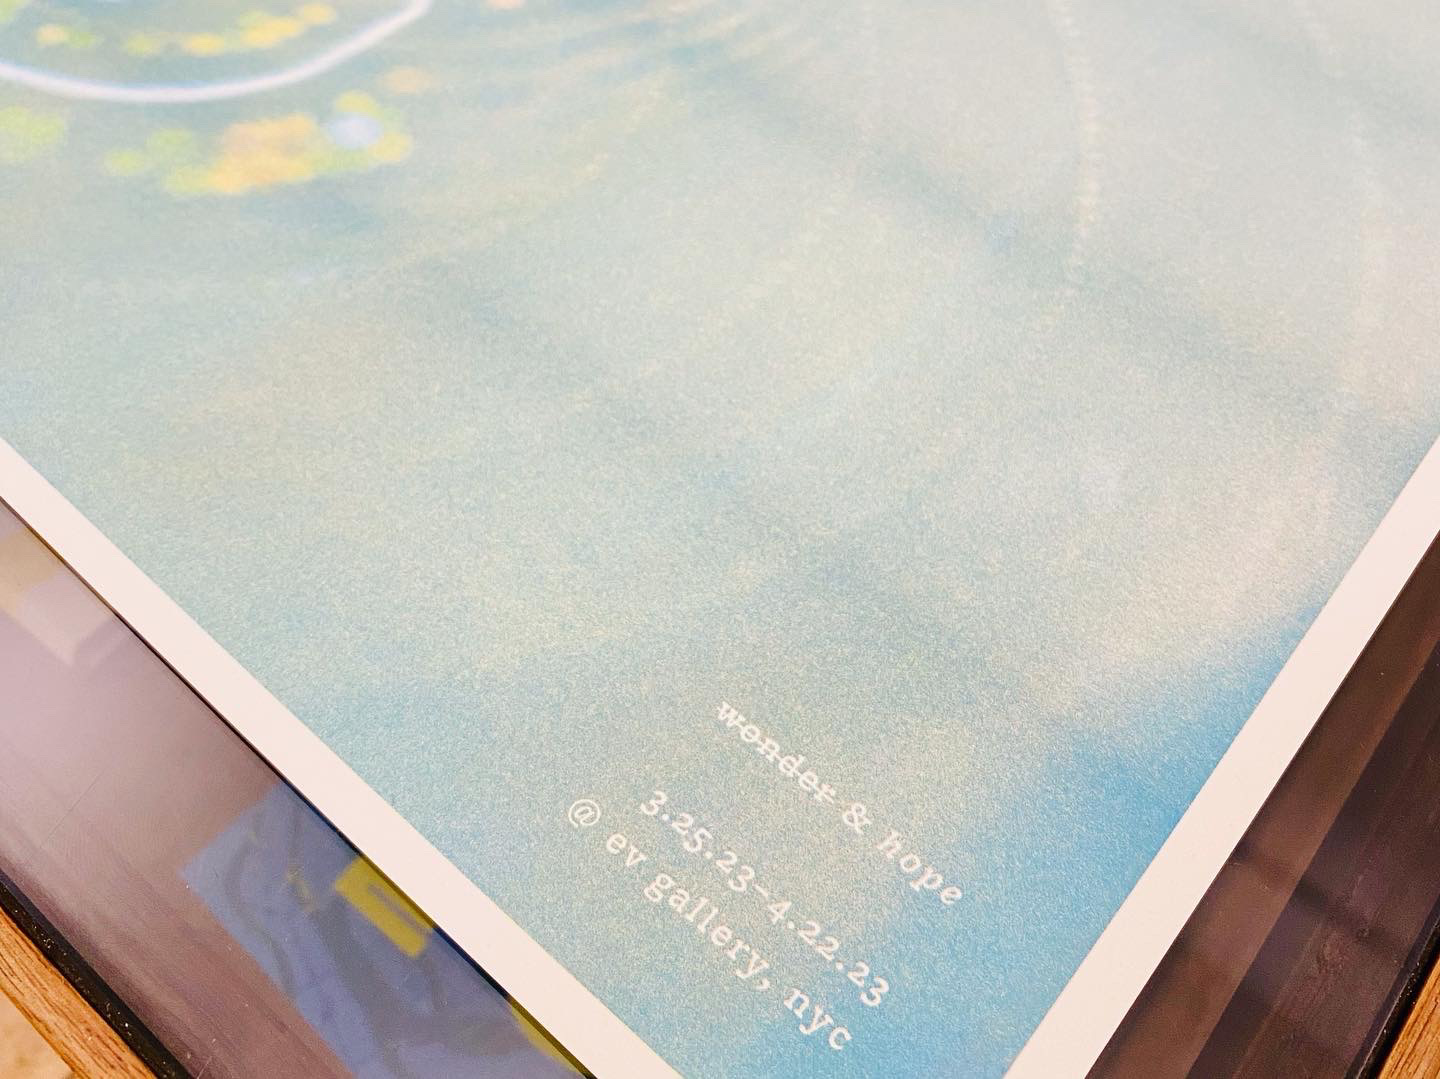
I made limited-edition riso prints to celebrate my first ever MONTH LONG SOLO SHOW AHH 🥳 they’ll be signed & on sale at the opening this weekend 💖
📅 sat 3/25 6-9pm
📍 ev gallery, 621 east 11th st, nyc
📷 original photo by tuan-h.com
🖨️ printed by luckyrisograph.press
see you there 👋??!!
@artcollisions yes thank you for the reminder!
and that’s a wrap on day 2 of @dataxdesign install! tomorrow is finishing touches before show opens AHHHH 😮
come join us & see some super cool #dataviz w/ nyc open data ✨
📆opening fri 3/10 6–8:30pm
✨running 3/11-19 12-7pm
👩🏻🎨artist panel 3/19
📍@primeproduce, hell’s kitchen
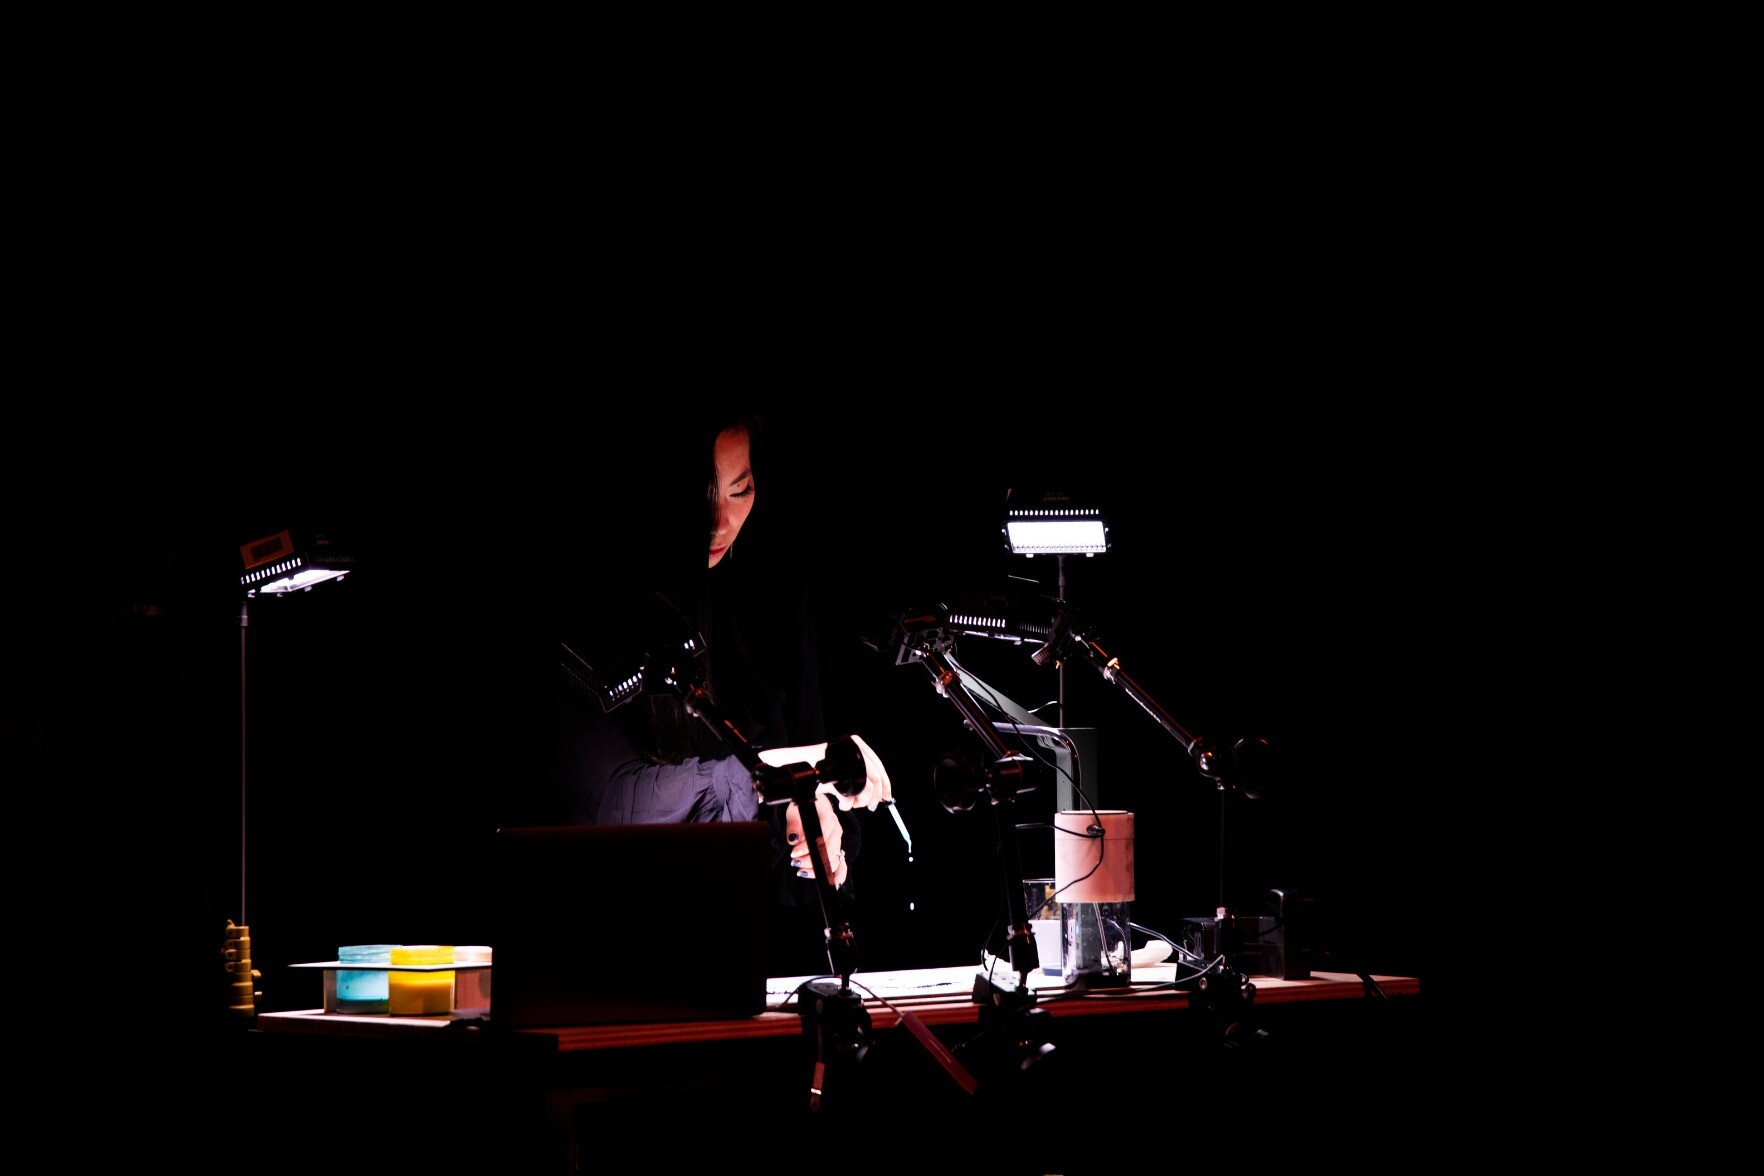
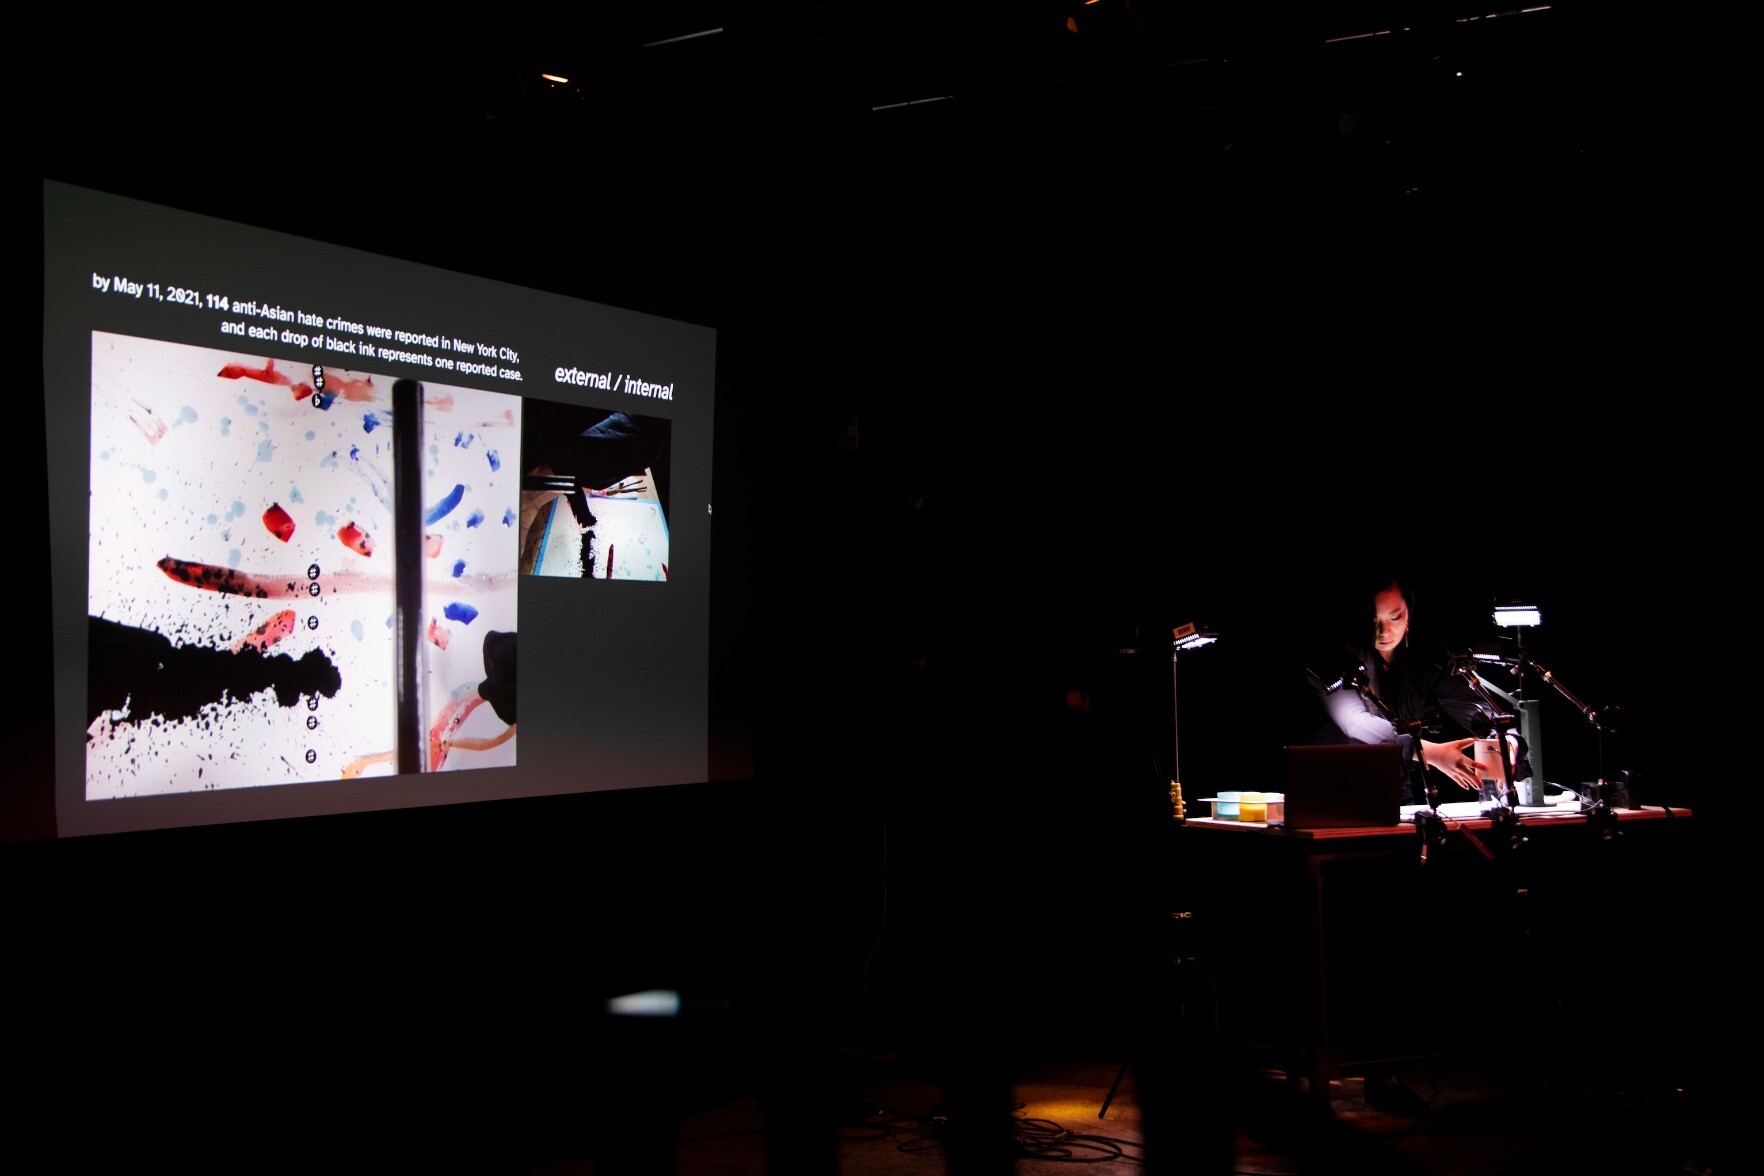
external / internal is a two-part musical interface: a data-driven pump that drips Chinese calligraphy ink according to anti-Asian hate crime cases, and code that reads painted colors and transforms them into sound. Performing with the instrument is intimate, introspective, chaotic, and emotional—and as the black ink takes over the paper, it encourages a relinquishing of control and an acceptance. It is a story told through colors and sound
🎥 for the full performance: https://youtu.be/n2jbzoM7gpw
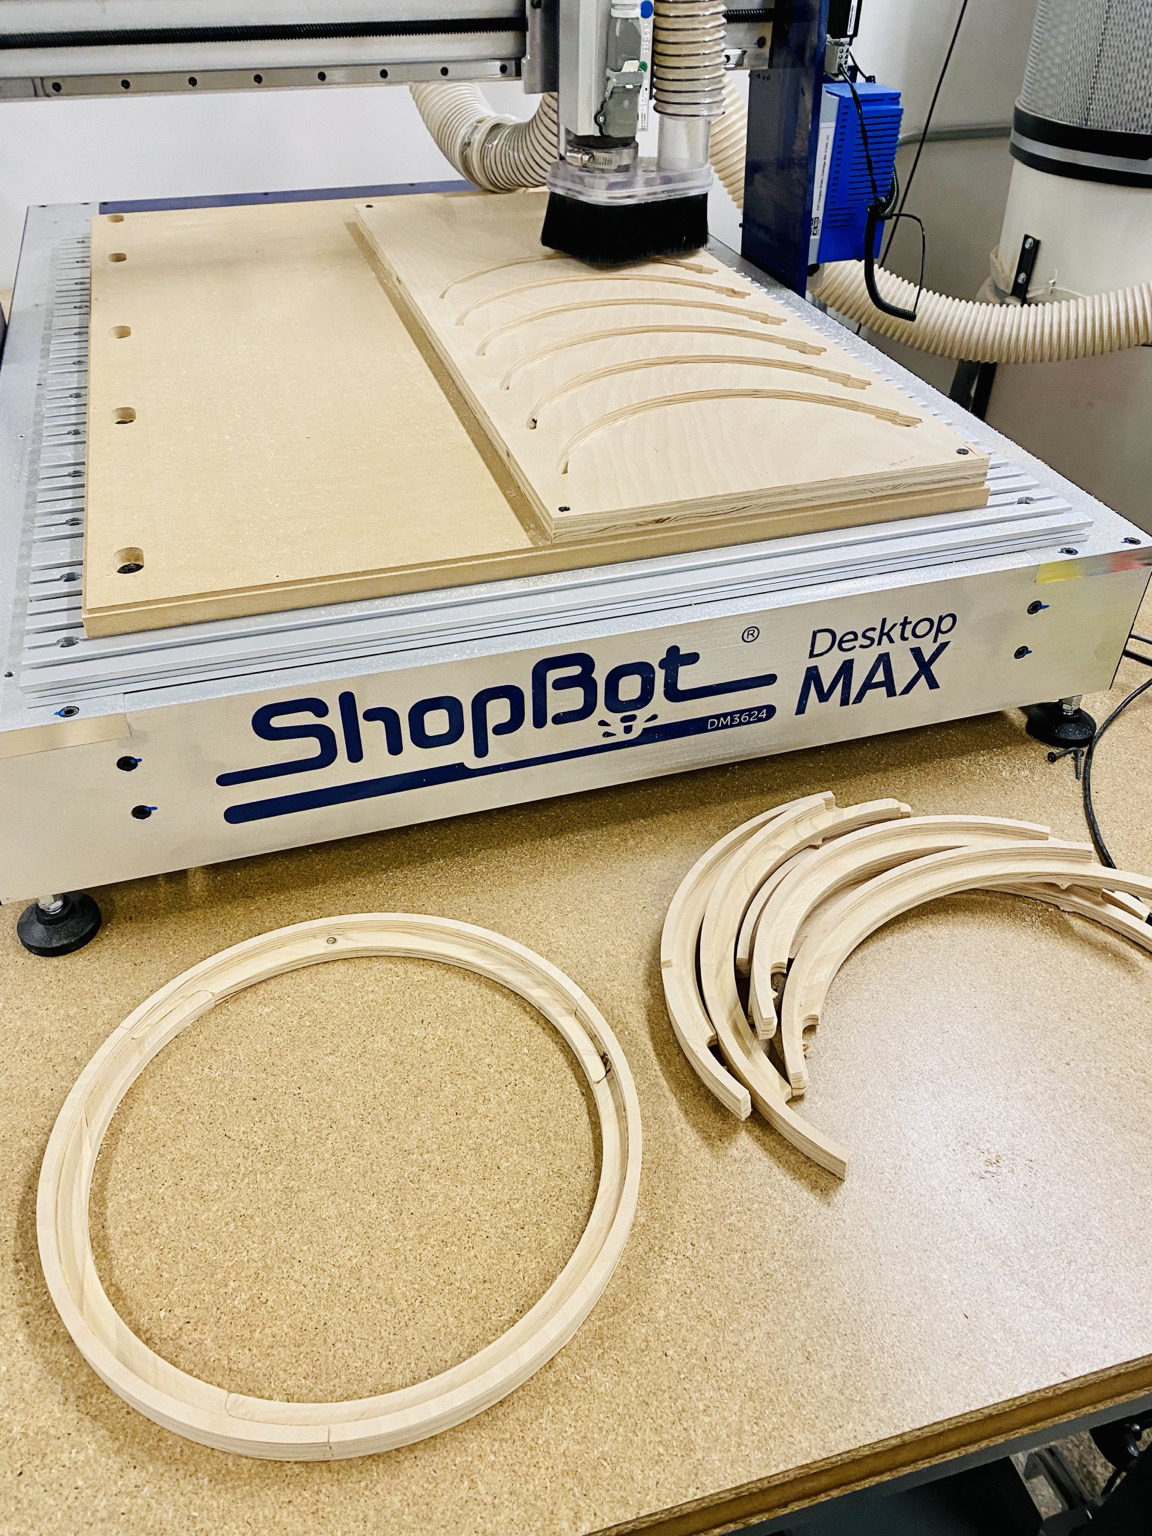
like some *seriously* stressful times when the CNC skipped *again* and started cutting where it wasn’t supposed to 😭
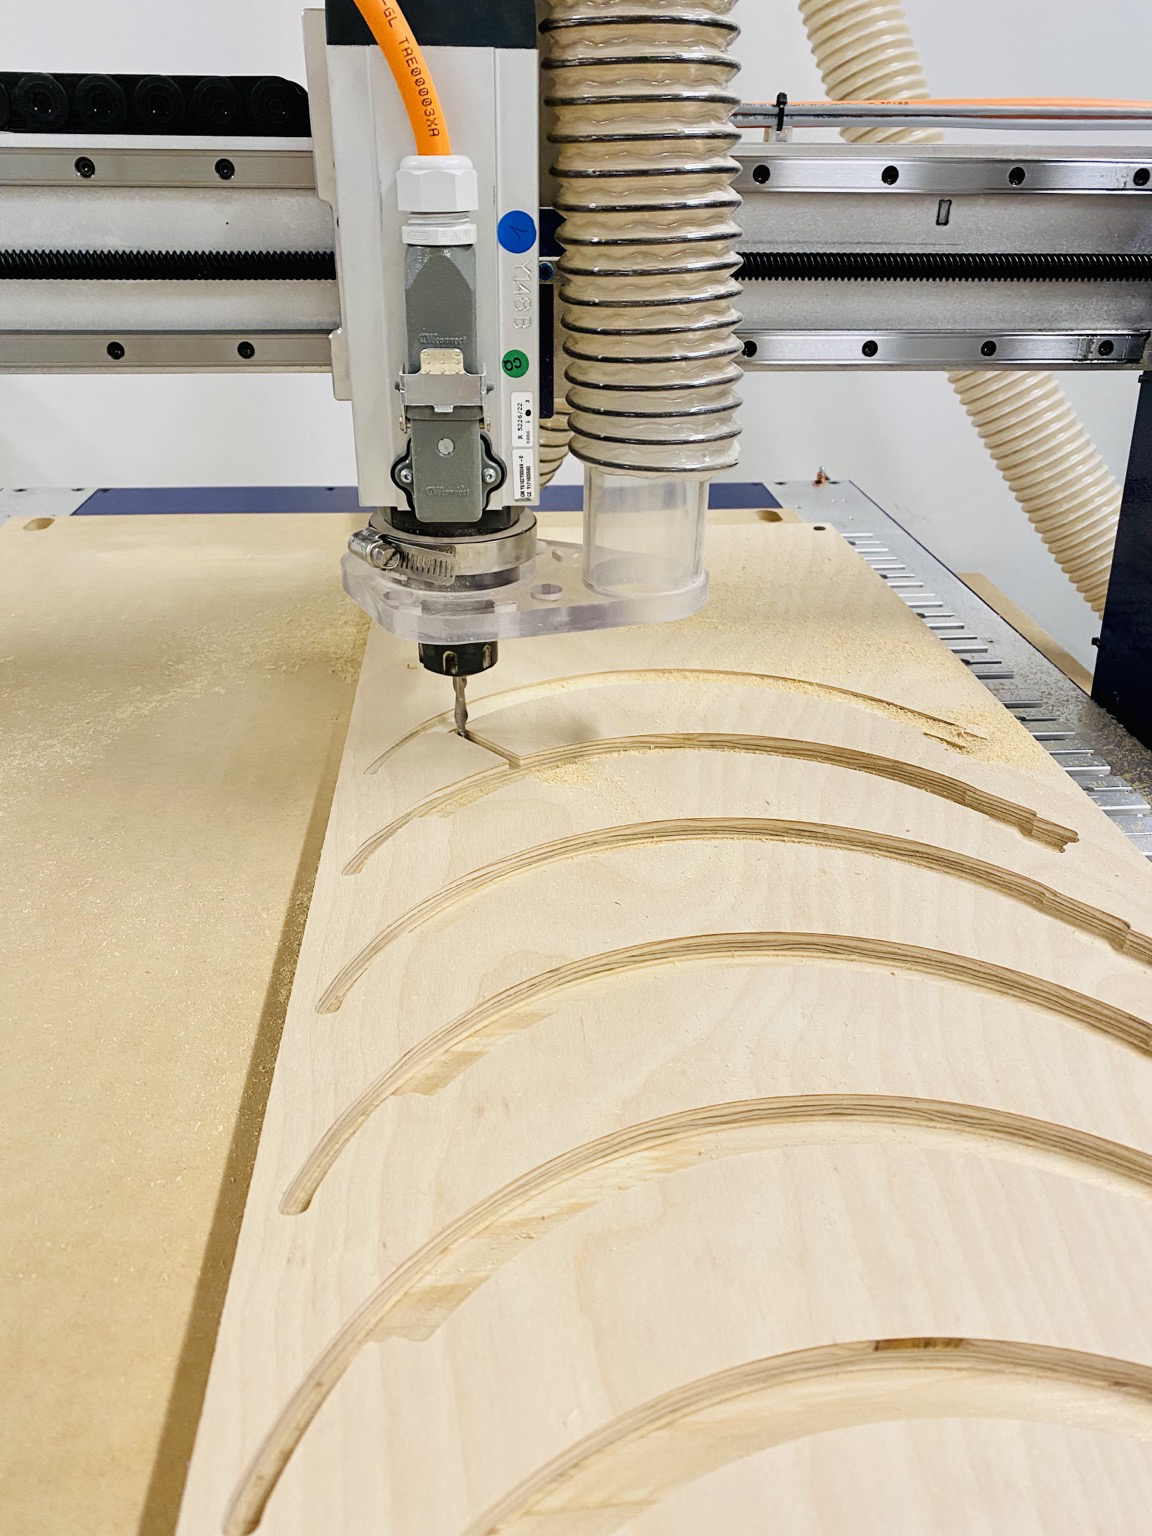
today’s show progress is day 2 on the CNC and after some really stressful times I finally have some satisfying circle frames being cut out for me! can’t wait to put my #dataviz in these huhuhu 🥰
@codeddragon2023 @shiffman @observablehq that was exactly my struggle and why I decided to just take the class!
Client Info
Server: https://mastodon.social
Version: 2025.04
Repository: https://github.com/cyevgeniy/lmst