#RESIDENTIAL

Apostolos Klitsoyiannisapostolos_kl
2025-06-14

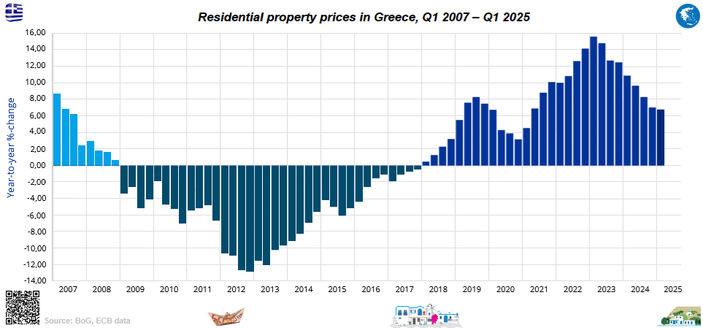
Οι τιμές από τα οικιστικά ακίνητα στην Ελλάδα από το 1ο τρίμηνο του 2007 στο 1ο τρίμηνο του 2025

Housing prices in Greece from Q1 2007 to Q1 2025 (q/q)

Γράφημα με στήλες: Οι τιμές από τα οικιστικά ακίνητα στην Ελλάδα από το 1ο τρίμηνο του 2007 στο πρώτο τρίμηνο του 2025 / σε ποσοστό, τριμηνιαία μεταβολή / πηγή: ΤτΕ, ΕΚΤ data

Bar chart: Housing prices in Greece Q1 2007 - Q1 2025 (q/q) / in percent, quarterly changes / source: BoG ECB data
Apostolos Klitsoyiannisapostolos_kl
2025-06-13

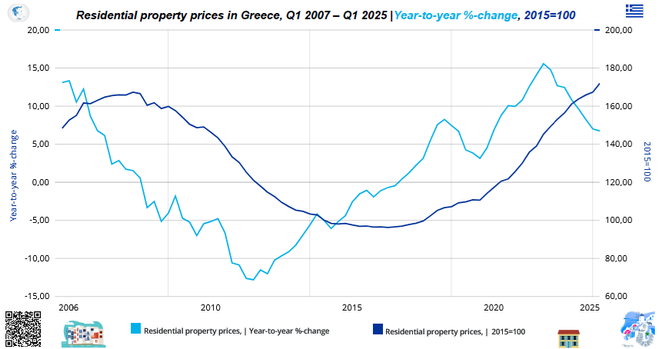
Οι τιμές των σπιτιών στην Ελλάδα από το 1ο τρίμηνο του 2006 έως το 1ο τρίμηνο του 2025

Residential real estate prices in Greece from Q1 2006 to Q1 2025

Γράφημα με γραμμές Οι τιμές των σπιτιών στην Ελλάδα από το 1ο τρίμηνο του 2006 έως το 1ο τρίμηνο του 2025 / σε δείκτη και ποσοστό , τριμηνιαία μεταβολή / πηγή: ΤτΕ 

Residential real estate prices in Greece from Q1 2006 to Q1 2025 / in index and percent, quarterly changes/ source: BoG
Apostolos Klitsoyiannisapostolos_kl
2025-06-12

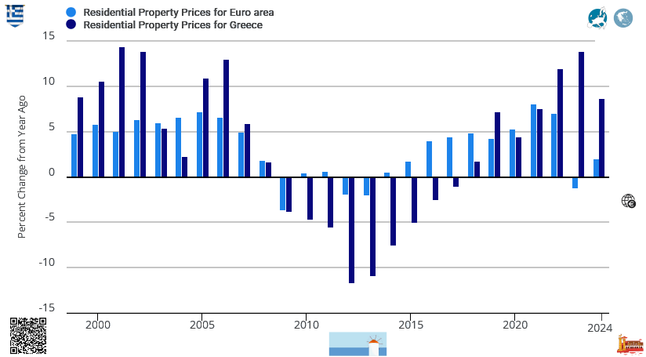
Οι τιμές των κατοικιών στην Ευρωζώνη, και την Ελλάδα, από το 1999 στο 2024

Residential property prices in Greece and the Euro area, 1999 - 2024

Bar graph: Residential property prices in Greece and the Euro Area, 1999 - 2024 / in percent, annual changes / sources Eurostat, BoG, FRED

Γραφικό με στήλες : Οι τιμές των κατοικιών στην Ευρωζώνη, και στην Ελλάδα, από το 1999 στο 2024 / σε ποσοστό, ετήσια μεταβολή / πηγή Τράπεζα της Ελλάδος (ΤτΕ), Eurostat, FRED
Apostolos Klitsoyiannisapostolos_kl
2025-06-11

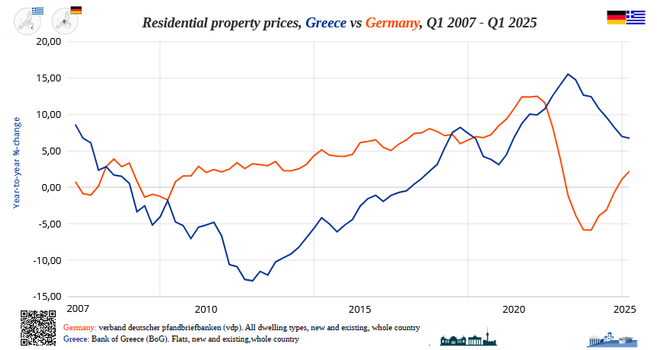
Τιμές κατοικιών για την Ελλάδα και την Γερμανία από το 2007 στο 1ο τρίμηνο του 2025

Residential property prices for Greece and Germany from 2007 to Q1 of 2025

Wohnimmobilienpreise für Griechenland und Deutschland 2007 – Q1 2025

Γράφημα με γραμμές, Τιμές κατοικιών για την Ελλάδα και την Γερμανία από το 2007 στο 1ο τρίμηνο του 2025 / σε ποσοστό, τριμηνιαία μεταβολή / πηγή ΕΚΤ data

Line chart: Residential property prices for Greece and Germany from 2007 to Q1 of 2025 / in percent, quarterly changes / source ECB data

Liniendiagramm: Wohnimmobilienpreise für Griechenland und Deutschland von 2007 bis Q1 2025 / in Prozent, vierteljährliche Veränderungen / Quelle: EZB-Daten
Apostolos Klitsoyiannisapostolos_kl
2025-06-10

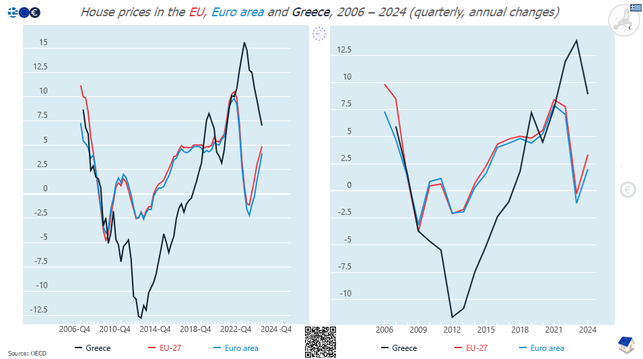
Ελλάδα vs ΕΕ vs Ευρωζώνη: Τιμές κατοικιών από το 2006 στο 2024

Greece vs EU vs Euro area: House prices, from 2006 to 2024

Line graph: Greece vs EU vs Euro area: House Prices, from 2006 to 2024 / in percent, quarterly annual changes / source OECD

Γραφικό με γραμμές: Ελλάδα vs ΕΕ vs Ευρωζώνη: Τιμές κατοικιών από το 2006 στο 2024  / σε ποσοστό, τριμηνιαία, ετήσια μεταβολή / πηγή ΟΟΣΑ
2025-06-09

Check out the stunning, luxurious crafted by the Gulshan Group along the Noida Expressway. This group has a solid track record of delivering top-notch and commercial in Noida, all conveniently located near the expressway.
Visit: gulshangroup.com/apartments-in

Gulshan Botnia
CodeFreezR (he/him)CodeFreezR@chaos.social
2025-06-08

Nach #IoT & #EMS legt die Forschungsgruppe FOSSEA³M nun ihr #ESTa 2.0 vor. ESTa was?

E:nergiewirtschaftliche
S:egment
Ta:xonomie

Angefangen mit den drei Ebenen

#Verteilnetz (Distribution)
Versorgung (#UtilityCase)
#Transportnetz (Transmision)

über eine profunde Marktsegmentierung mit

#Prosumer
#Residential
C&I
Utilty Scale
#GridScale

und einem Überblick der Monetarisierung:

#EPEX
#EEX
#OTC
#Redispatch
#PPA
#VPP

Hier wirds erklärt:

y.lab.nrw/esta2

\__
#fosseam #energiewende

Cover für ESTa 2.0

Energiewissenschaftliche
Segment Taxonomie.
Ian Kluft :verified:✈️🎈🌋ikluft@avgeek.social
2025-06-07

"Neighbor-Source Heat Pump" by XKCD comic (Fediverse mirror bots @xkcd @xkcdbot ) - One of many examples of failure to be a good neighbor. If taken to its extreme without being discovered and shut down first, it falls apart like a Ponzi scheme long before everyone gets to tap everyone else. After a loop forms, they all ask "why isn't it working any more?" xkcd.com/3099/ #residential #physics #oops #WTF

XKCD comic #3099 "Neighbor-Source Heat Pump" https://xkcd.com/3099/

Explanation from ExplainXKCD https://www.explainxkcd.com/wiki/index.php/3099:_Neighbor-Source_Heat_Pump

transcript:
[Two houses are shown next to each other. [...] next to the left house there is a small box with two light-blue pipes going from the house to the box. From the bottom of the box two similar light-blue pipes goes a bit down under ground, the left further than the right, and then they bend to the right and goes under the neighboring house to the right. The upper pipe closest to the ground is shown to enter the wall of the right house, going almost up to the roof, and then bending sharply around going down below ground. Then it goes under ground to the other side of the house and do the same in the right wall, going up and down. Where it goes under ground, it connects to the the other pipe that has gone all the way straight under the house.]

[Caption below:]
A covertly-installed Neighbor-Source Heat Pump takes advantage of the fact that your neighbor keeps their house cool in the summer and warm in the winter.

mouseover text: The installation of the pipes on the inside of the insulation can be challenging, especially when the neighbor could come home at any minute.

explanation:
"Neighborhood heating" is a system where a centralized heat source provides heating for multiple buildings. This is humorously in contrast to to the comic where someone steals heat from one of their neighbours.[...]
Apostolos Klitsoyiannisapostolos_kl
2025-06-05

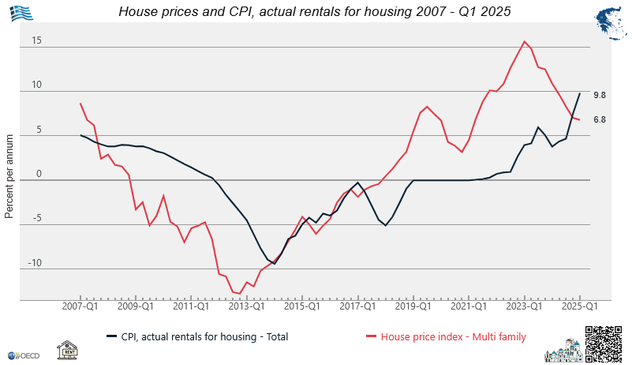
Ελλάδα: Τιμές και ενοίκια των κατοικιών 2007 - 1ο τρίμηνο του 2025 (Δείκτης Τιμών Καταναλωτή - ΔΤΚ)

Greece: House prices and CPI, actual rentals for housing 2007 - Q1 2025

Γράφημα με γραμμές, Ελλάδα: Τιμές και ενοίκια των κατοικιών 2007 - 1ο τρίμηνο του 2025 (Δείκτης Τιμών Καταναλωτή – ΔΤΚ) / ποσοστό ετησίως, ρυθμός ανάπτυξης, άνω του 1 έτους / πηγή, Eurostat, ΤτΕ, OECD 

Line chart, Greece: House prices and CPI, actual rentals for housing 2007 - Q1 2025 / percent per annum, growth rate, over 1 year / source, Eurostat, BoG, OECD
Apostolos Klitsoyiannisapostolos_kl
2025-06-05

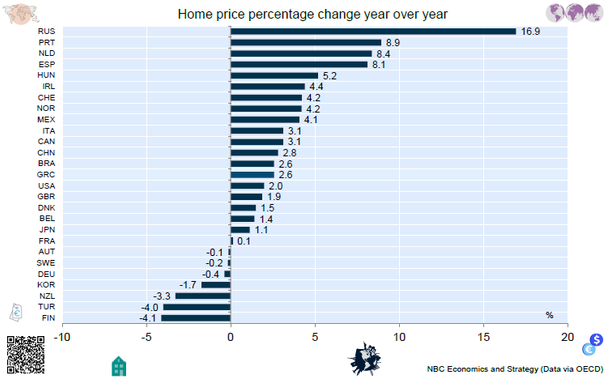
House prices in selected countries worldwide in Q4 2024
Perspective on home price inflation

Τιμές κατοικιών σε επιλεγμένες χώρες, σε παγκόσμιο επίπεδο, το 4ο τρίμηνο του 2024

Γράφημα με οριζόντιες στήλες: Τιμές κατοικιών σε επιλεγμένες χώρες σε παγκόσμιο επίπεδο το 4ο τρίμηνο του 2024 συμπεριλαμβανόμενων και επιλεγμένων χωρών της ΕΕ και της Ελλάδας / σε ποσοστό, τριμηνιαία μεταβολή / πηγή NBF, OECD

Horizontal bar chart: House prices in selected countries worldwide in Q4 2024  / in percent, quarterly changes / sources NBF, OECD
Apostolos Klitsoyiannisapostolos_kl
2025-06-04

Οι τιμές των κατοικιών στην Ελλάδα την Αθήνα και την Θεσσαλονίκη από το 2007 στο 1ο τρίμηνο του 2025

House prices in Greece, Athens and Thessaloniki from Q1 2007 to Q1 2025

Line chart: House prices in Greece, Athens and Thessaloniki from Q1 2007 to Q1 2025   / percent, quarterly changes / source: BoG OECD

Γραφικό με γραμμές: Οι τιμές των κατοικιών στην Ελλάδα την Αθήνα και την Θεσσαλονίκη από το 2007 στο 1ο τρίμηνο του 2025 / σε ποσοστό, τριμηνιαία μεταβολή / πηγή: ΤτΕ, ΟΟΣΑ
Apostolos Klitsoyiannisapostolos_kl
2025-06-04

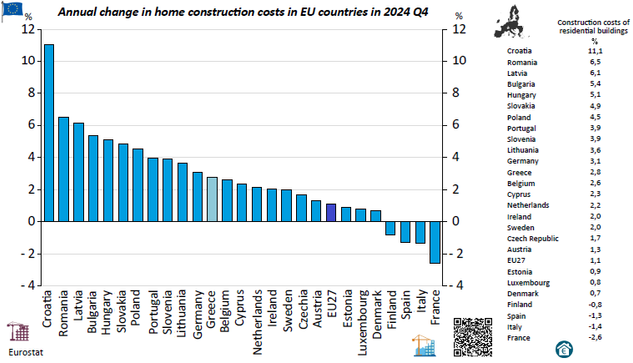
ΕΕ: Ετήσια μεταβολή στο κόστος κατασκευής κατοικιών στο 4ο τρίμηνο του 2024

EU: Annual change in home construction costs in Q4 2024

Γραφικό με στήλες:  ΕΕ: Ετήσια μεταβολή στο κόστος κατασκευής κατοικιών το 4ο τρίμηνο του 2024 / σε ποσοστό, ετήσια μεταβολή / πηγή eurostat

Bar chart: EU: Annual change in home construction costs in EU countries in 2024 Q4 / in percent, annual change / source, eurostat

Client Info

Server: https://mastodon.social
Version: 2025.04
Repository: https://github.com/cyevgeniy/lmst