@itsfoss it used to be xfce (with linux mint), but now it's COSMIC (shipped with Pop!_OS), which is just beautiful with auto tiling of the windows and Fira fonts pre installed

Cartyosh by Georgii Savelev
Maps where possible
First Name
Georgii
Last Name
Savelev
#30DayMapChallenge #Day11
Minimal map
The bridges in St. Petersburg are drawn at night. But the schedule is hard to remember, especially when you aren't a student anymore and find yourself at night on a wrong side occasionally once a year.
The data and my main competitor - https://www.gov.spb.ru/gov/otrasl/tr_infr_kom/grafik-razvodki-mostov/

#30DayMapChallenge #Day10
Air
When people hear, in which part of the city I live, the very first question is - doesn't the wind blow you away, when you go out.
Short answer - no
Long answer - globalwindatlas.info + QGIS

#30DayMapChallenge #Day9
Analog
The Randomland
My favorite genre of mapping as a schoolchild. A way to play with relief - to deform a sheet. Some years after doing this at school, I ended up in geology. Maybe because we work with the models of relief formation.


#30DayMapChallenge #Day8
Urban
Saint Petersburg, Russia. My Centre.
Today I focused on a lightweight, yet informative basemap, which I could use in other projects.
I called it My Center, because there are a lot of opinions what is to be called the centre. This is my view.
Tools - QGIS, QuickOSM
The style is based on the "Urban" style in the QuickOSM preset
Data - ©OpenStreetMap openstreetmap.org/copyright
Source code - https://github.com/SavelevGeo/pop_maps

#30DayMapChallenge #Day7
Accessibility
In Saint Petersburg, Russia, we have a lot of bus routes which have some part of magistral route to get from one part of the city, and other parts to go around the district.
Today I dream, how would I split one of the routes into one magistral and one distict.
Data and basemap - ©OpenStreetMap openstreetmap.org/copyright

#30DayMapChallenge #Day6
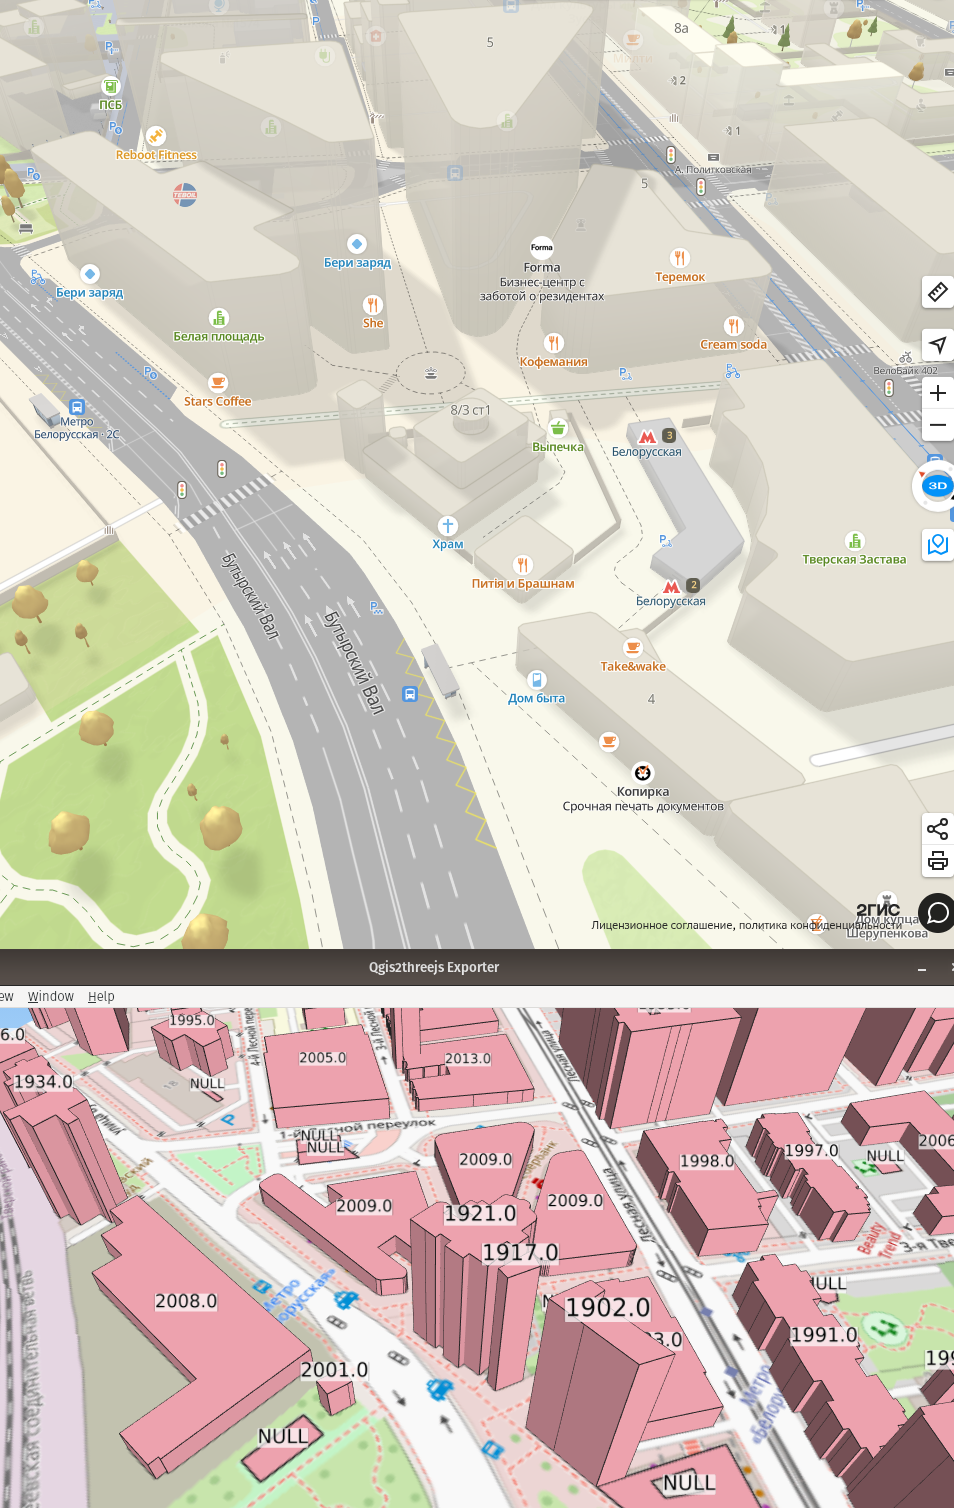
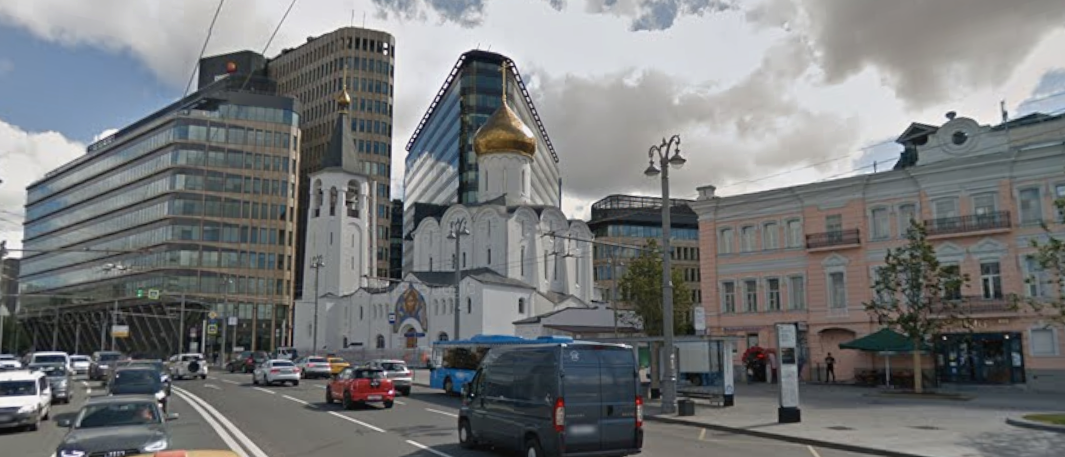
Dimensions.
Let the historical buildings block out the modern ones. Here is a place in Moscow, Russia, where a 20th century church is surrounded by business center. In my view the church is higher, as its height is calculated as 2025-year.
A "classical" 3d map at the top - https://2gis.ru/moscow?m=37.585834%2C55.777821%2F18.87%2Fp%2F47.81%2Fr%2F-53.18&immersive=on
The data about the buildings age - the great and only © how-old-is-this.house, 2024 https://kontikimaps.ru/how-old/cities250/datasets?p=cities250
Photo - google.maps
Tools - qgis2threejs
#30DayMapChallenge #Day5
Earth. Through the Age of Geological Mapping.
Geological maps among many other fields are the most recognizably changed. Below is an approach to illustrate that without a possibility to switch layers on and off.
Tools:
- GDAL (through QGIS) to get a linear gradient using raster distance
Data:
to the right - Touring Club Italiano, CC BY-SA 4.0
to the left - The 1:5 Million International Geological Map (IGME5000)
Source code and links: https://github.com/SavelevGeo/geology_maps

#30DayMapChallenge #Day4
Data: My Data
The photo locations from last two years with z coordinate as the time. You can see how I lived at first in a district closer to the "camera", and then moved to the city to the right and far corner.
The z-coordinate is `(epoch("timestamp") - min_value) * 10^(-7)`, min_value - the minimum of `epoch("timestamp")`
- `adb pull` from android Camera folder
- QGIS to `import `geotagged photos`
- qgis2threejs
Data - My Pixel 8a
Source - https://github.com/SavelevGeo/photo_map

The Urban World
The third attempt to map the inhabited Earth: a map of the world drawn only by the urban areas and their 20 km buffer. Tools - QGIS, Data - naturalearthdata
Source code - https://github.com/SavelevGeo/pop_maps
#30DayMapChallenge #Day3

The Road World
Another attempt to map the inhabited Earth: a map of the world drawn only by the roads. The line width is 20 km - this is what I could walk in taiga expedition in 1-2 days.
Tools - QGIS, Data - naturalearthdata
Source code - https://github.com/SavelevGeo/pop_maps
#30DayMapChallenge #Day2

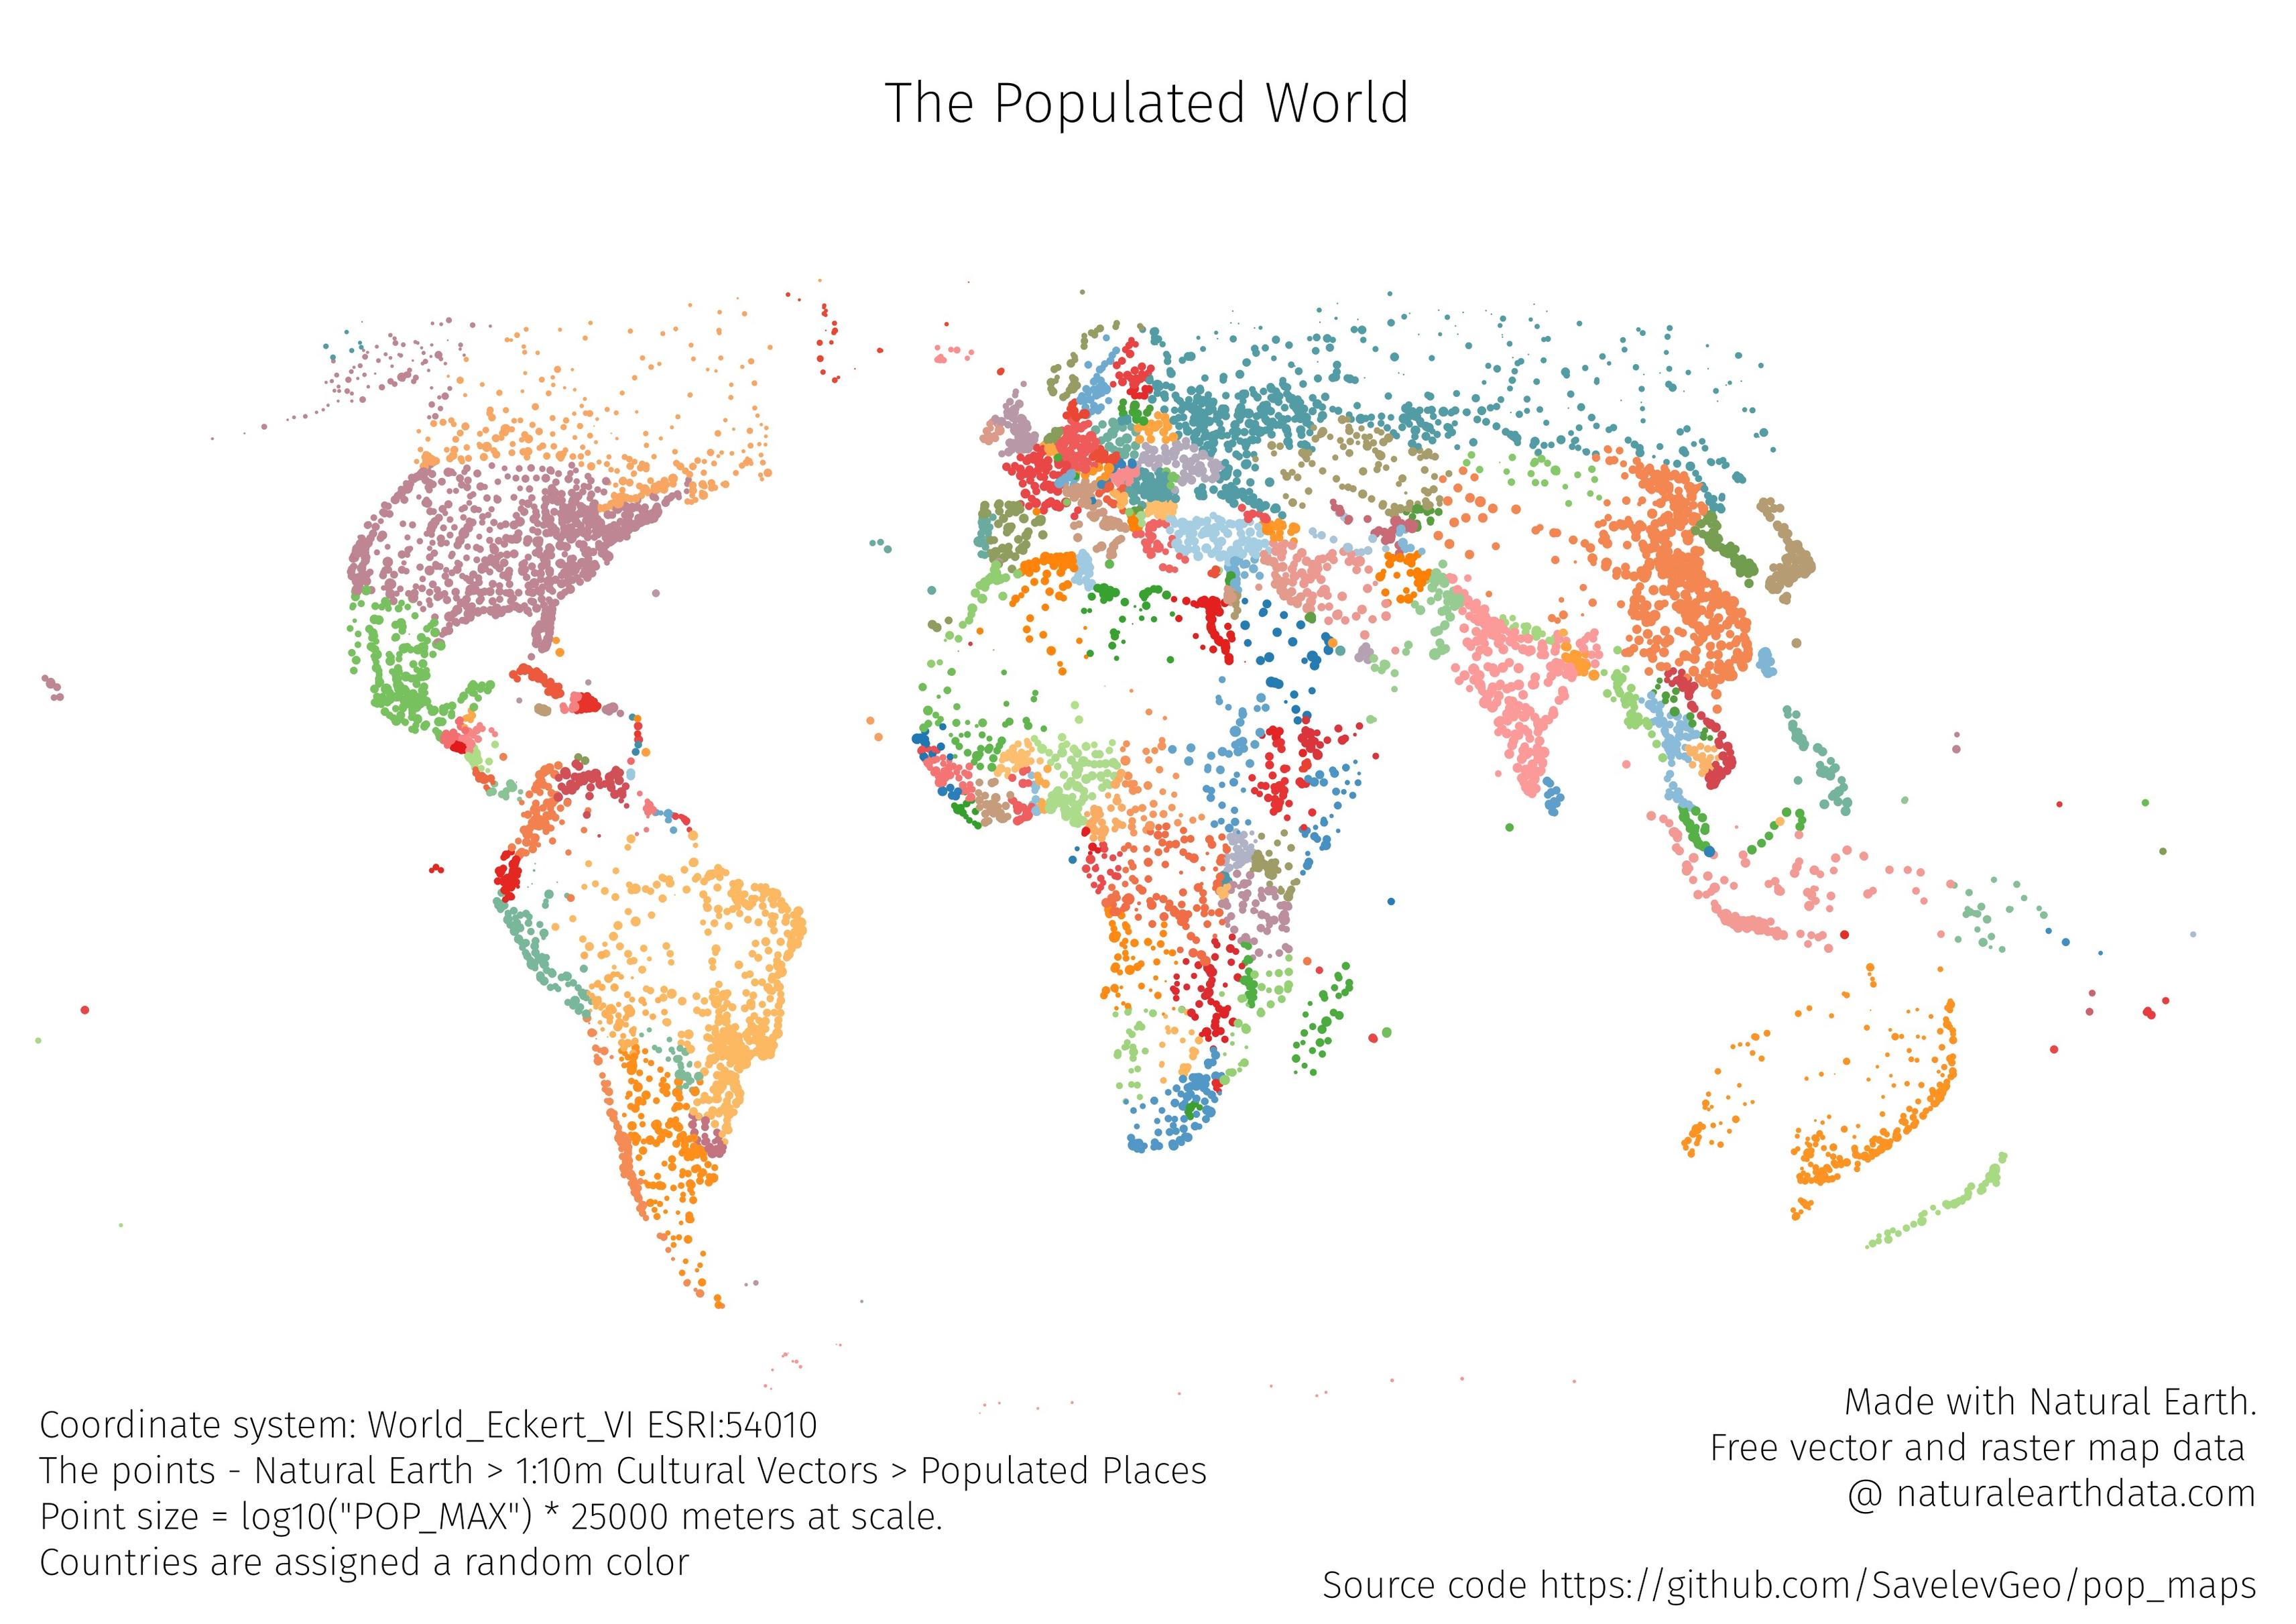
A map of the world drawn only by the points of populated places, colored by the country (color assigned randomly). The size is log10 of the population * 25000
It would be nice to add a sized legend - maybe after the challenge
Tools - QGIS, Data - naturalearthdata
Source code - https://github.com/SavelevGeo/pop_maps
Client Info
Server: https://mastodon.social
Version: 2025.07
Repository: https://github.com/cyevgeniy/lmst