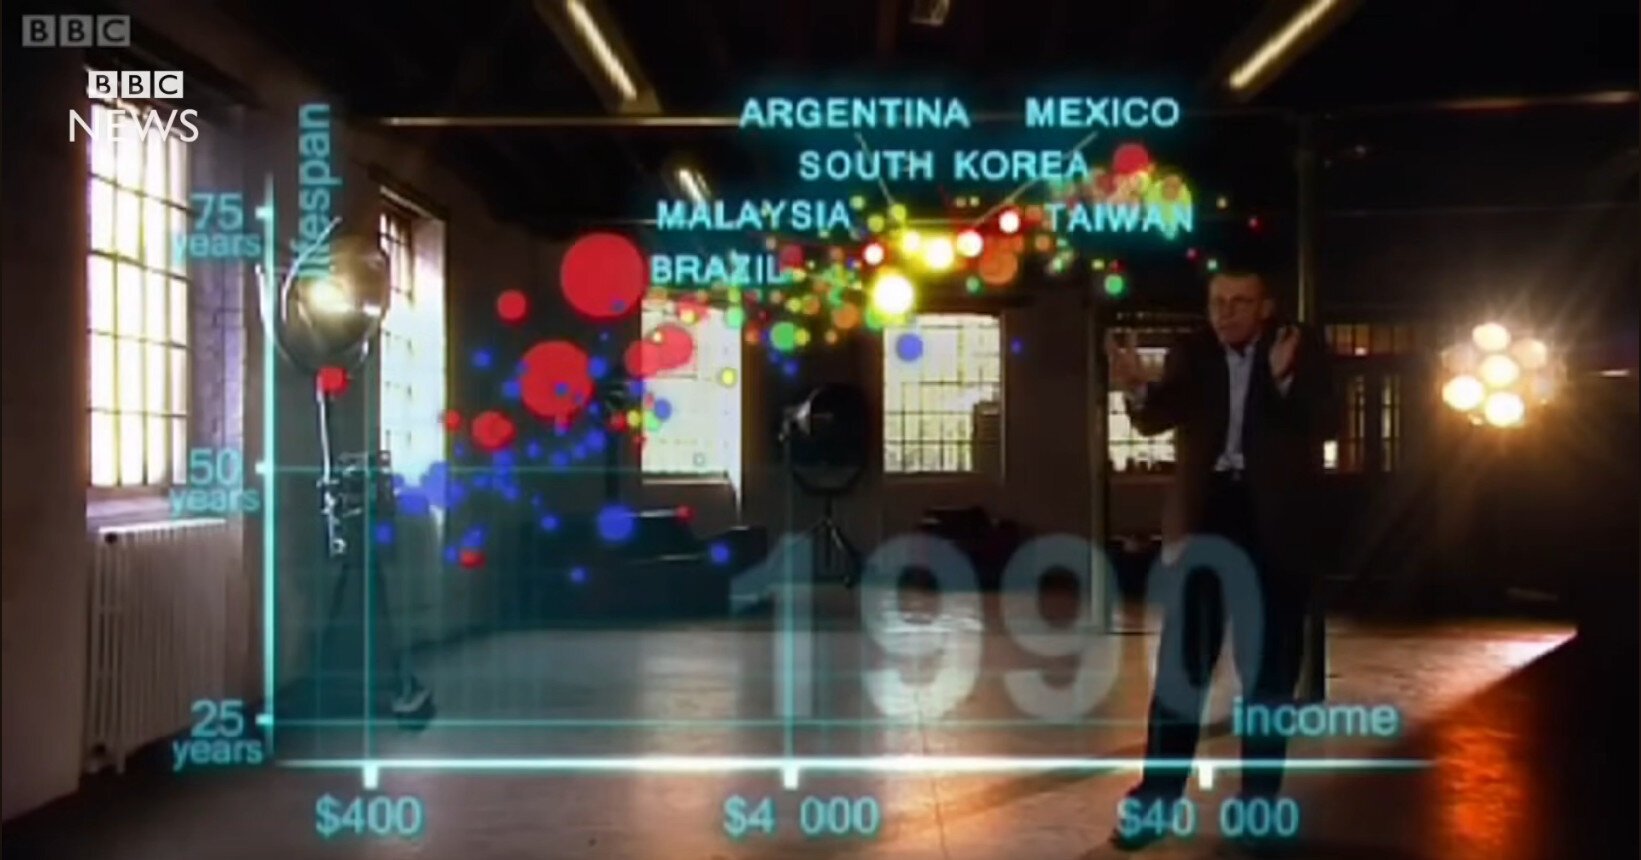
"You can never have enough of Hans Rosling" this is what a work colleague said, and he was right.
His visualisations and communicative skills made one of the greatest #datastories I've ever seen. Sadly, Rosling passed away in 2017, so who knows which incredible data stories we could be hearing and learning from today!
Source: https://www.youtube.com/watch?v=Z8t4k0Q8e8Y
Datasaurus
Datasaurus boosted:
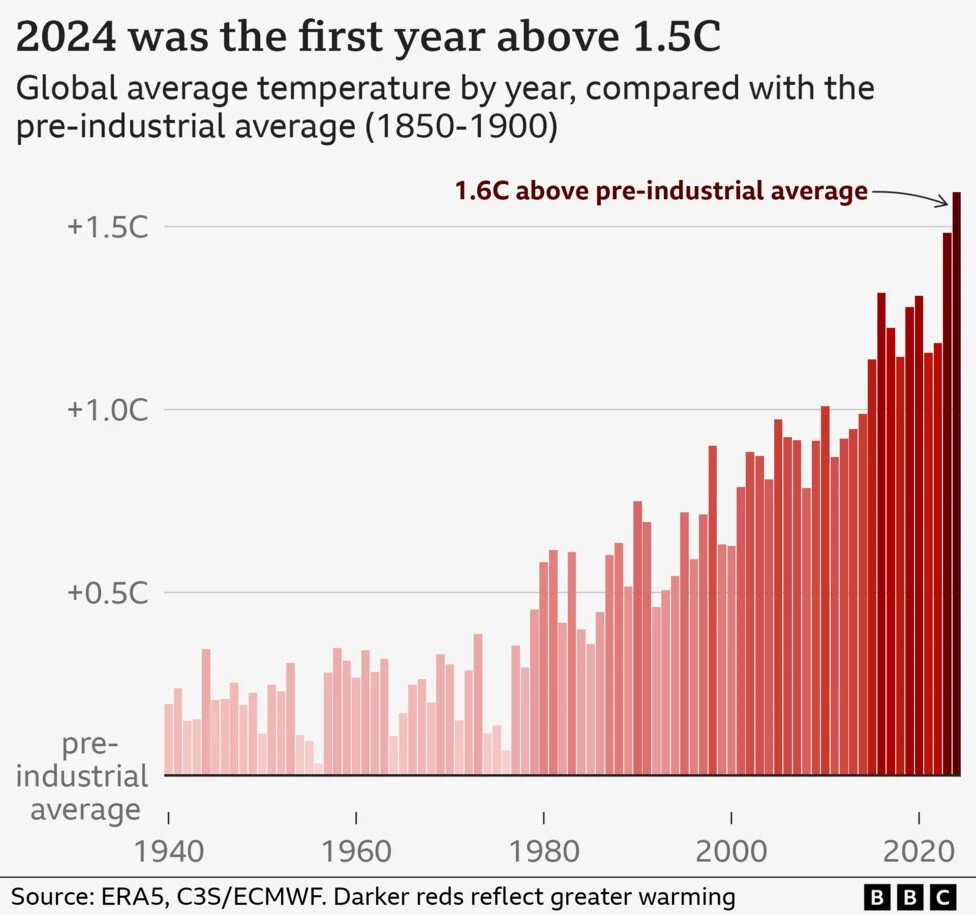
2024 first year to pass 1.5ºC global warming limit
The #BBC has produced this news item based on Copernicus data that highlights the following findings about #climatechange:
1. Global average temperatures for 2024 were around 1.6C above those of the pre-industrial period (1850-1900). This is used as a baseline, as it was the time before humans started burning large amounts of fossil fuels.
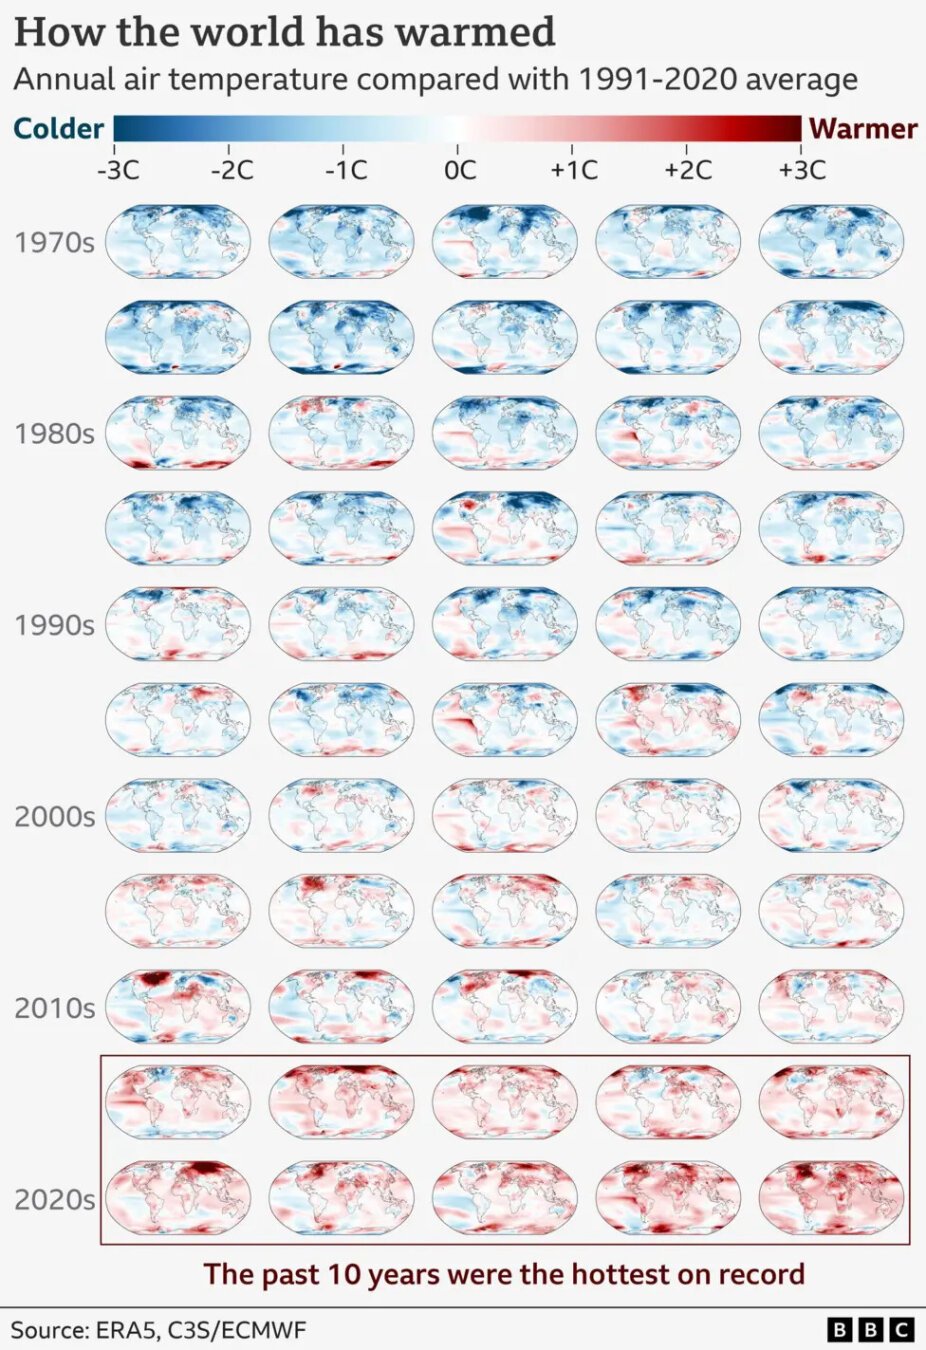
2. Whereas temperature increase from baseline was mainly located in specific areas by early 2000s, this is now observed everywhere almost equally, including oceans.
3. 2024 was the year with more number of days of temperature exceeding the average, and where the excess was more acute.
Source: https://www.bbc.co.uk/news/articles/cd7575x8yq5o
#datavisualization #datavisualisation #dataviz #datavis
The #BBC has produced this news item based on Copernicus data that highlights the following findings about #climatechange:
1. Global average temperatures for 2024 were around 1.6C above those of the pre-industrial period (1850-1900). This is used as a baseline, as it was the time before humans started burning large amounts of fossil fuels.
2. Whereas temperature increase from baseline was mainly located in specific areas by early 2000s, this is now observed everywhere almost equally, including oceans.
3. 2024 was the year with more number of days of temperature exceeding the average, and where the excess was more acute.
Source: https://www.bbc.co.uk/news/articles/cd7575x8yq5o
#datavisualization #datavisualisation #dataviz #datavis

2024 first year to pass 1.5ºC global warming limit
The #BBC has produced this news item based on Copernicus data that highlights the following findings about #climatechange:
1. Global average temperatures for 2024 were around 1.6C above those of the pre-industrial period (1850-1900). This is used as a baseline, as it was the time before humans started burning large amounts of fossil fuels.
2. Whereas temperature increase from baseline was mainly located in specific areas by early 2000s, this is now observed everywhere almost equally, including oceans.
3. 2024 was the year with more number of days of temperature exceeding the average, and where the excess was more acute.
Source: https://www.bbc.co.uk/news/articles/cd7575x8yq5o
#datavisualization #datavisualisation #dataviz #datavis
Datasaurus boosted:
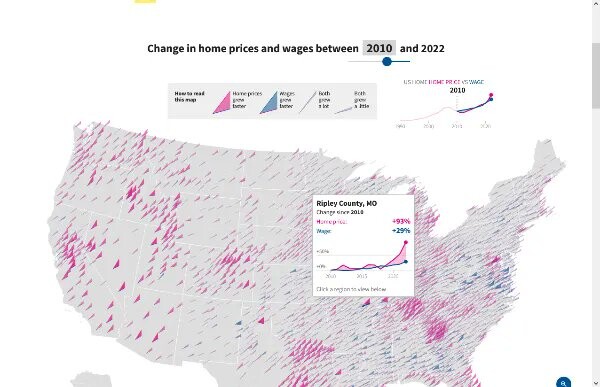
La crisi de l'habitatge també afecta els USA: segons l'Agència Federal de Finances de l'Habitatge, els preus dels habitatges van augmentar un 74% entre 2010 i 2022 mentre que el salari mitjà només va augmentar un 54% https://t.co/ifRbrG6yMd https://usafacts.org/data-projects/housing-vs-wages?utm_source=dlvr.it&utm_medium=mastodon
Thanks to my work colleague, Cagatay Turkay, for sharing that with me.
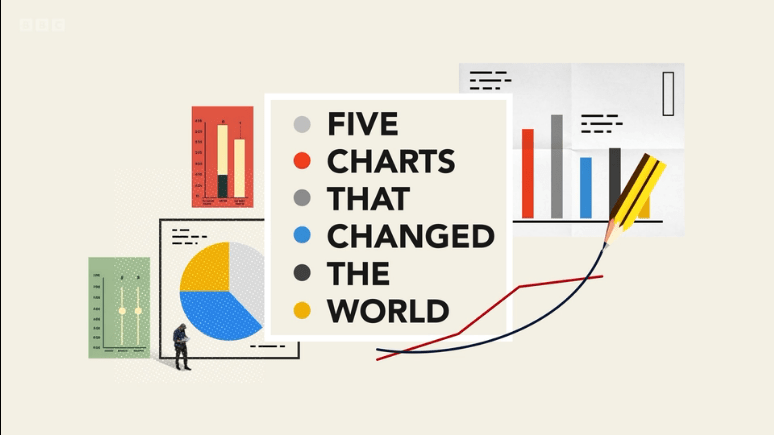
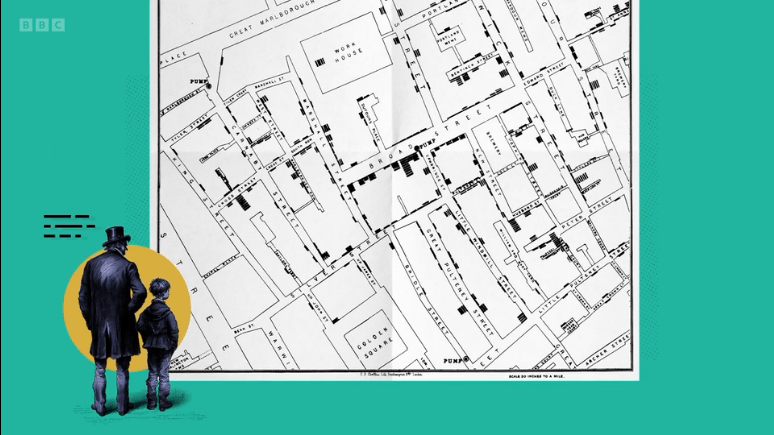
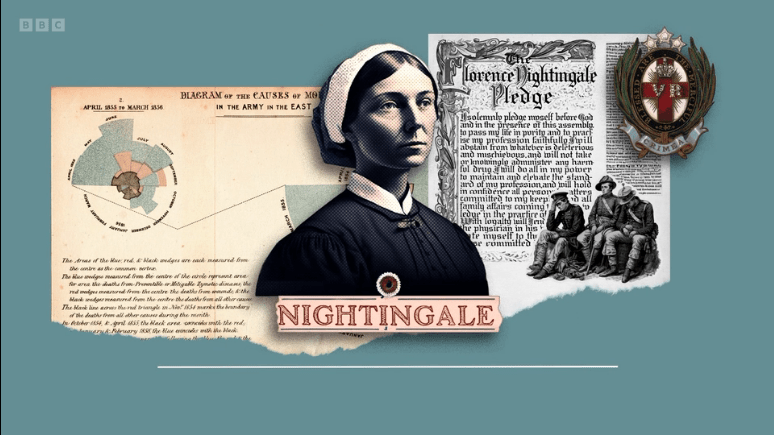
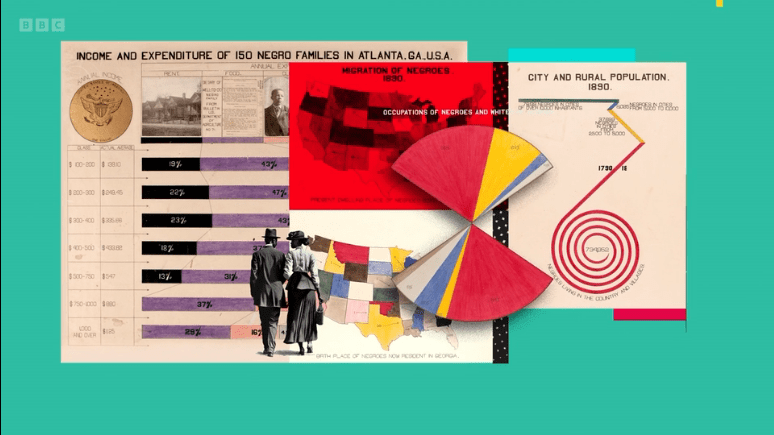
"Five charts that changed the world" is a motivational and pegadogical video created by the @BBCNewsUK@mastodon-uk.net and the Royal Society that condenses in 5 minutes the implications of 5 well-known #datavis : the Cholera map by John Snow, the Coxcomb by Florence Nightingale, the W.E.B. Dubois visualisations about Black Americans for the 1900 Paris Exposition or the Climate warming stripes by Ed Hawkins. Worth seeing it.
https://www.bbc.co.uk/ideas/videos/five-charts-that-changed-the-world/p0fb69c1
Screenshot credits: BBC
#dataviz #datavisualization #datavisualisation
https://www.bbc.co.uk/ideas/videos/five-charts-that-changed-the-world/p0fb69c1
Screenshot credits: BBC
#dataviz #datavisualization #datavisualisation
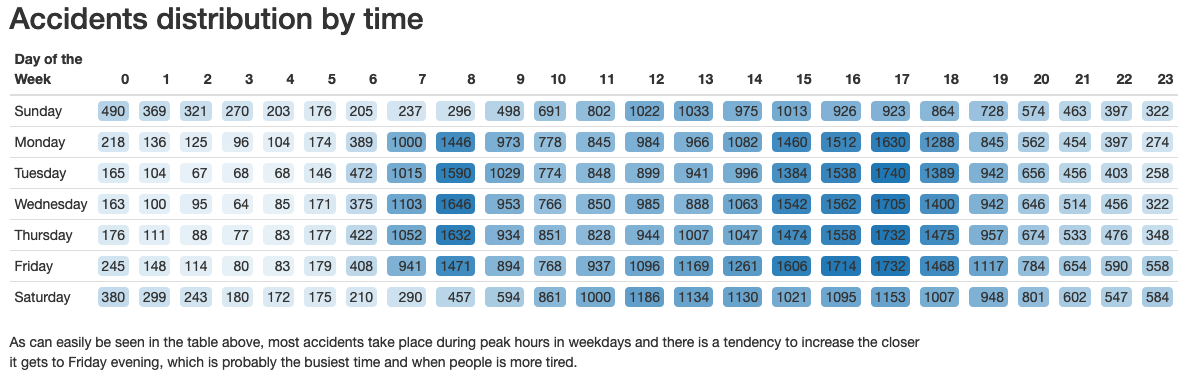
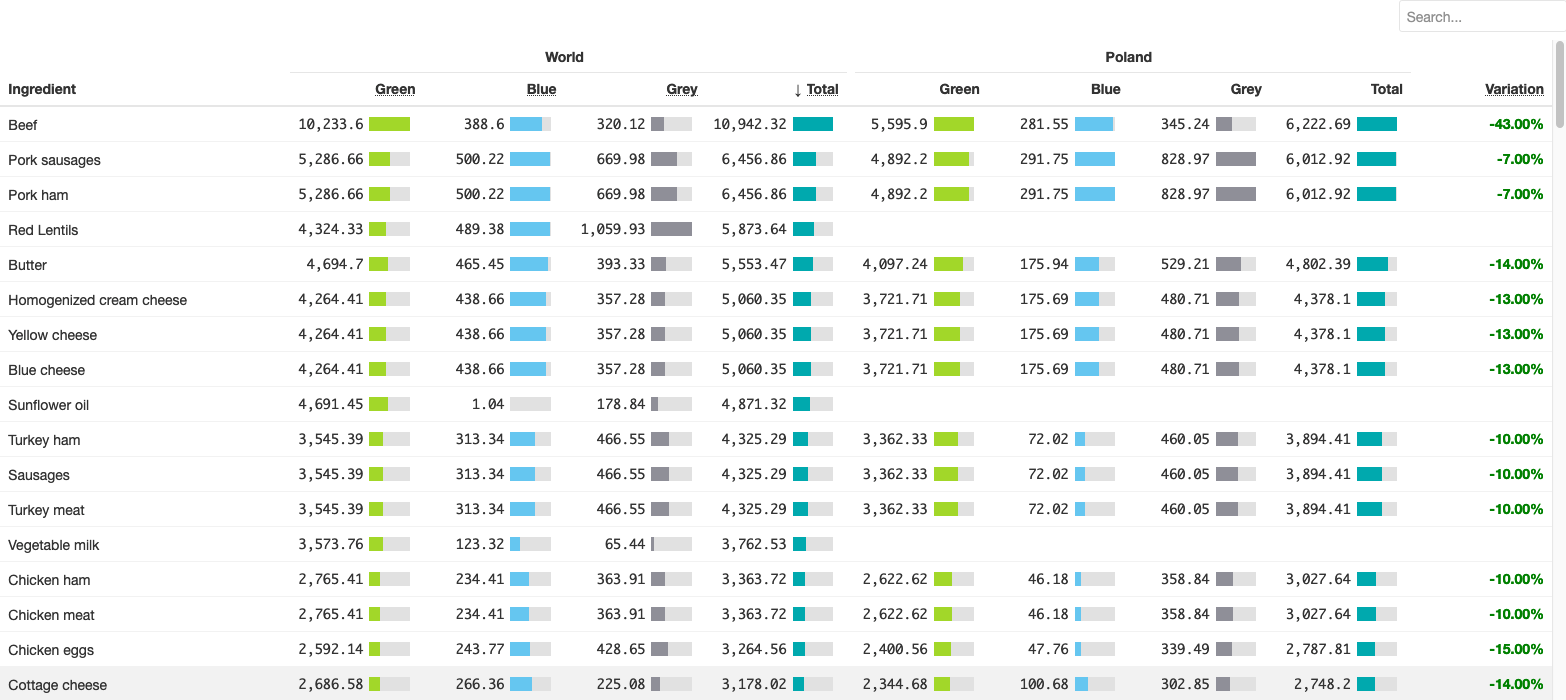
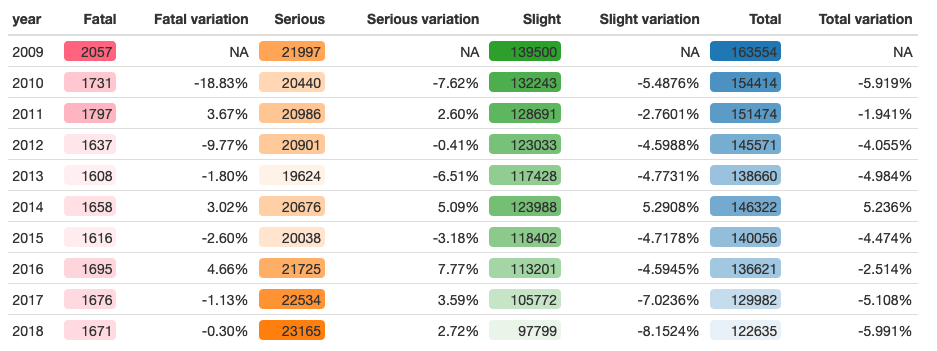
I love tables: they organize data in a way that can communicate faster than a regular text, but can data tables be considered a form of #datavisualisation ?
#datavis #dataviz #datavisualization #portfolio #rstats
Many people (probably F.J. Anscombe) would argue that they aren't. that the very purpose of #dataviz is to reveal patterns that otherwise would not be visible. Still, I believe there's much that can be done with tables, so I've been playing around with hybrid tables that combine data and visualisation, like these ones. This is a path I still need to keep exploring and improving, but what do you think so far? Do you know of good, inspirational, examples?
I made this image that clearly references to #datasaurus to illustrate two key topics:
First, because #datavisualization is a means to reveal hidden patters in our data, like the datasaurus (see previous post for info)
Second, because we can use #coding with #images as we do with #data. (Actually, can't images be considered data?). And to demonstrate that, I wrote this tutorial explaining how to use #rstats with #imagemagick to generate the two images accompanying this post:
https://ds-labs.carloscamara.es/posts/2023-03-02_matrix-effect/
Client Info
Server: https://mastodon.social
Version: 2025.07
Repository: https://github.com/cyevgeniy/lmst