Blood boiling stuff
Ivan Babrou
Doing performance @ Cloudflare.

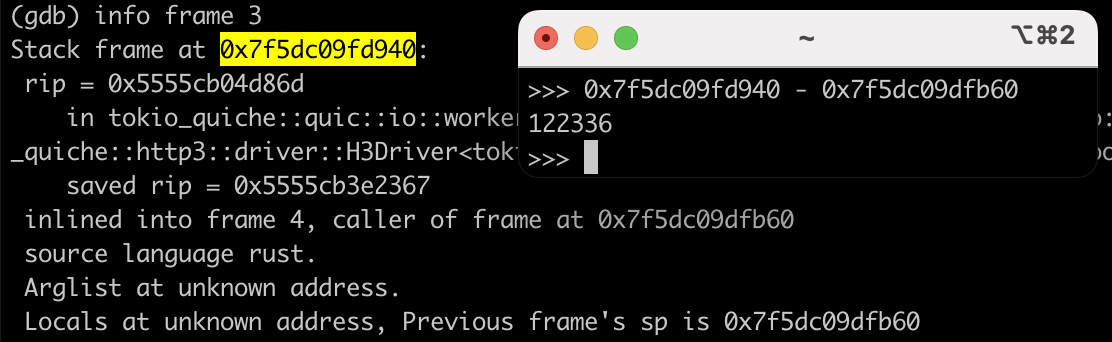
Fun stuff: #linux #perf can't copy userspace stacks over 64k bytes due to u16 field size limit. You need the stack to do unwinding with dwarf.
I have a #rust program that has a single frame twice as big. It's 3 frames combined into one, but still.
The default stack size to copy in perf is just 8k.
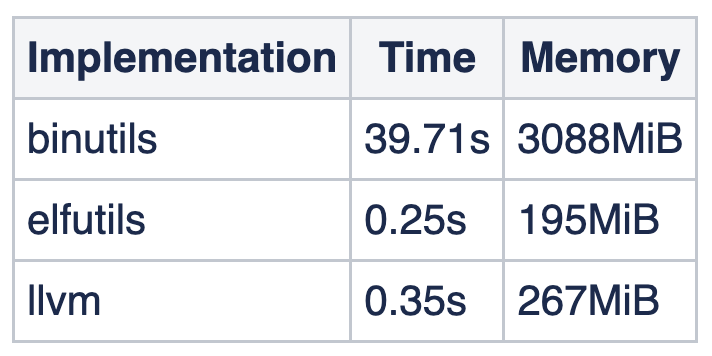
If you use #linux #perf on #rust binaries, I highly recommend you check this out:
* https://github.com/torvalds/linux/commit/c3f8644c21df9b7db97eb70e08e2826368aaafa0
For a decently sized binary (just one!) we observed the following resource consumption on v6.6 and Debian Bookworm:
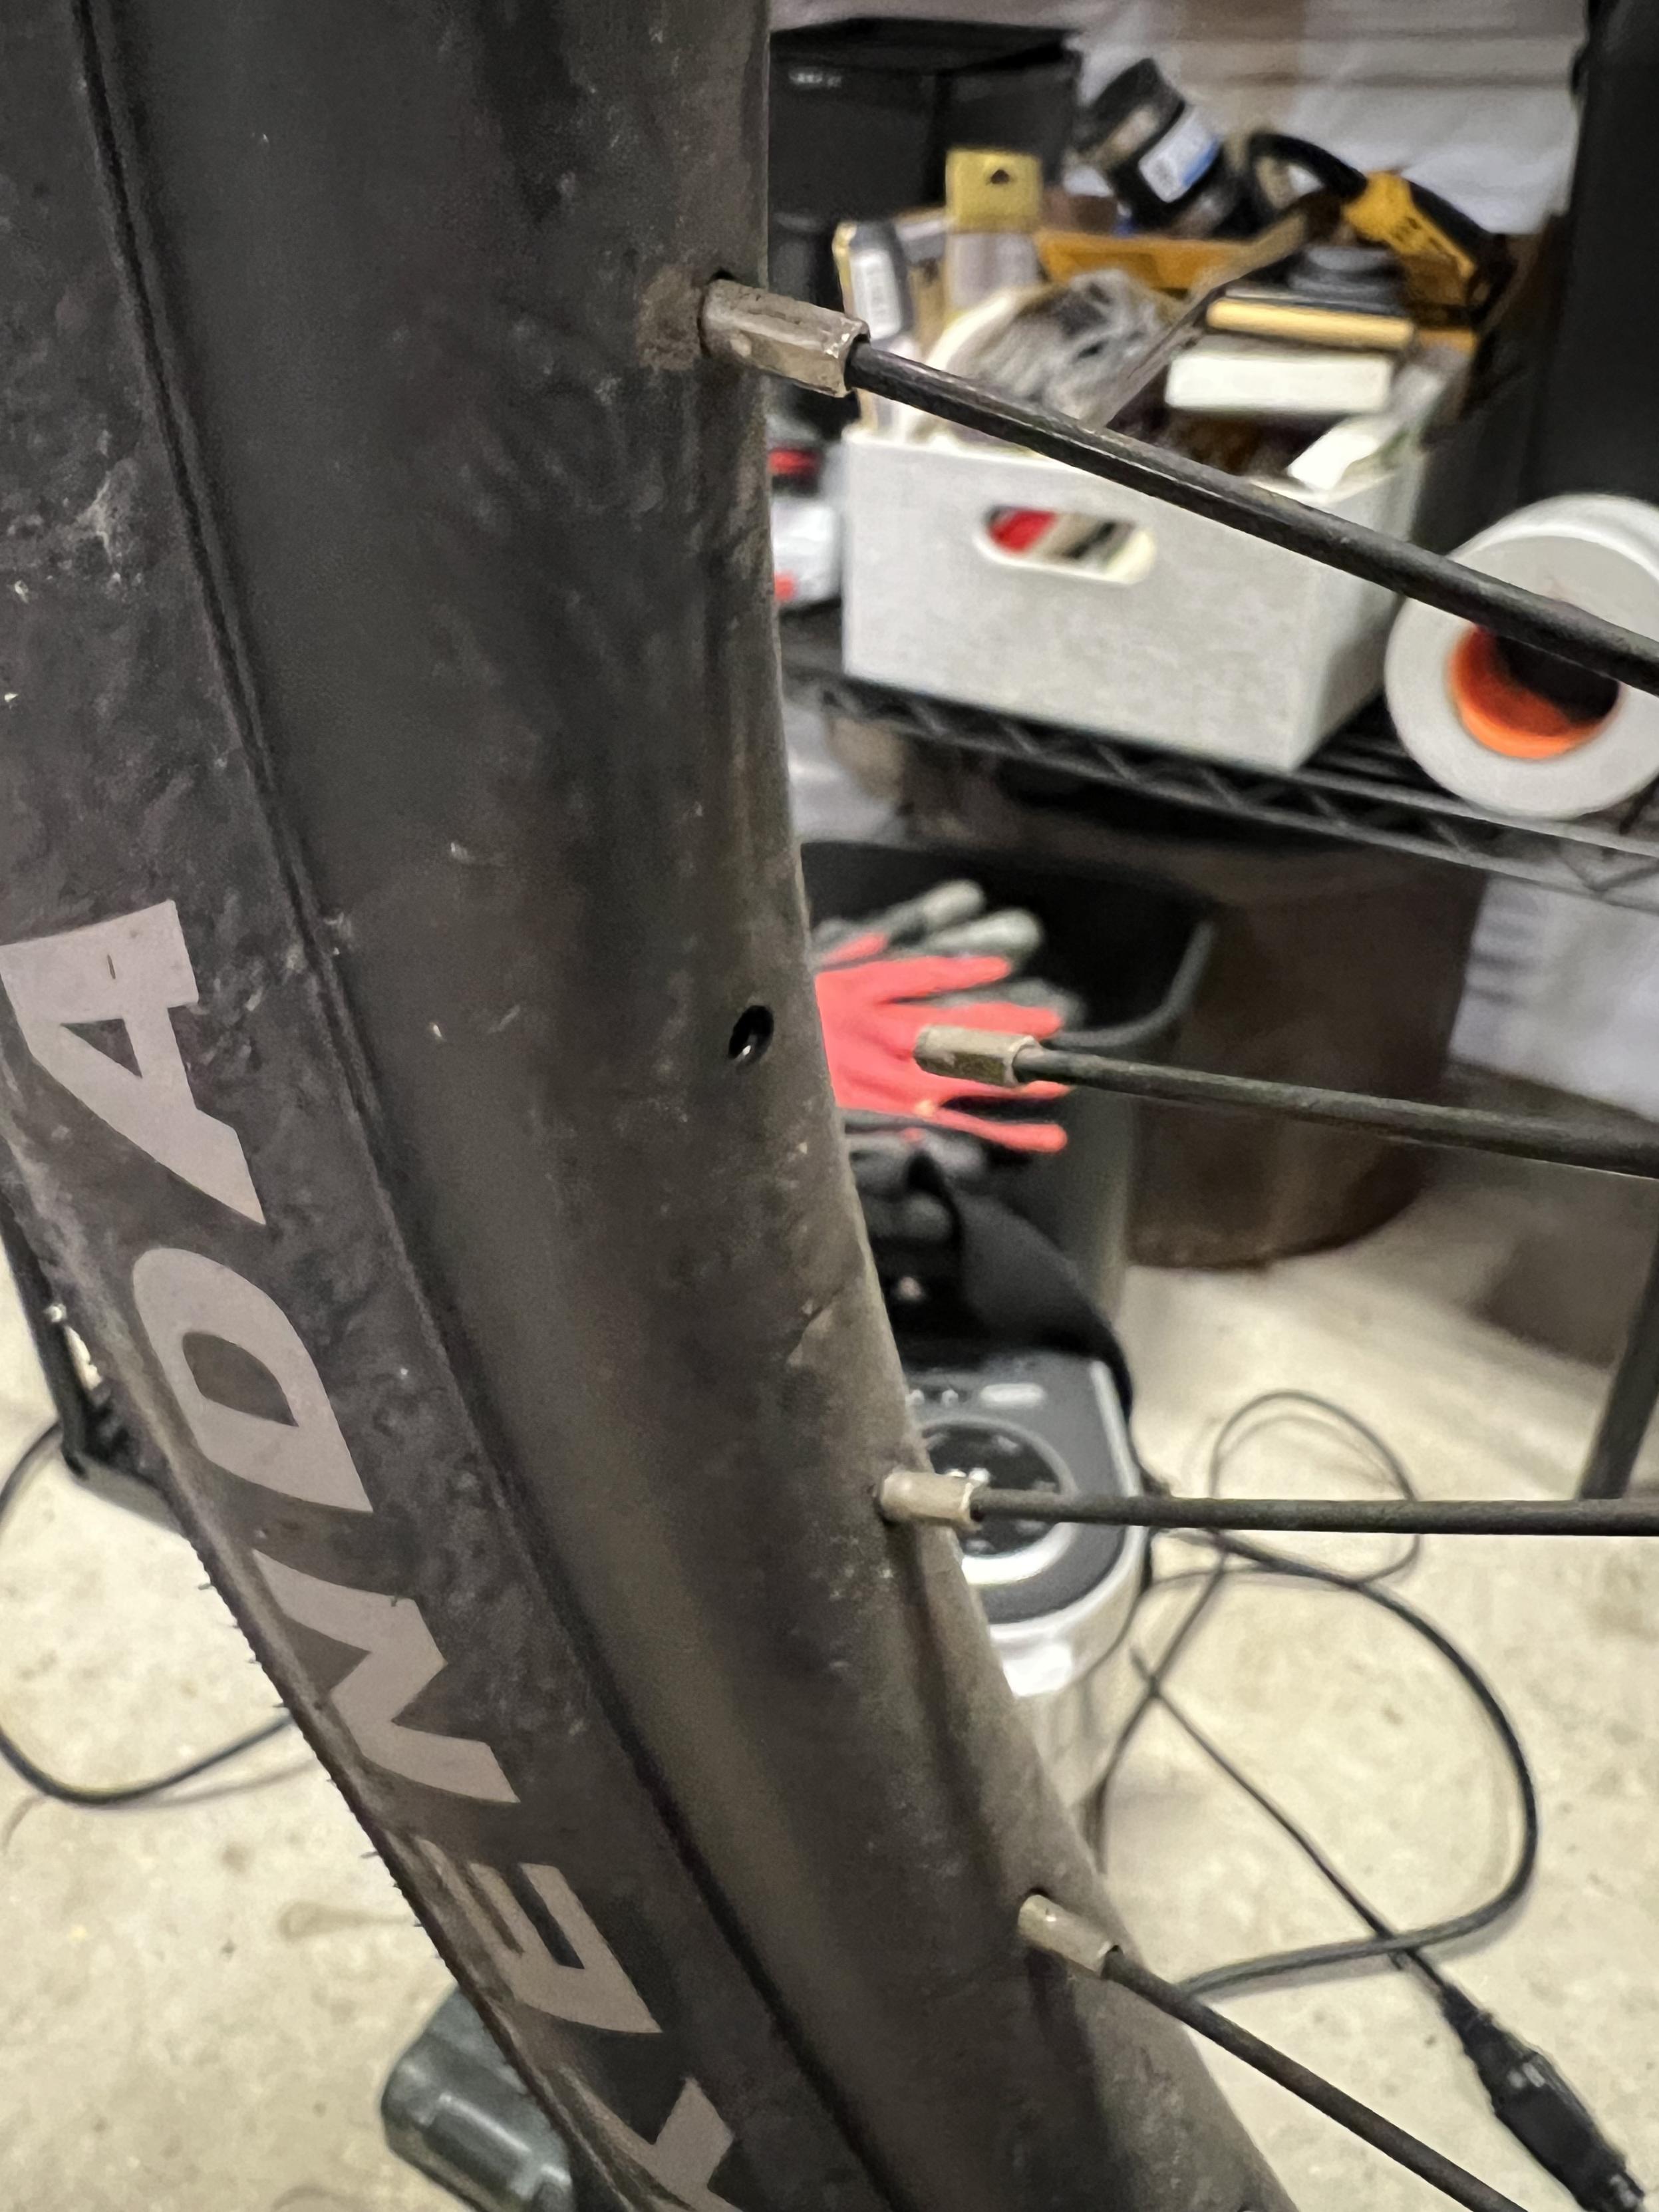
This somewhat explains the unnatural feeling when going 50mph downhill 🫨
https://adventofcode.com/ is back 🎄
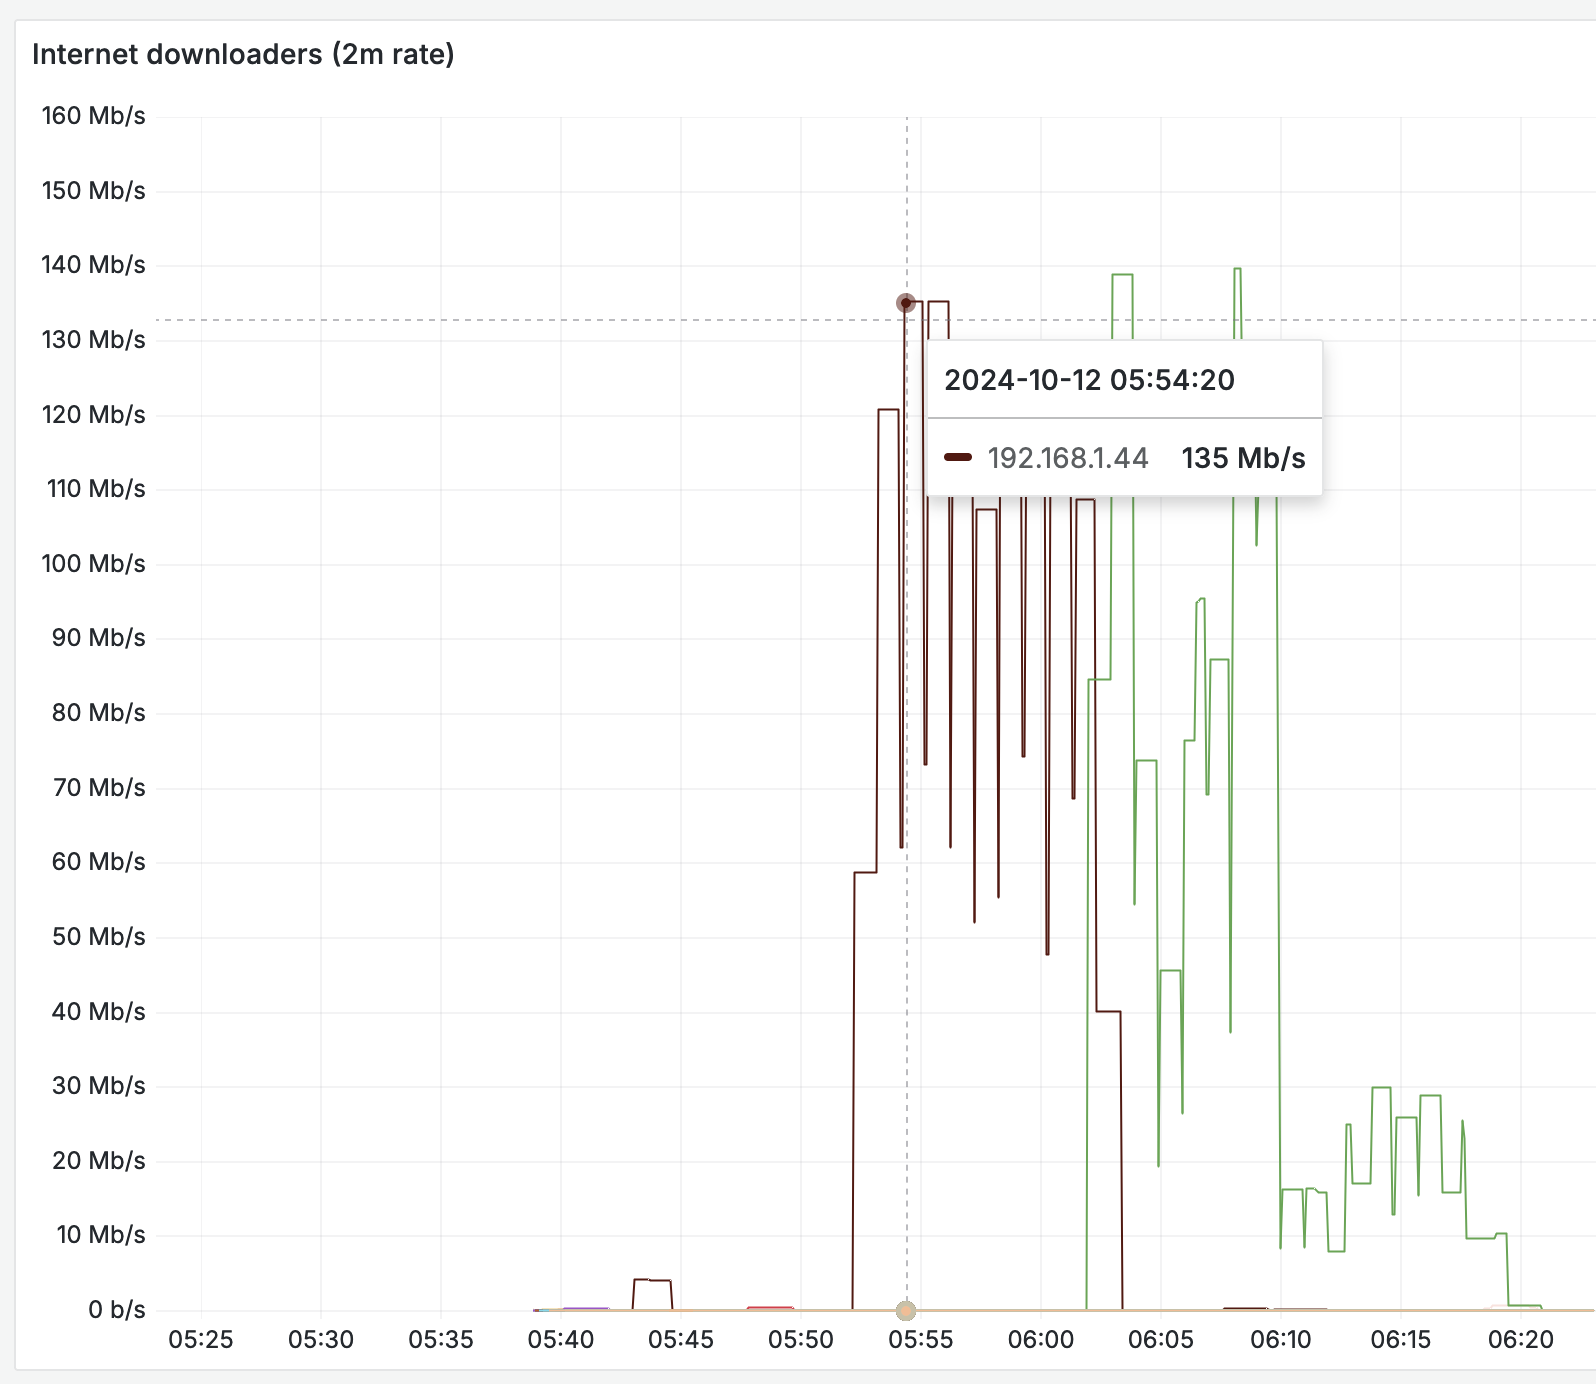
#Grafana picking the least contrasting colors for the the most important lines on your graphs:

Rust issue: https://github.com/rust-lang/rust/issues/132636
@jhpratt somebody else is already on it, I’m post the link when it’s up.
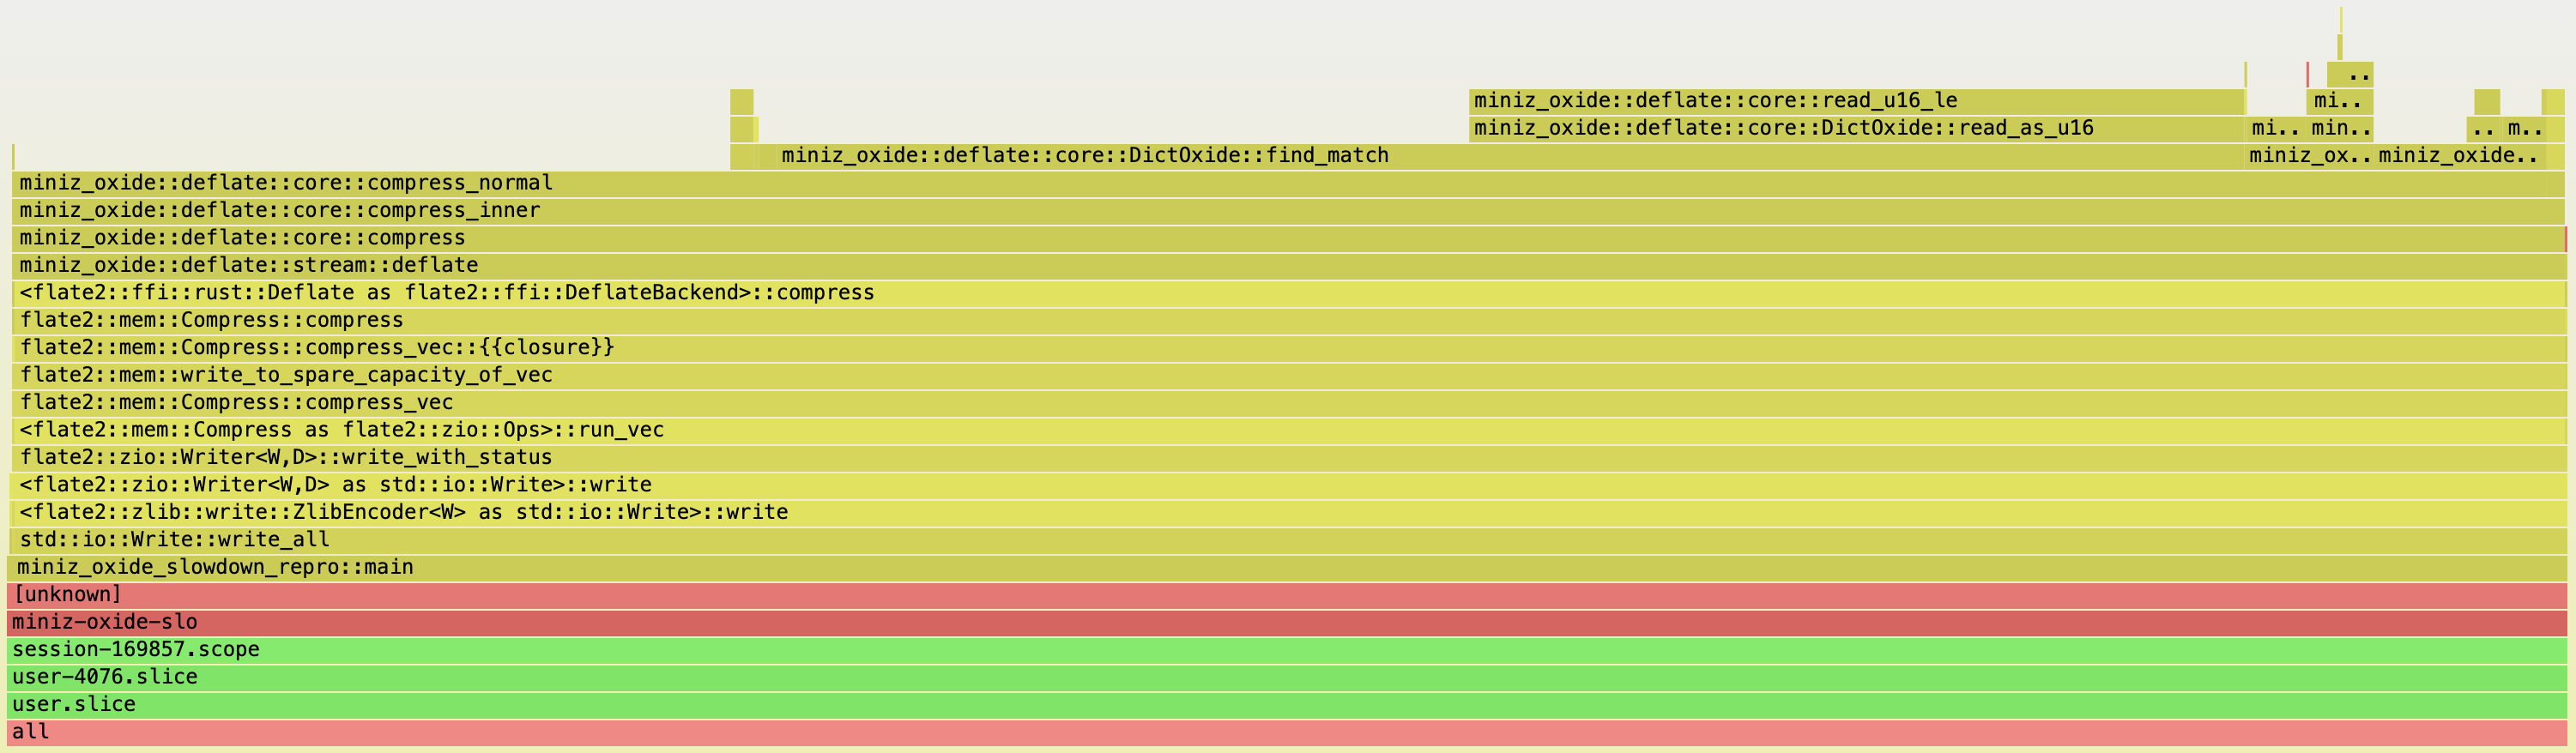
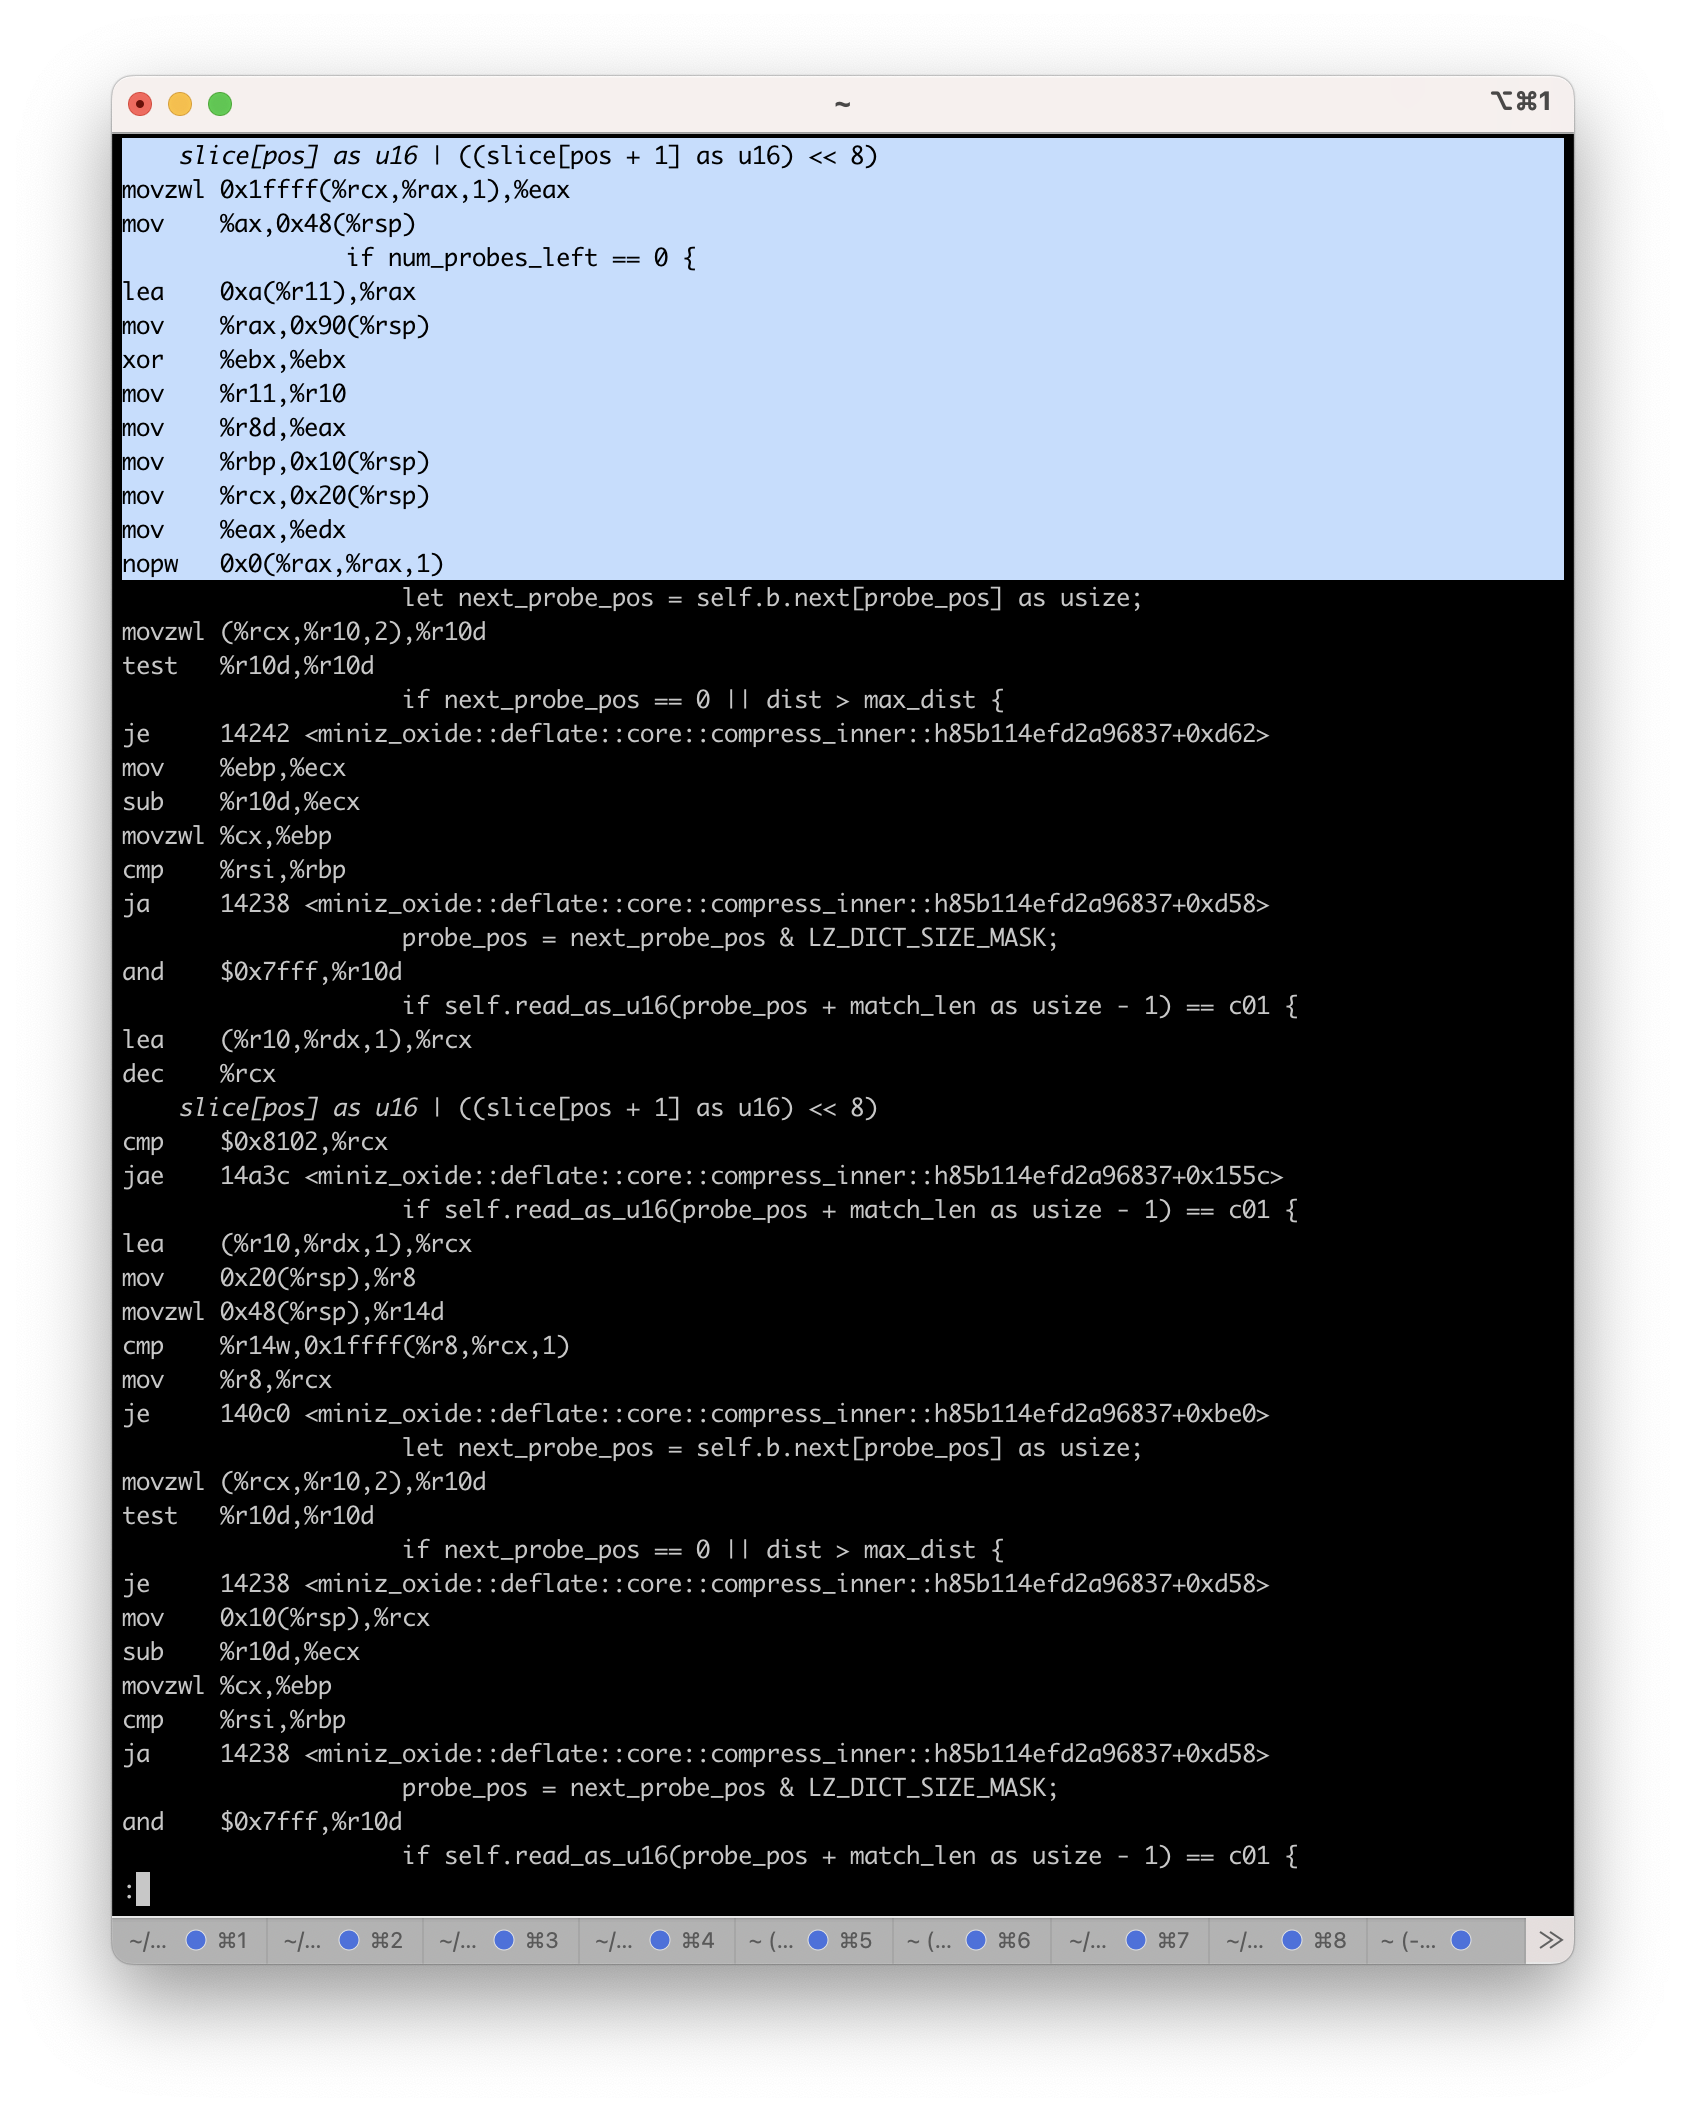
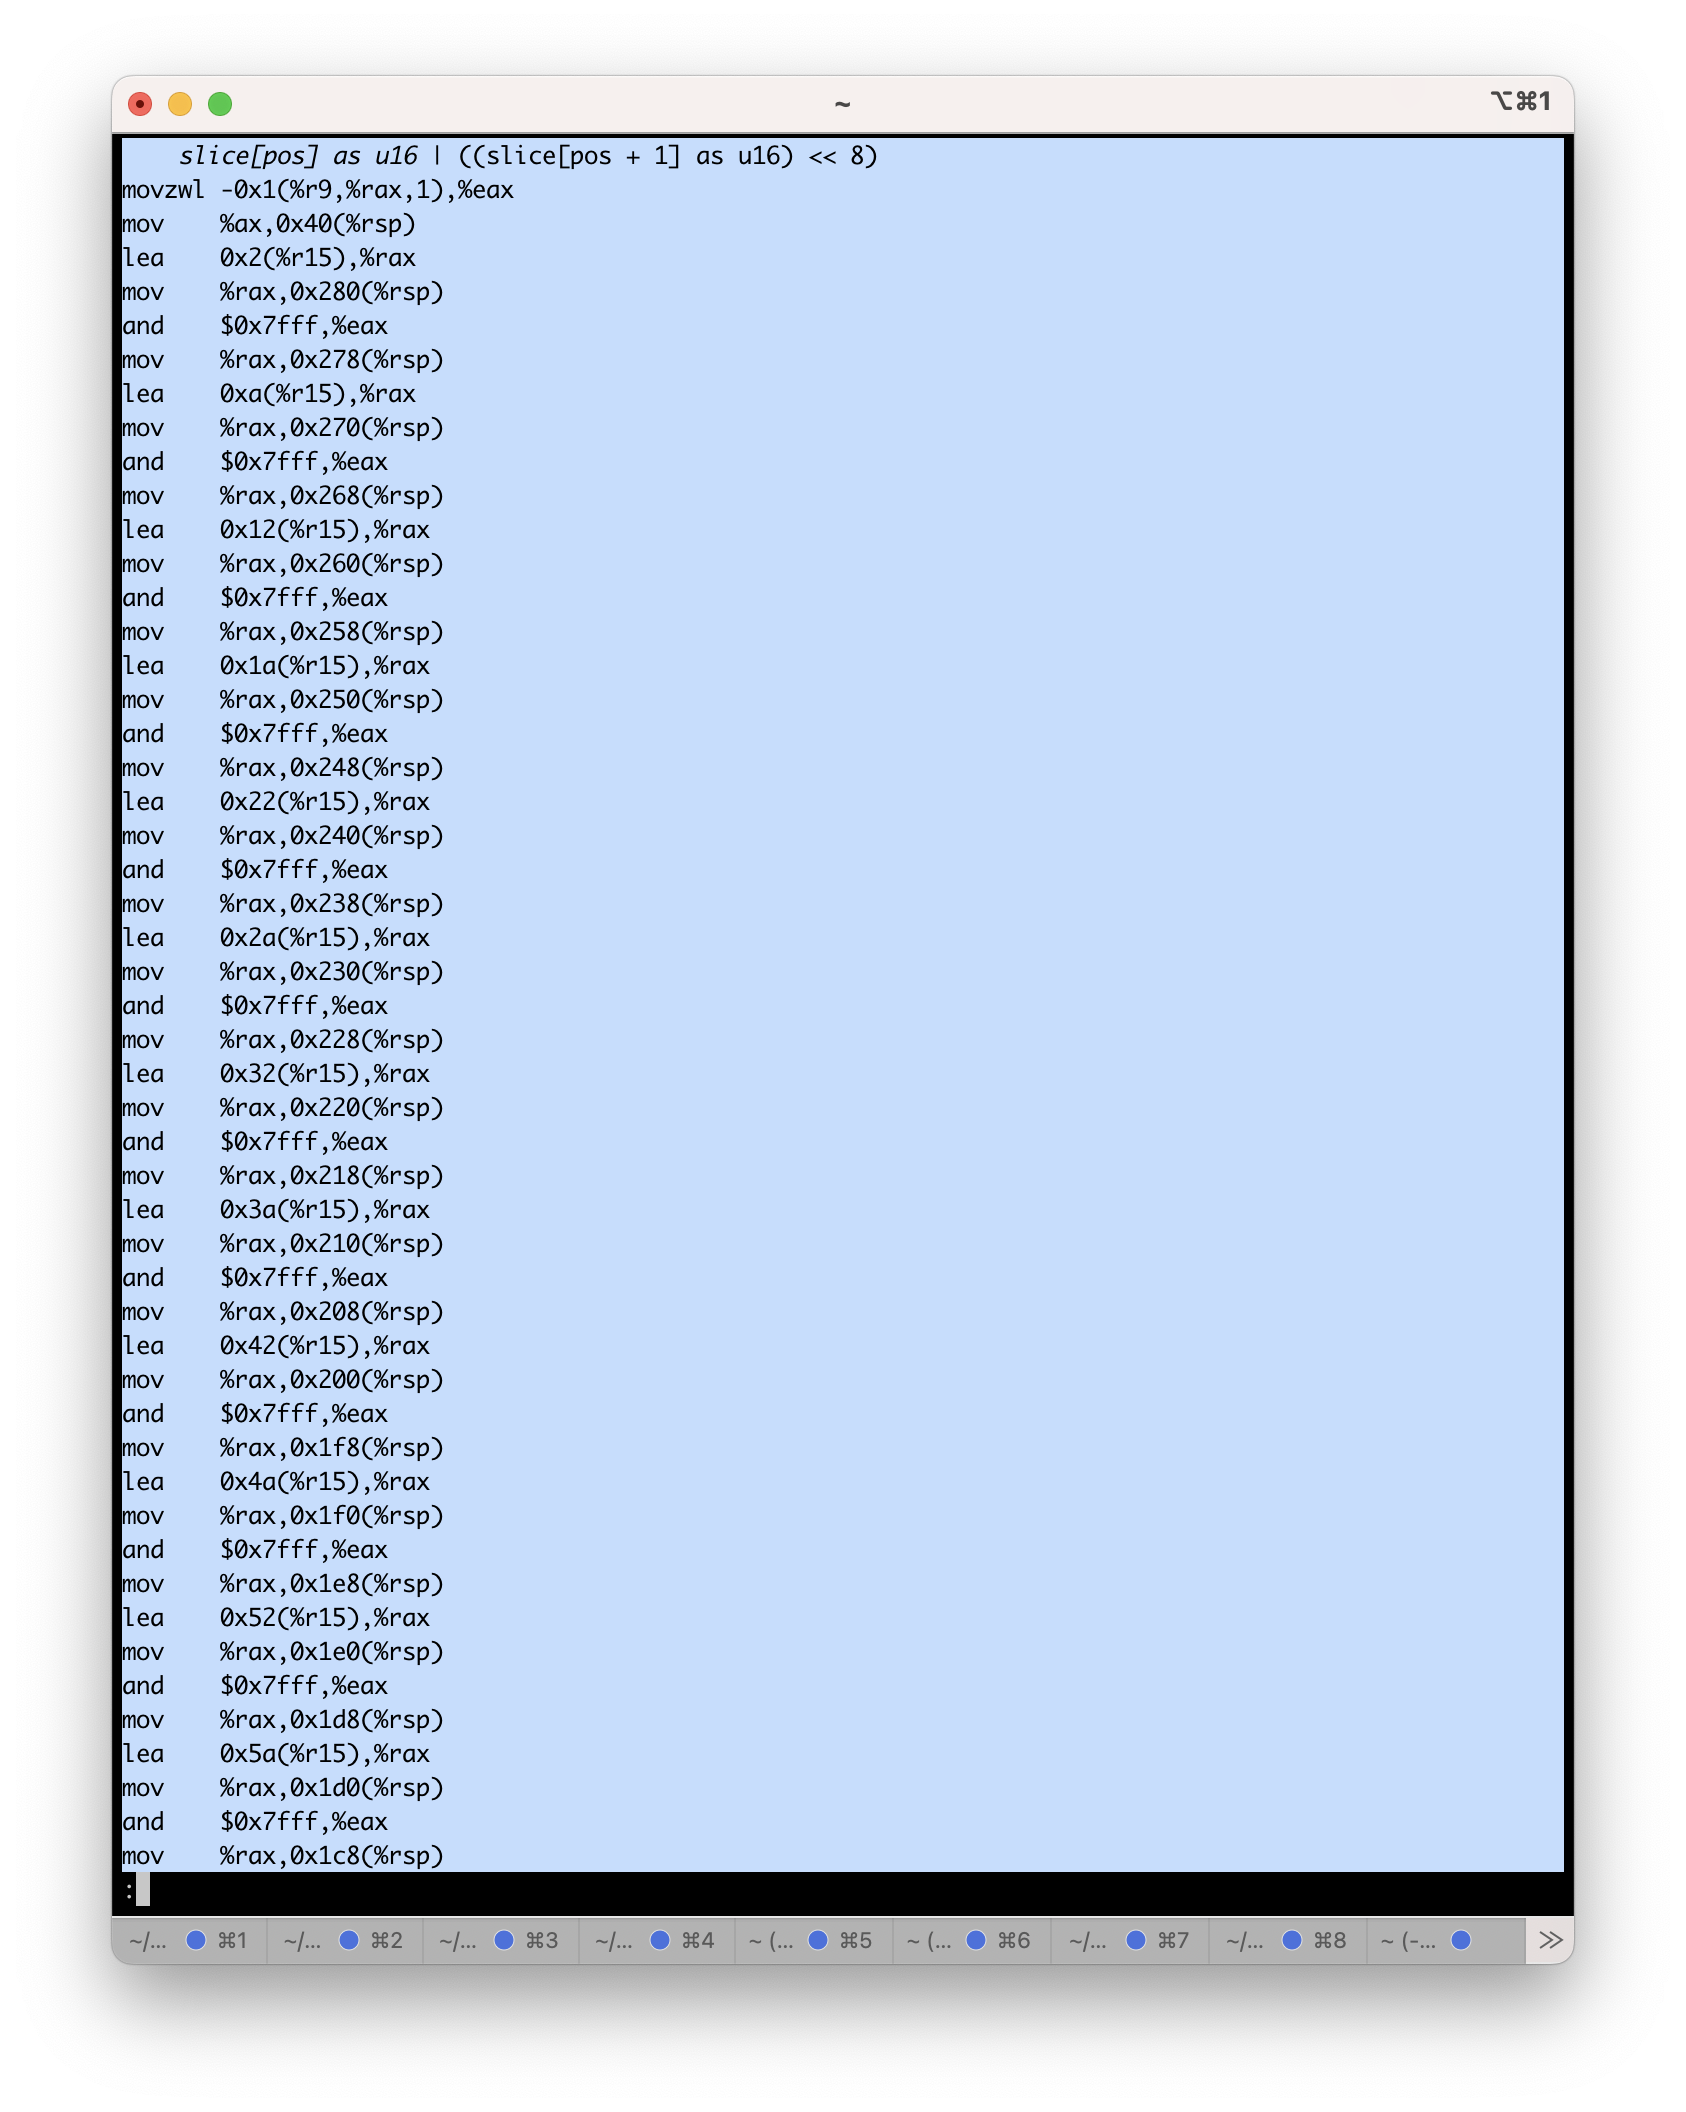
#rust v1.81 vs v1.82. That's a lot of instructions!

I hacked together a netflow to prometheus exporter to figure out which devices misbehaved, so at least there’s that.
Ubiquity EdgeRouter X needed some extra manual hacking to enable netflow for this new thing called IPv6. It’s just a few copy-pasted ip6tables rules based on the plain old iptables, but it’s still super annoying to do anything in 2024.
My work laptop decided to do the same to put me firmly over the limit. Just incredible.
People reported this for over a year and Apple did nothing.
macOS:
1. Nearly runs out of disk space
2. Removes video screensavers to clean up some space
3. Notices that video screensavers are not downloaded, downloads them again
4. Repeat
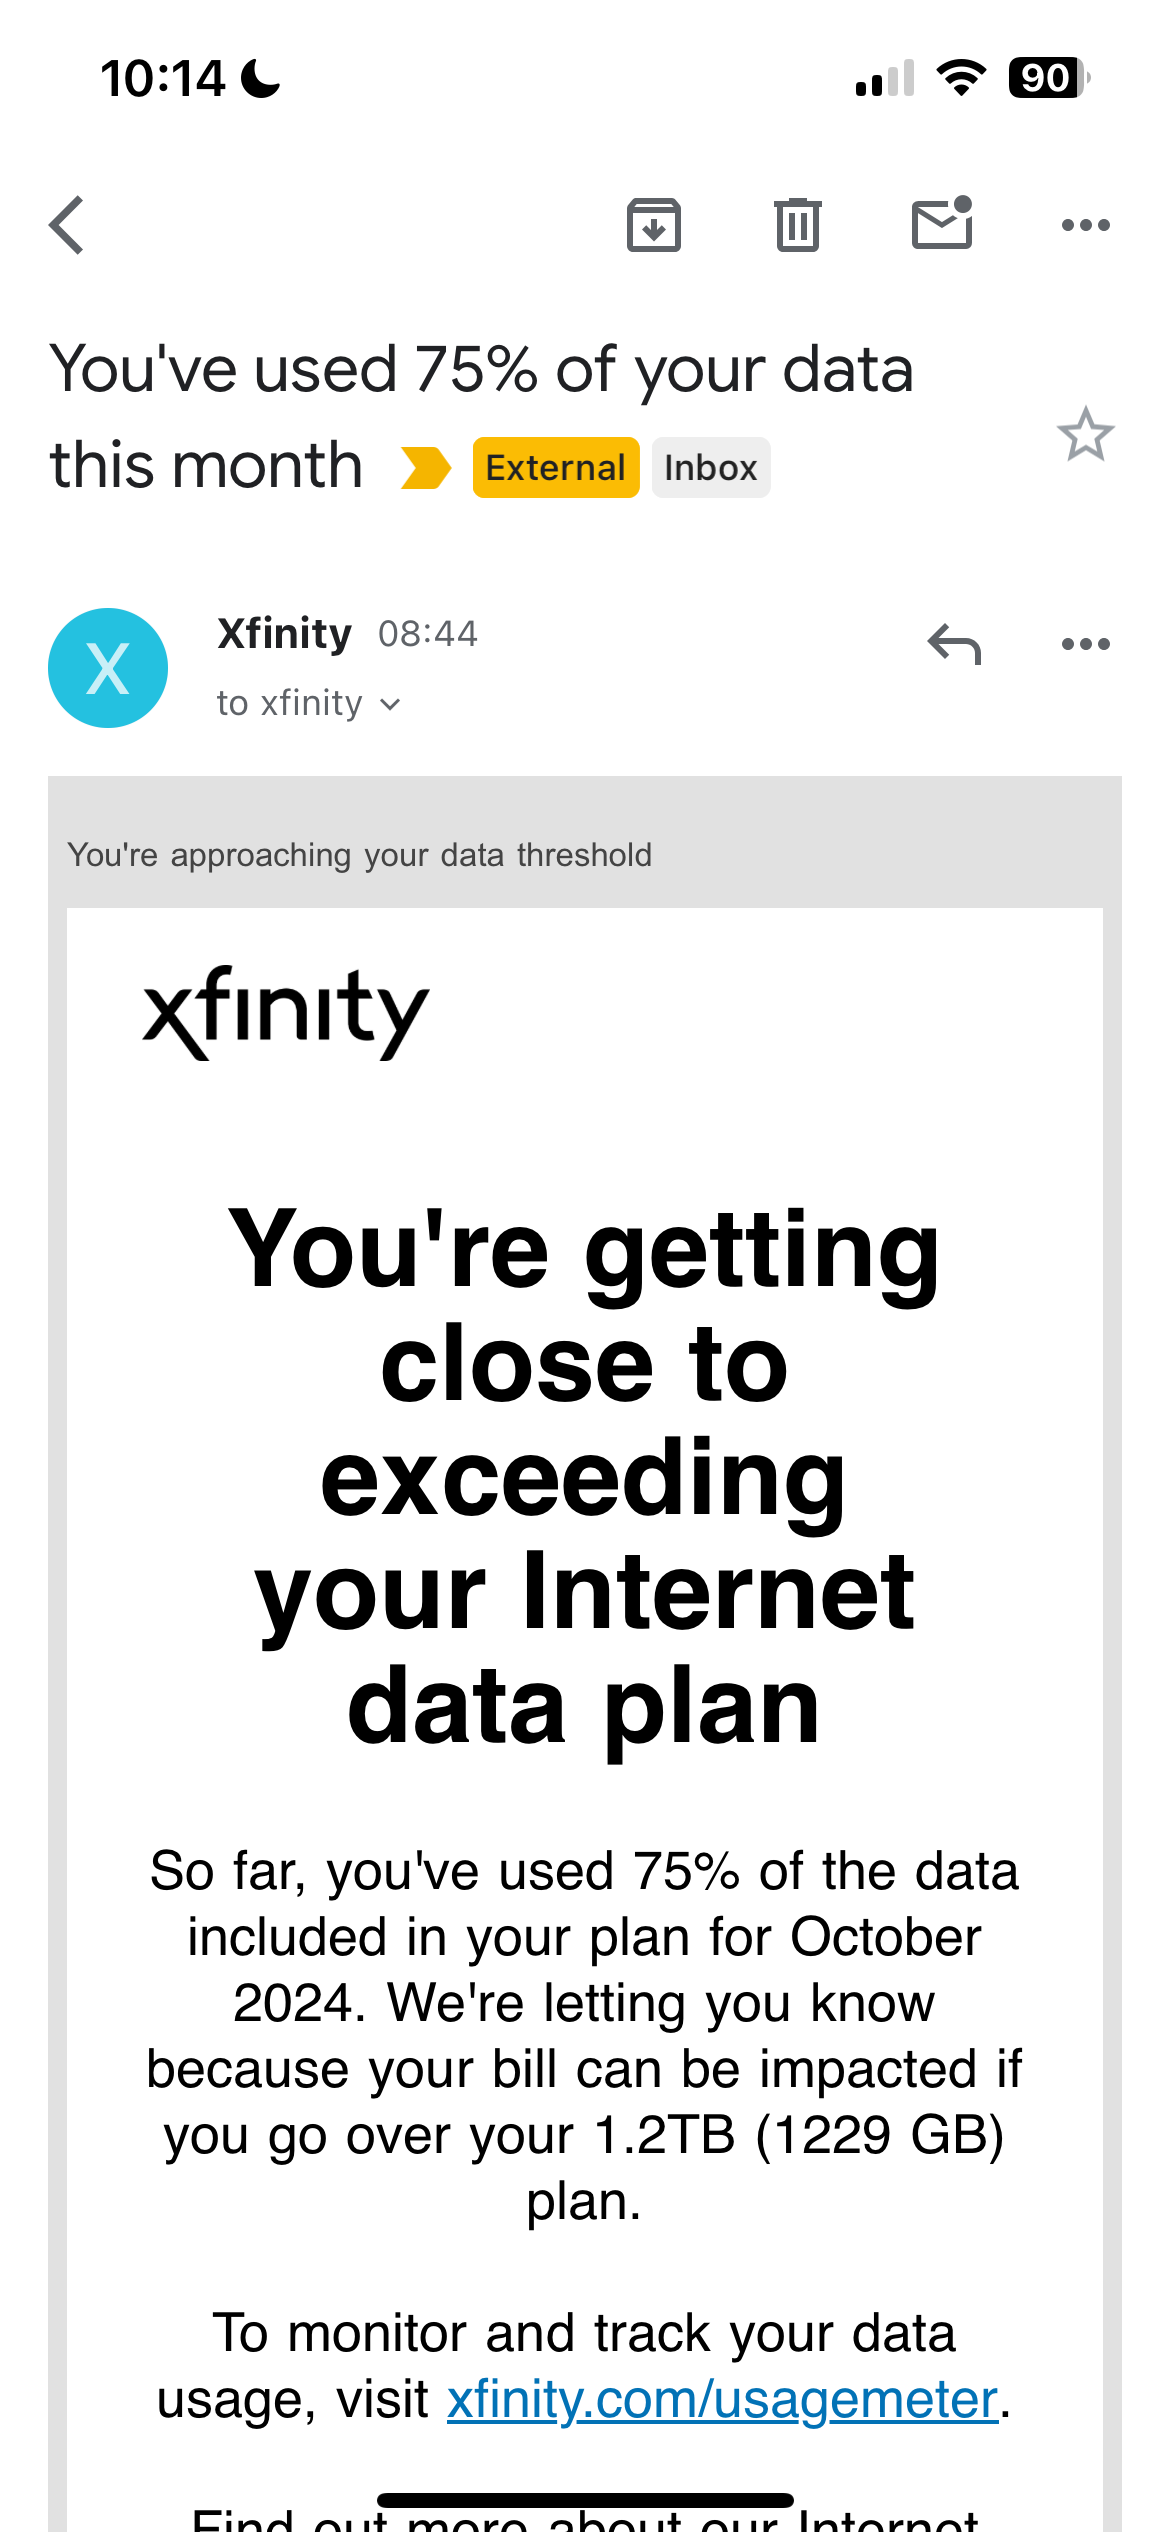
xfinity, with 22 days left in the billing cycle:
The remaining 3 allocations were fixed in https://github.com/tokio-rs/tokio/pull/6779. I was seeing them because the project I'm measuring on is using older Tokio due to transitive deps.
I was wrong that they happen on aarch64 and not x84_64. In fact, there are 3 _other_ allocations on Tokio v1.40 on macOS that are not present on Linux. They happen in a mutex (or at least the first one), so totally possible that Linux is better at it.
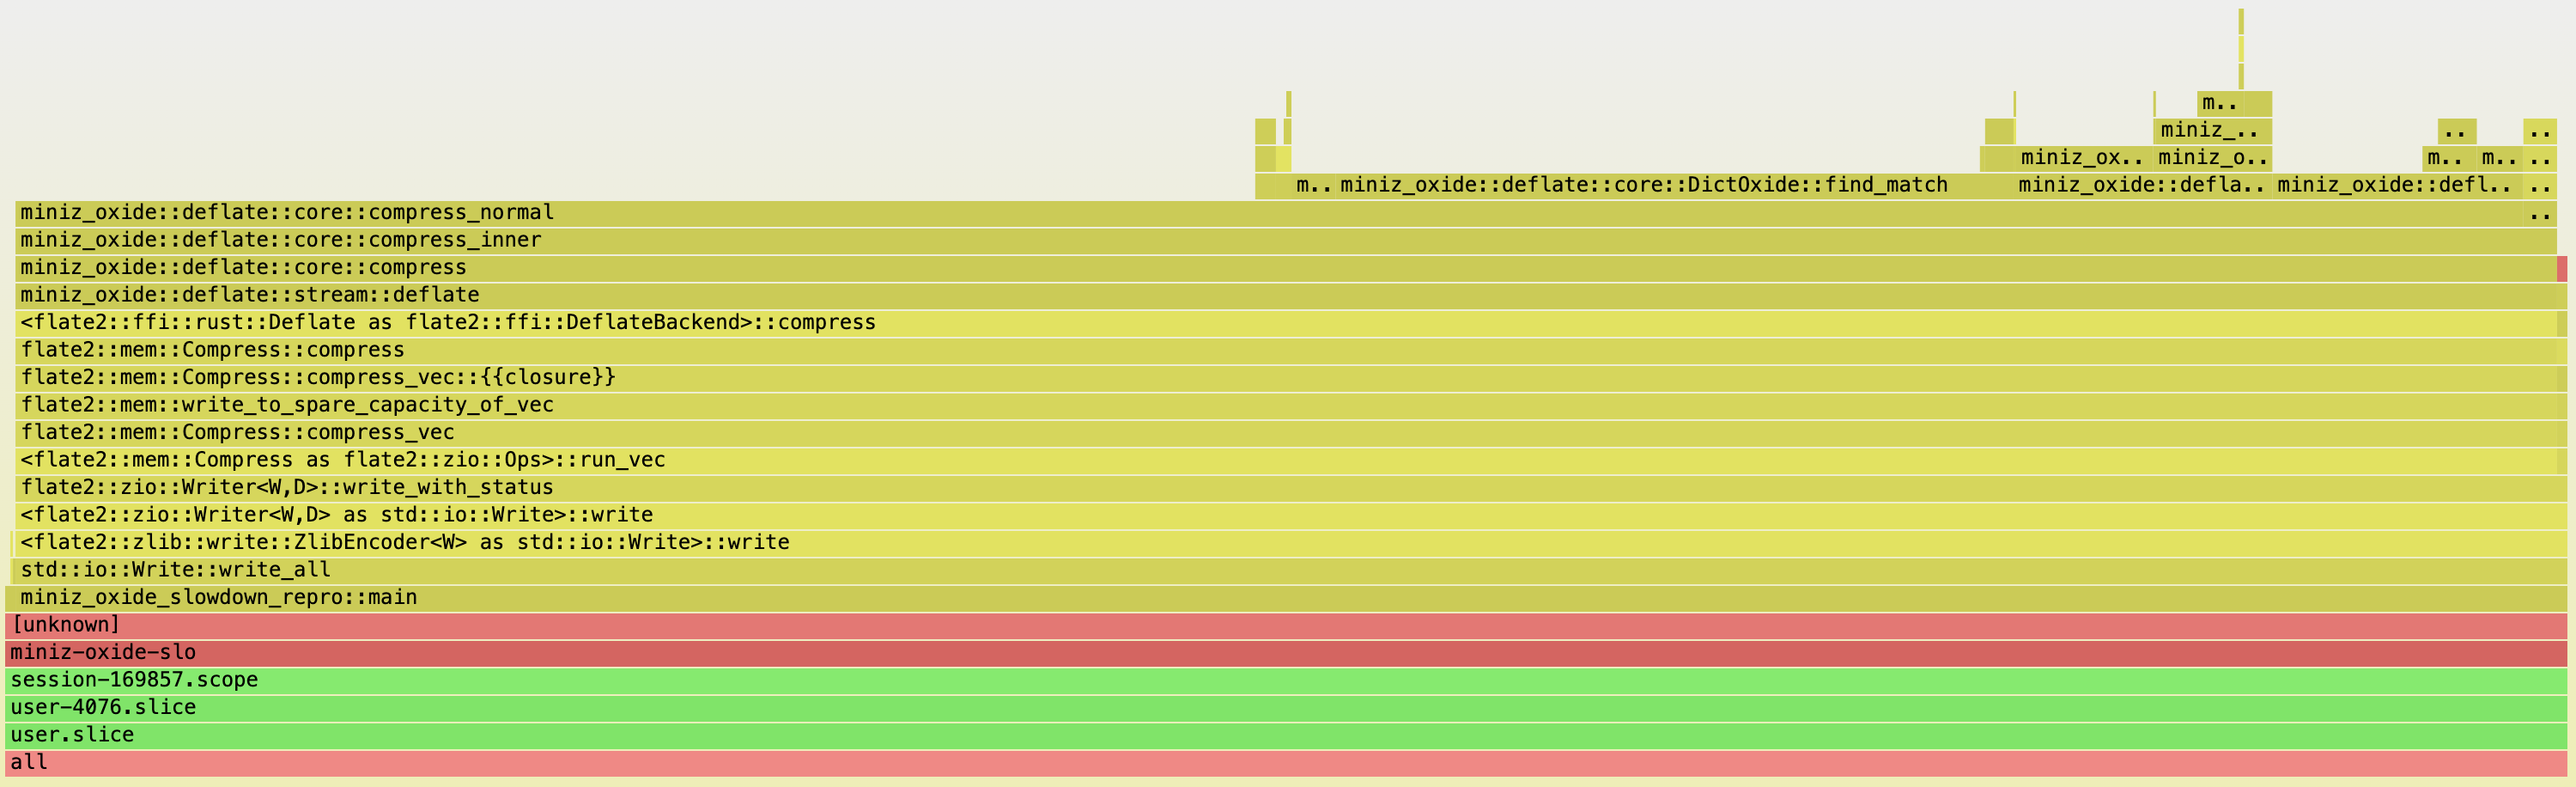
Where there's a bunch of stack traces, you can make a flamegraph too.
Remember that tokio::time::sleep allocating surprisingly a log? Most of it was due to tracing. I was measuring in an axum app with OTLP, console and fmt subscribers enabled, these things add up, even if you only trace the outer future and not the one you measure.
There are 3 remaining tokio scheduler allocations that seemingly only happen on aarch64. The vanish in Github Actions that run on x86_64.
Client Info
Server: https://mastodon.social
Version: 2025.04
Repository: https://github.com/cyevgeniy/lmst