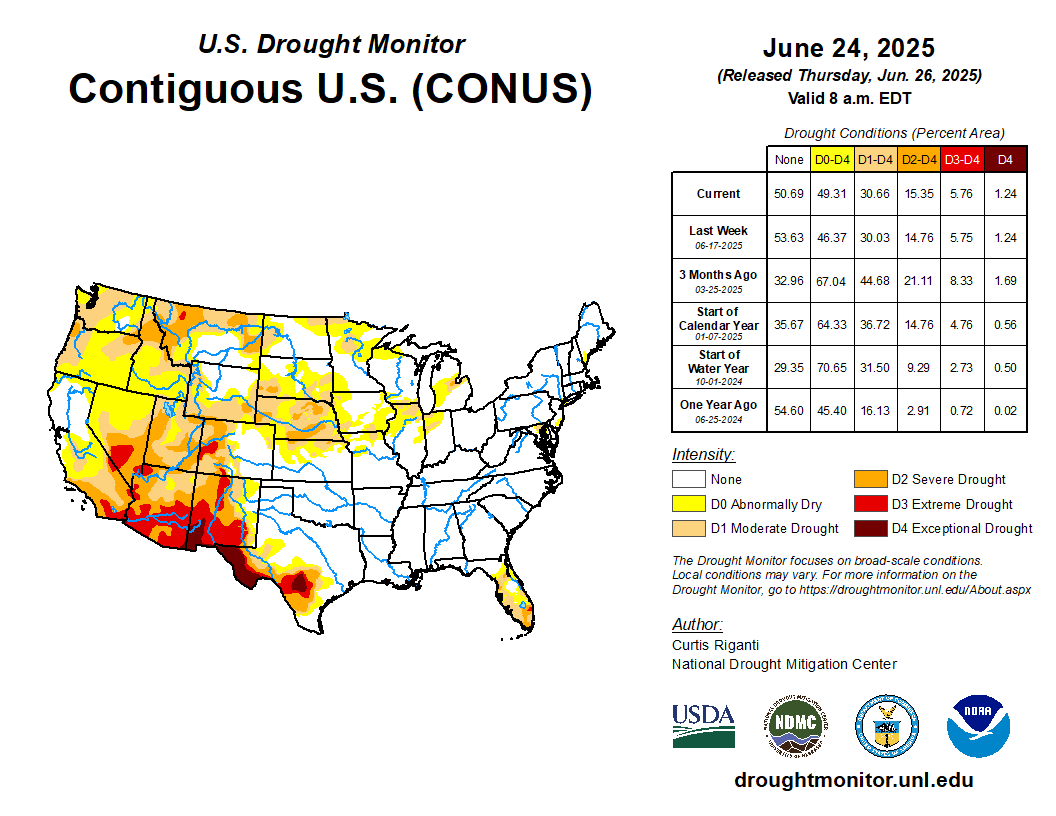
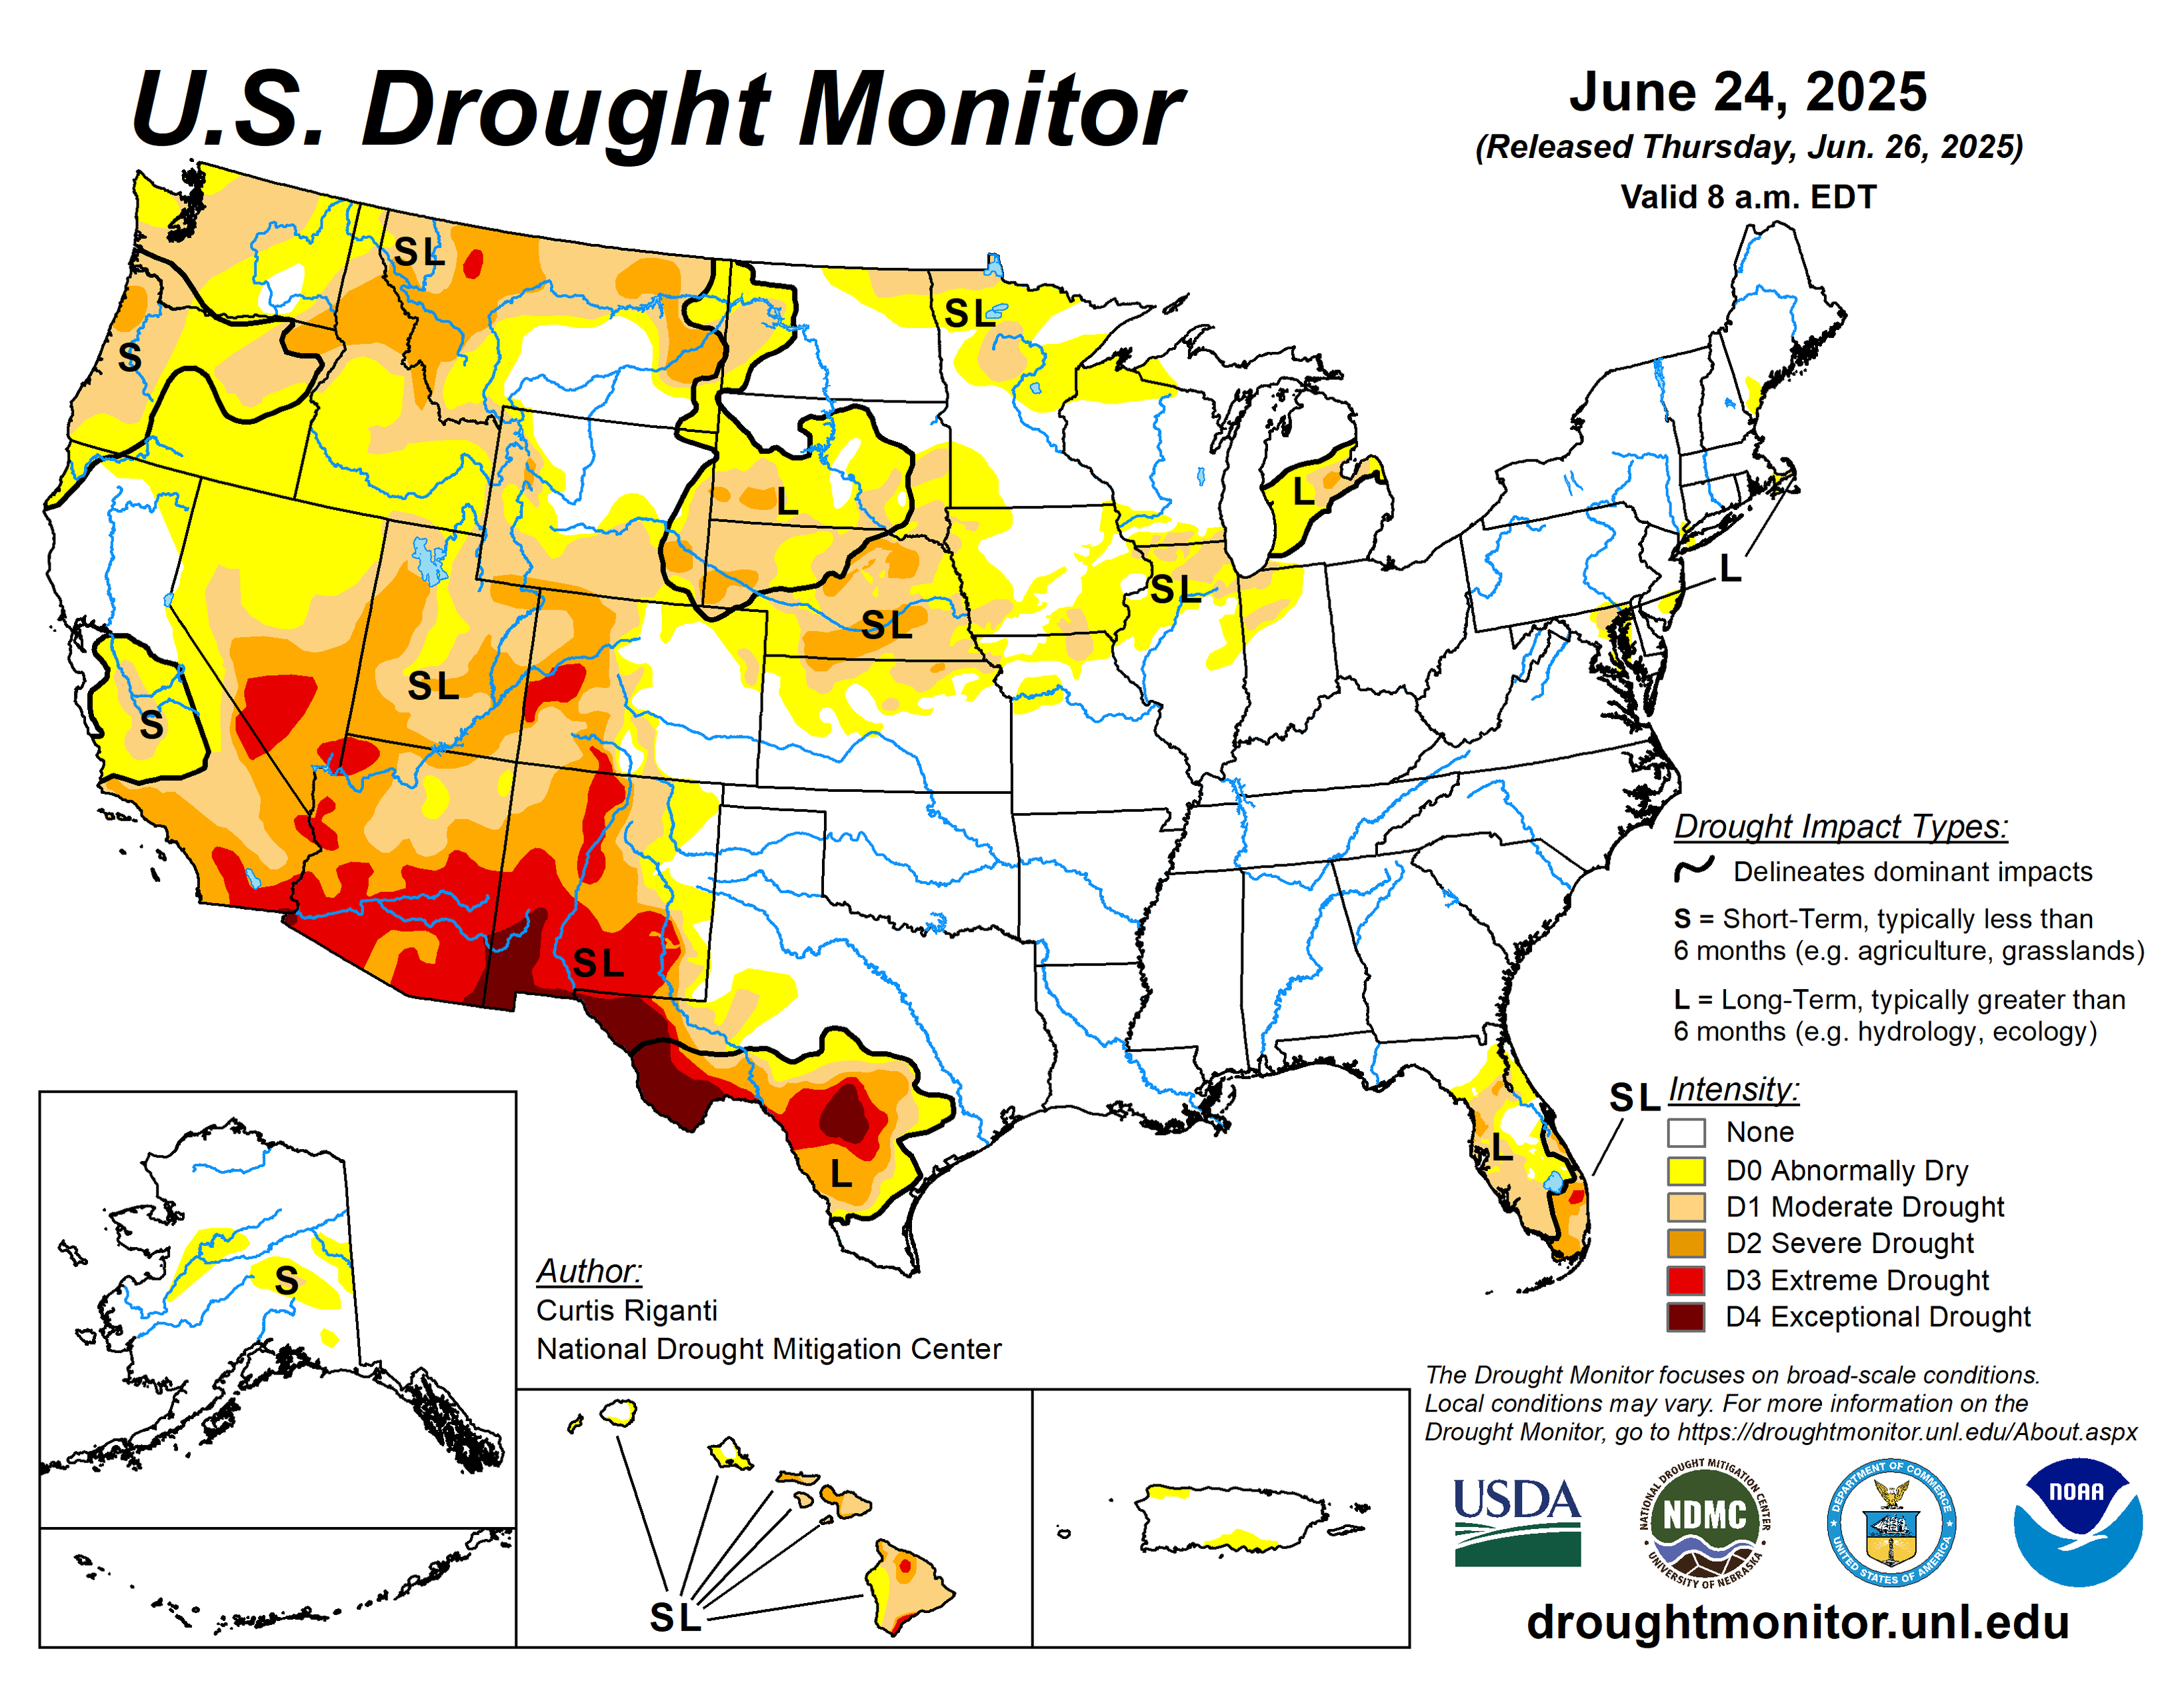
Drought expanded over a broad swath of the Pacific Northwest area with pockets of improvement in the Midwest. Drought covered 30.66% of the continental US, an increase of 0.63 points from last week.
#DroughtMonitor
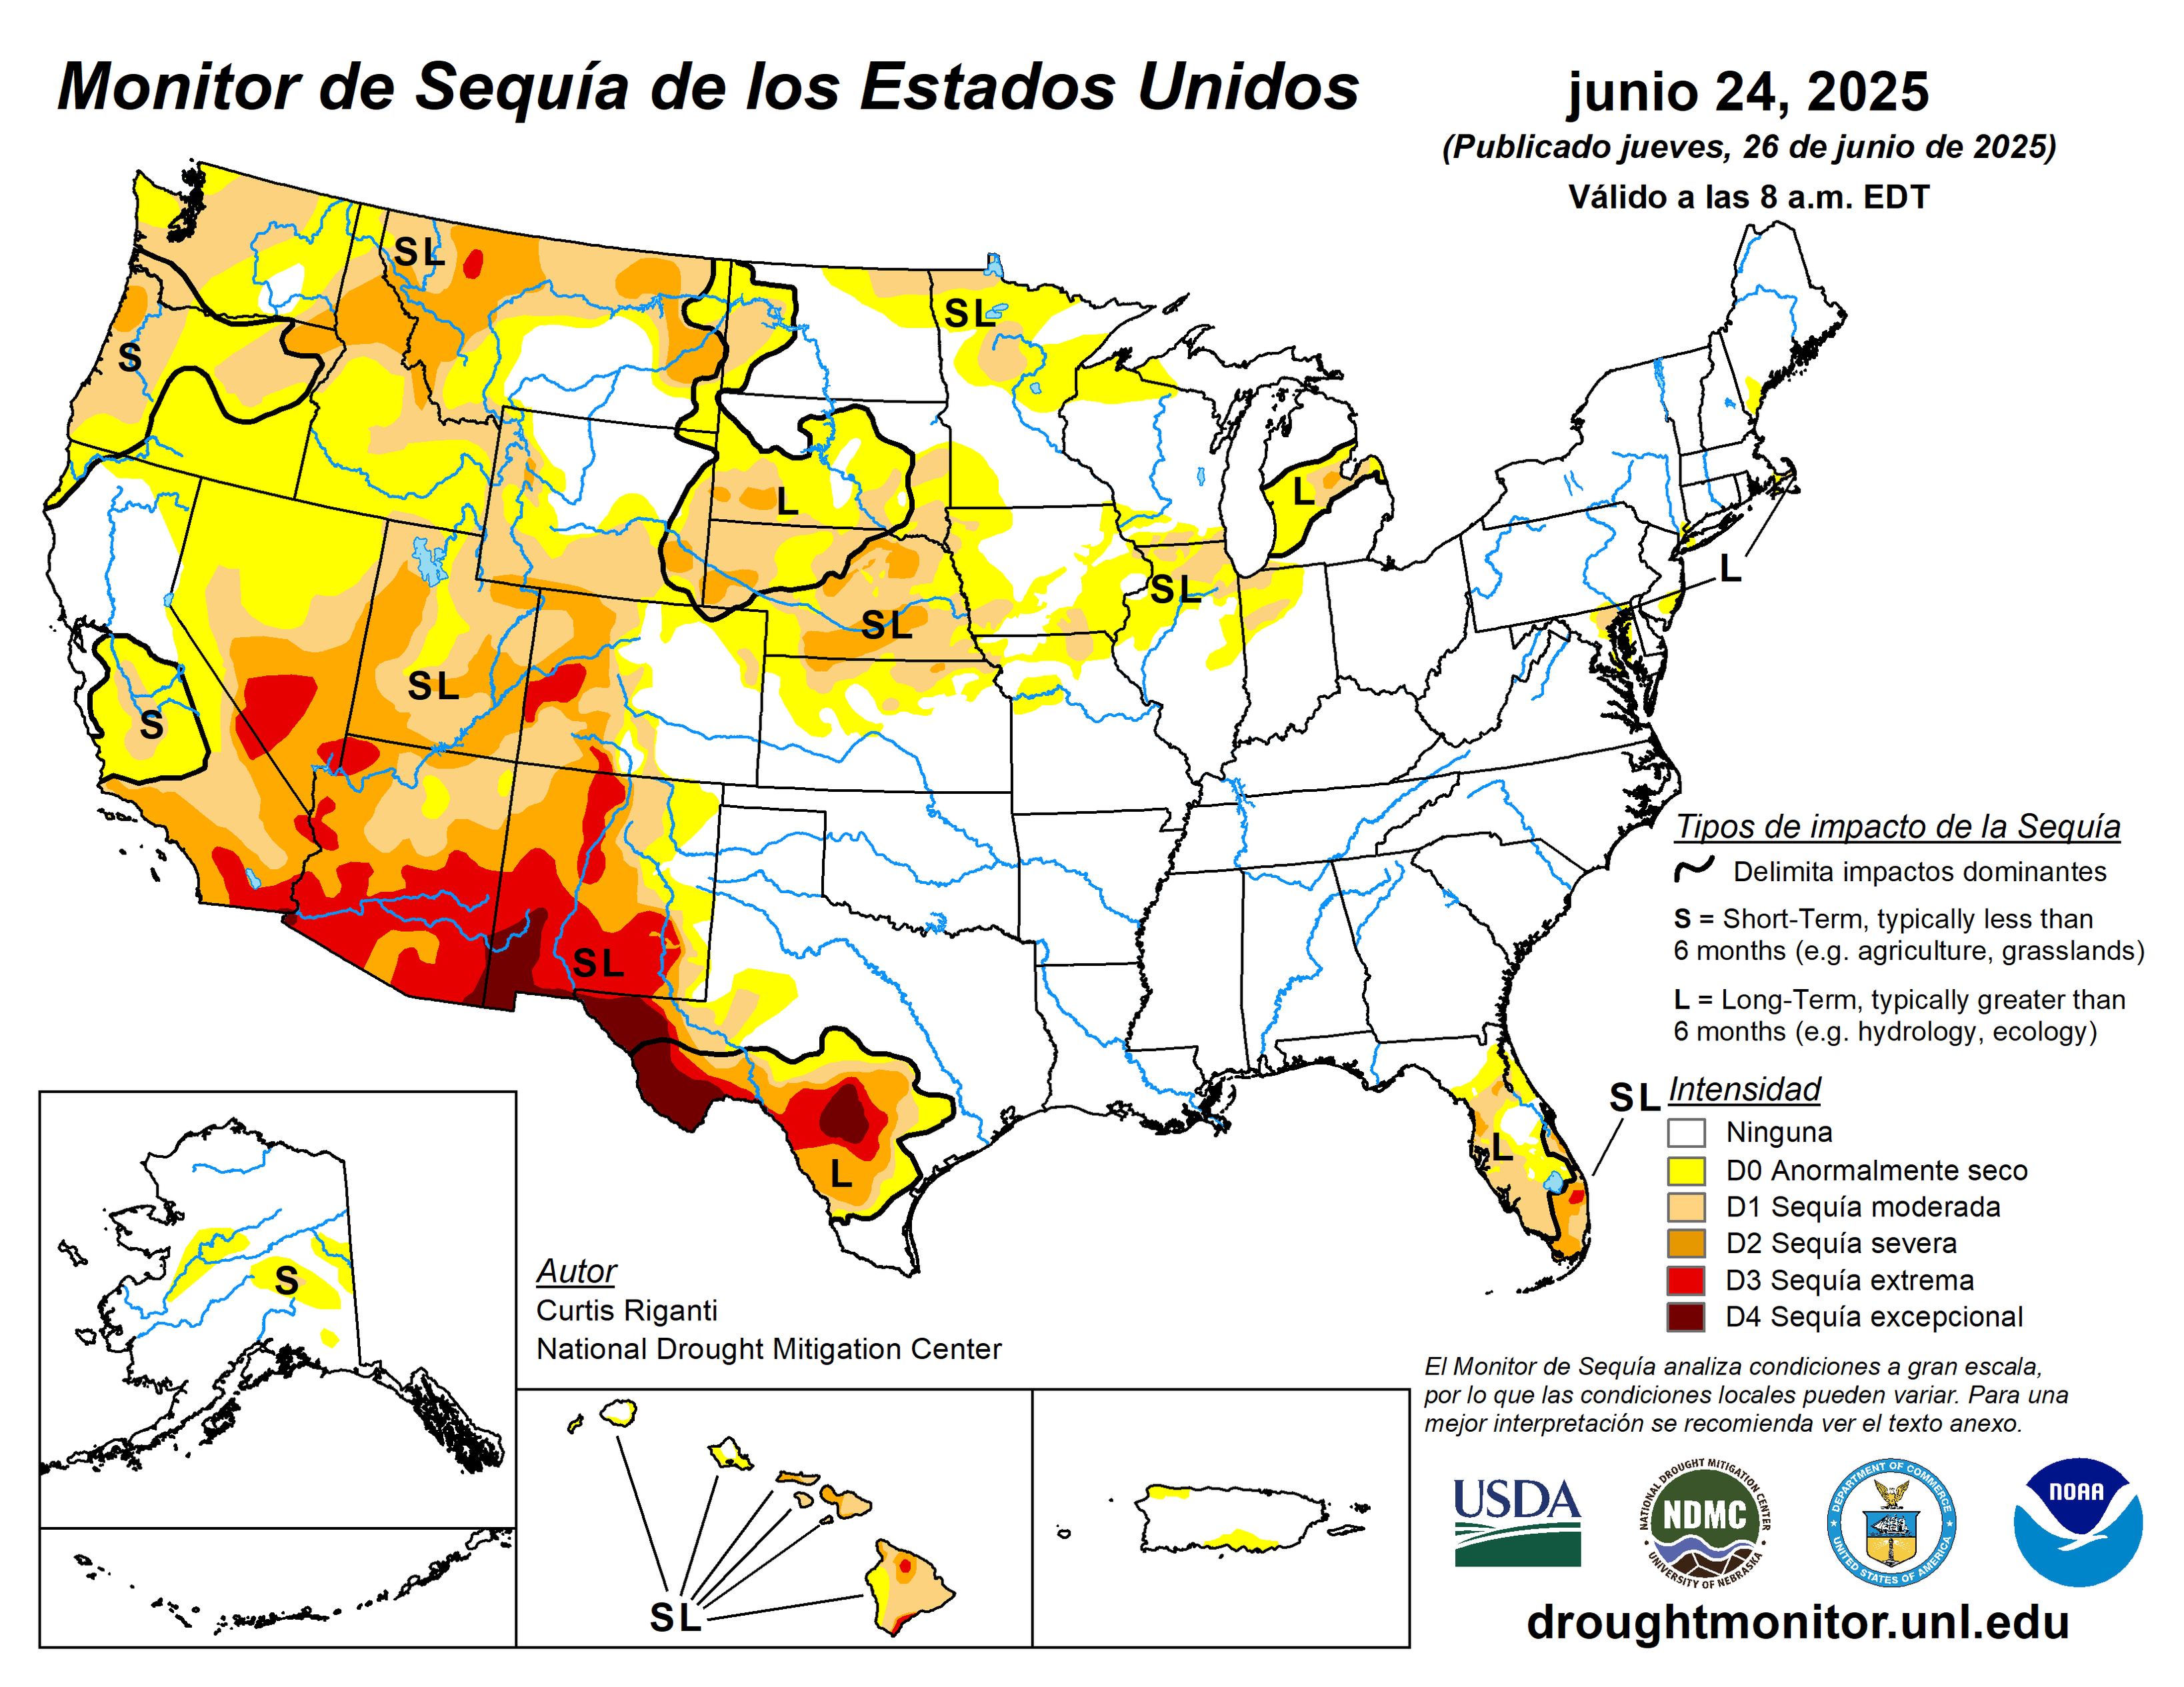
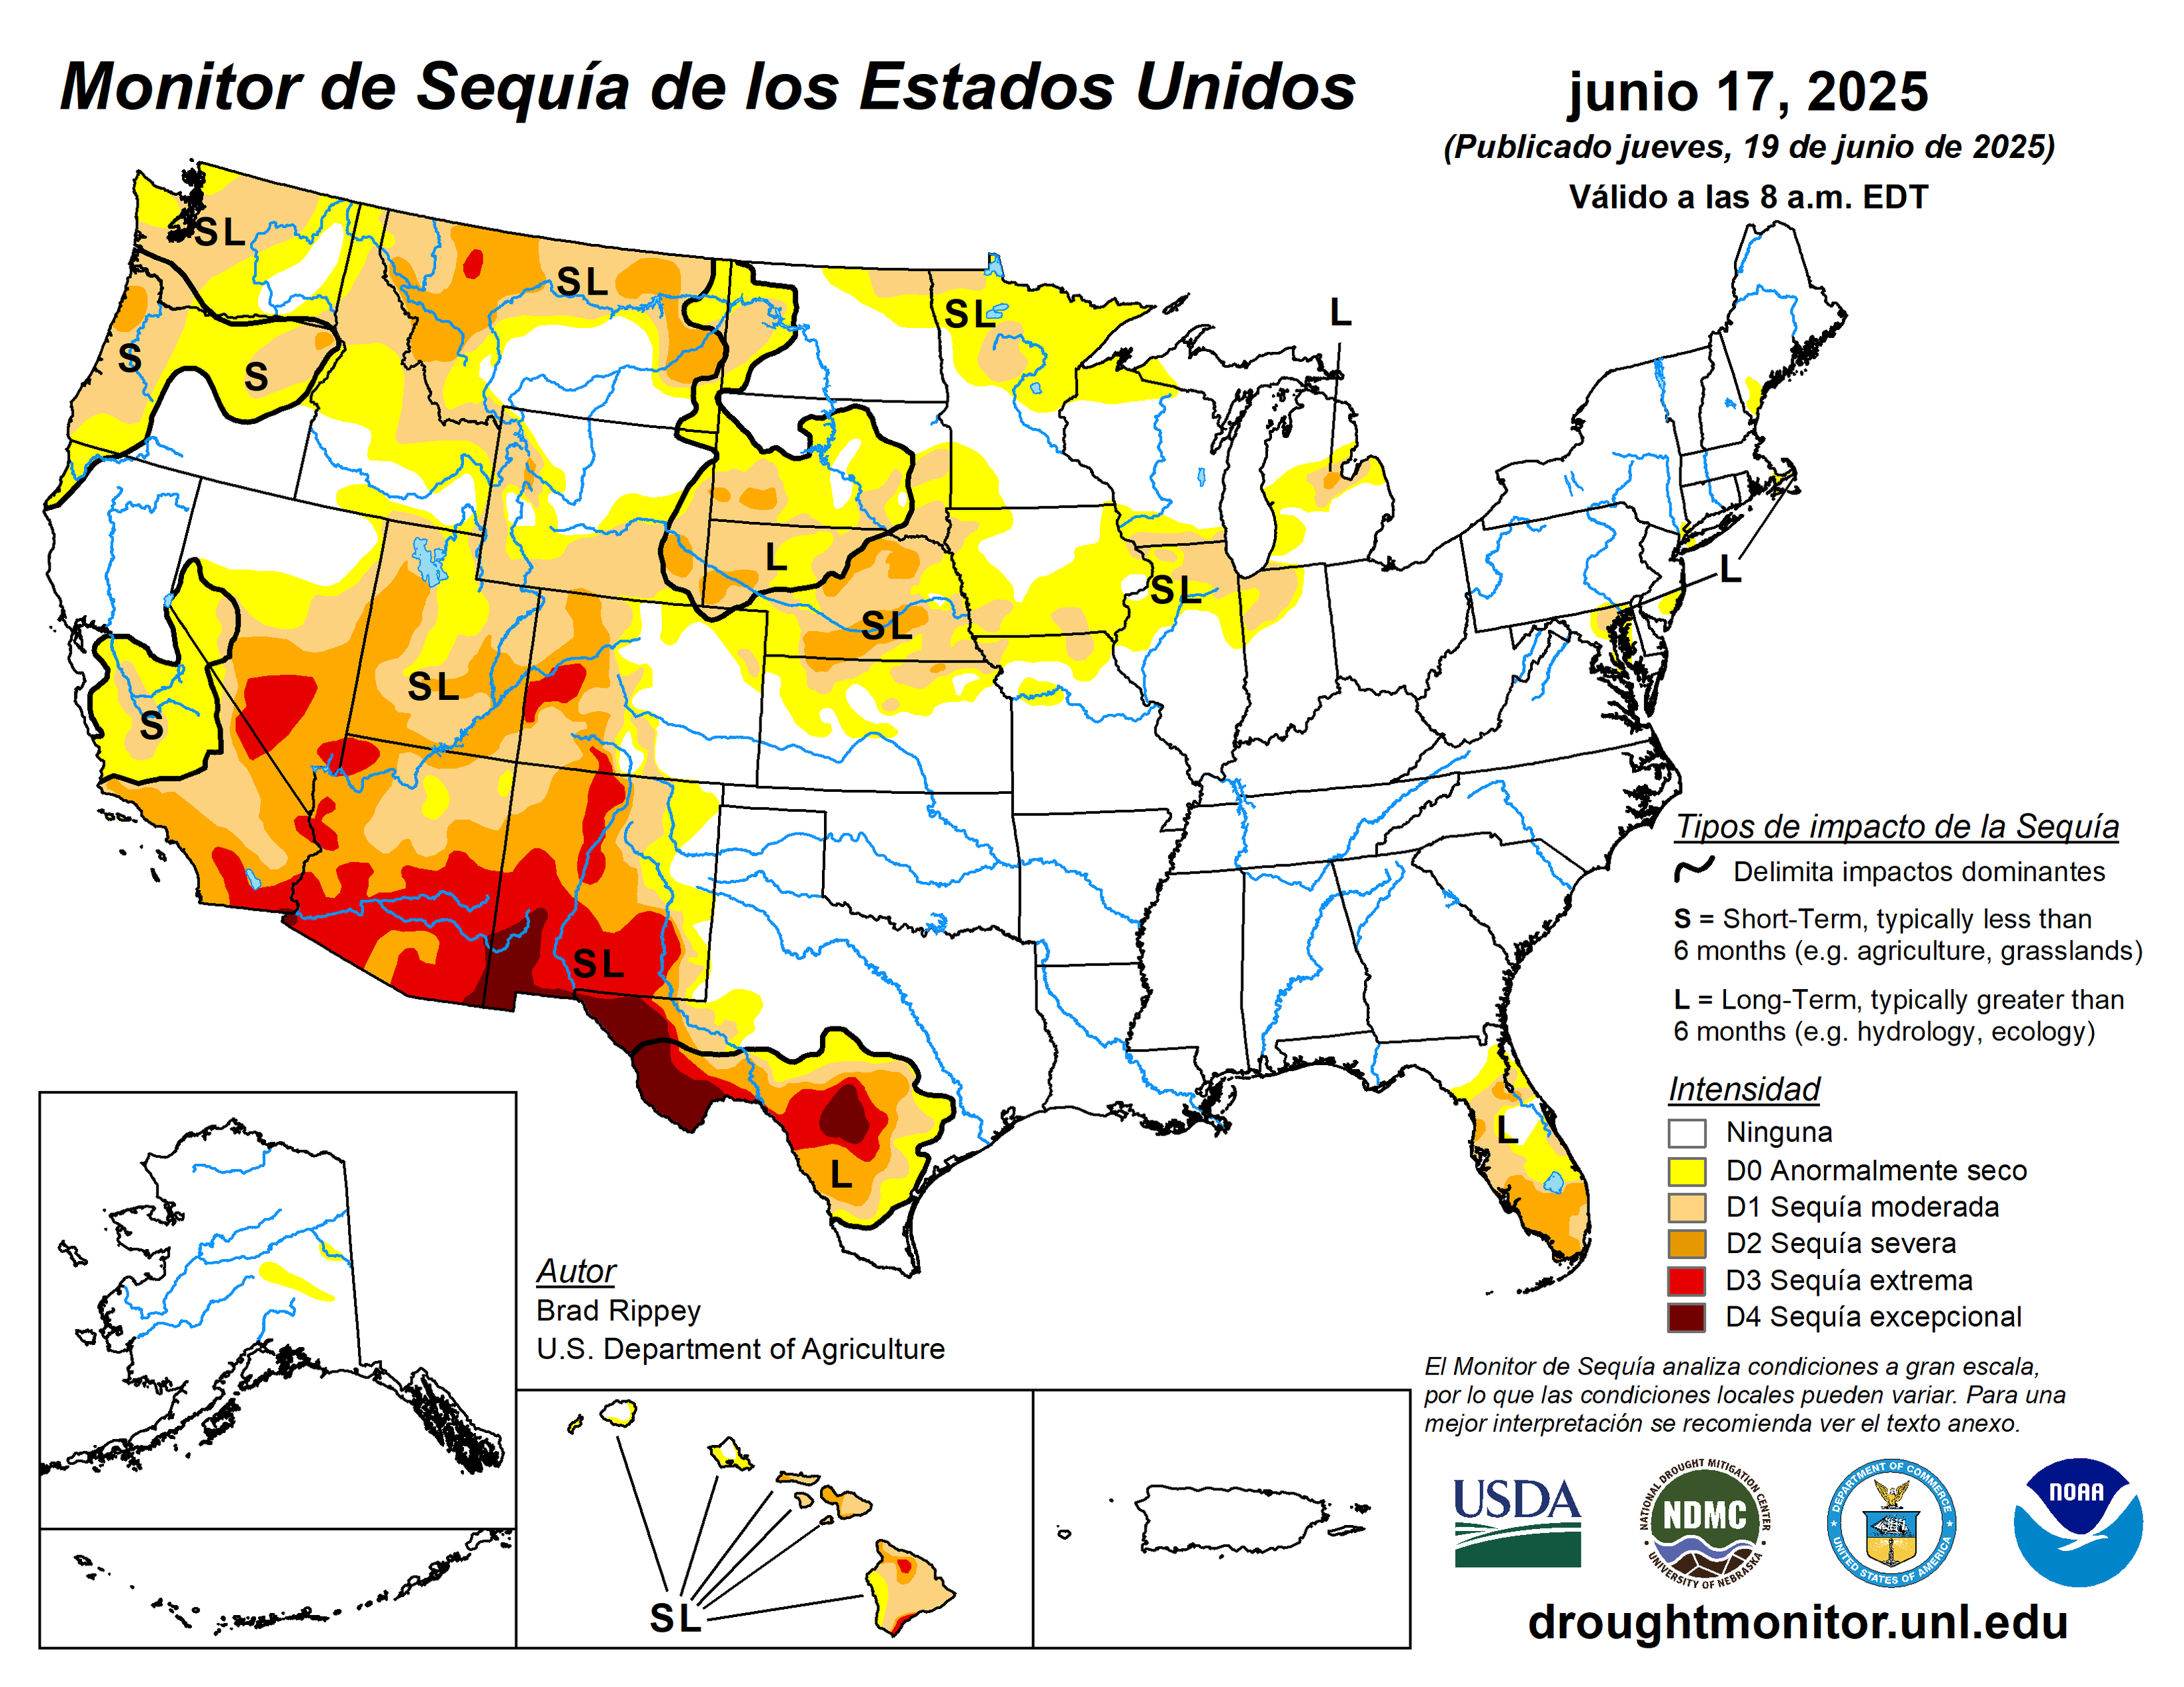
Monitor de Sequía de los Estados Unidos
Mapa publicado: junio 26, 2025
The June Dry Horizons roundup of drought research and news is now available. https://drought.unl.edu/Publications/DryHorizons.aspx
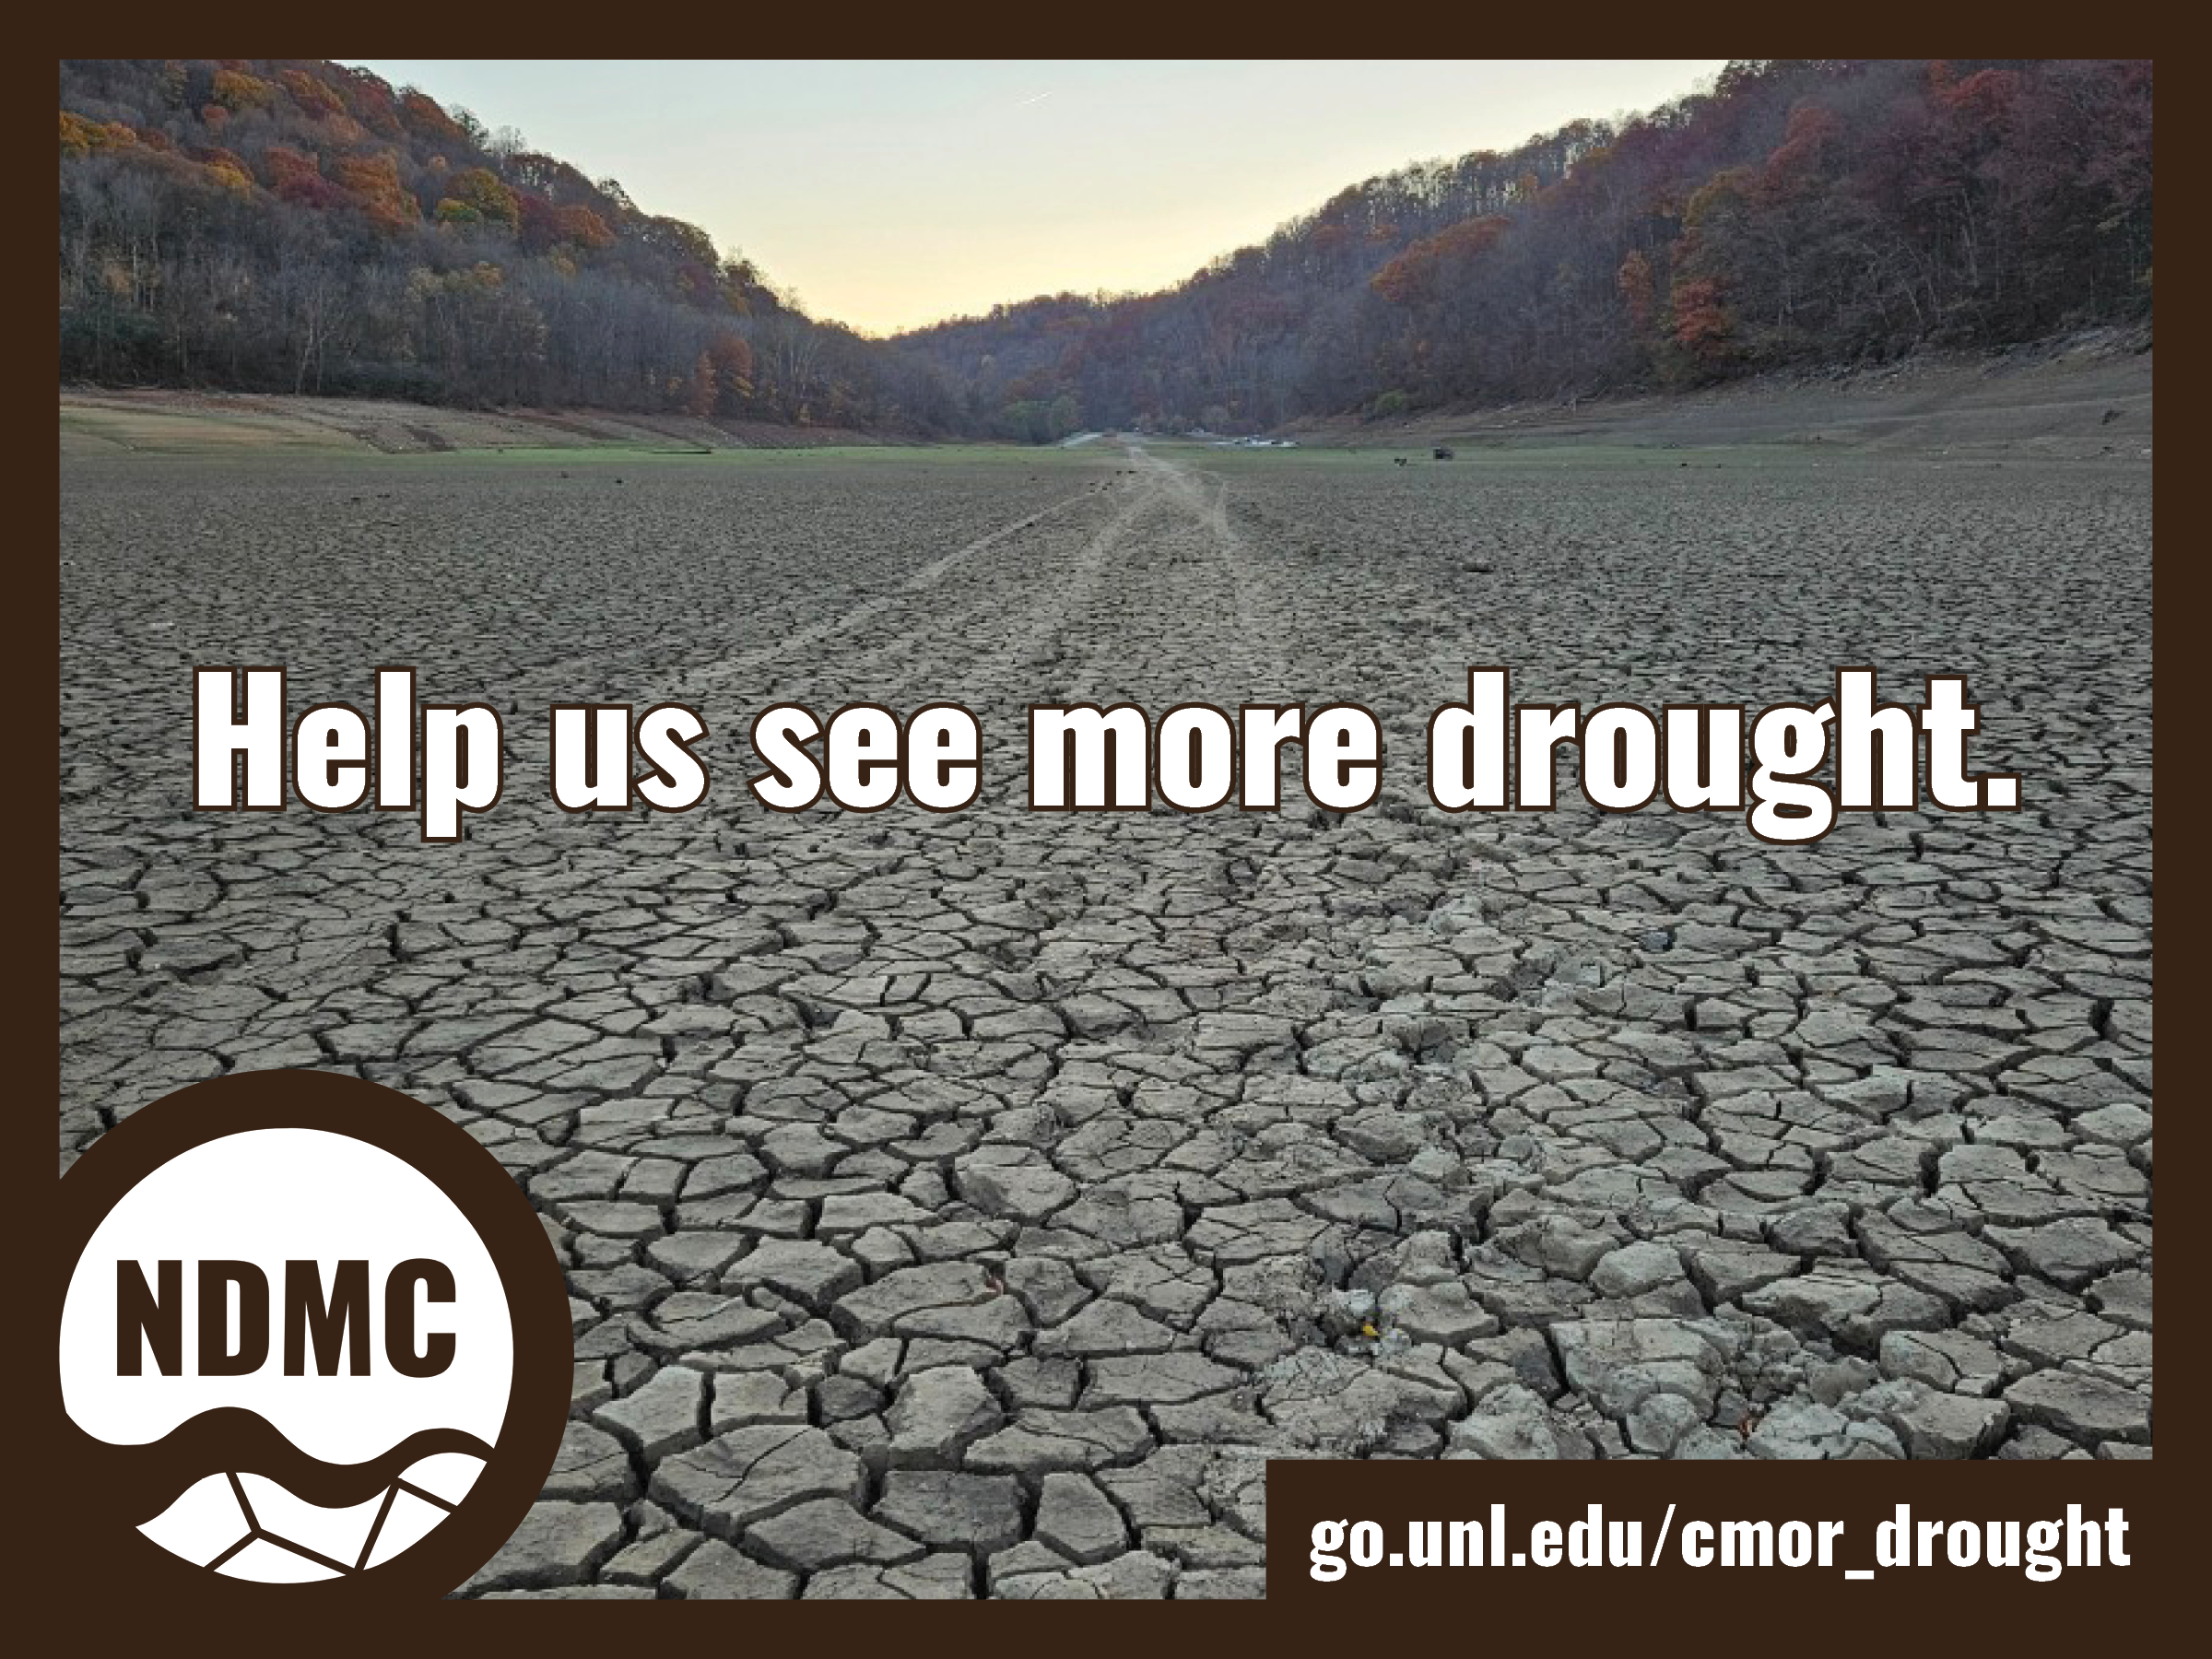
Join the CMOR Challenge during the 2025 growing season! Share reports and photos every week showing how wet or dry conditions are in your area. https://go.unl.edu/cmor_drought

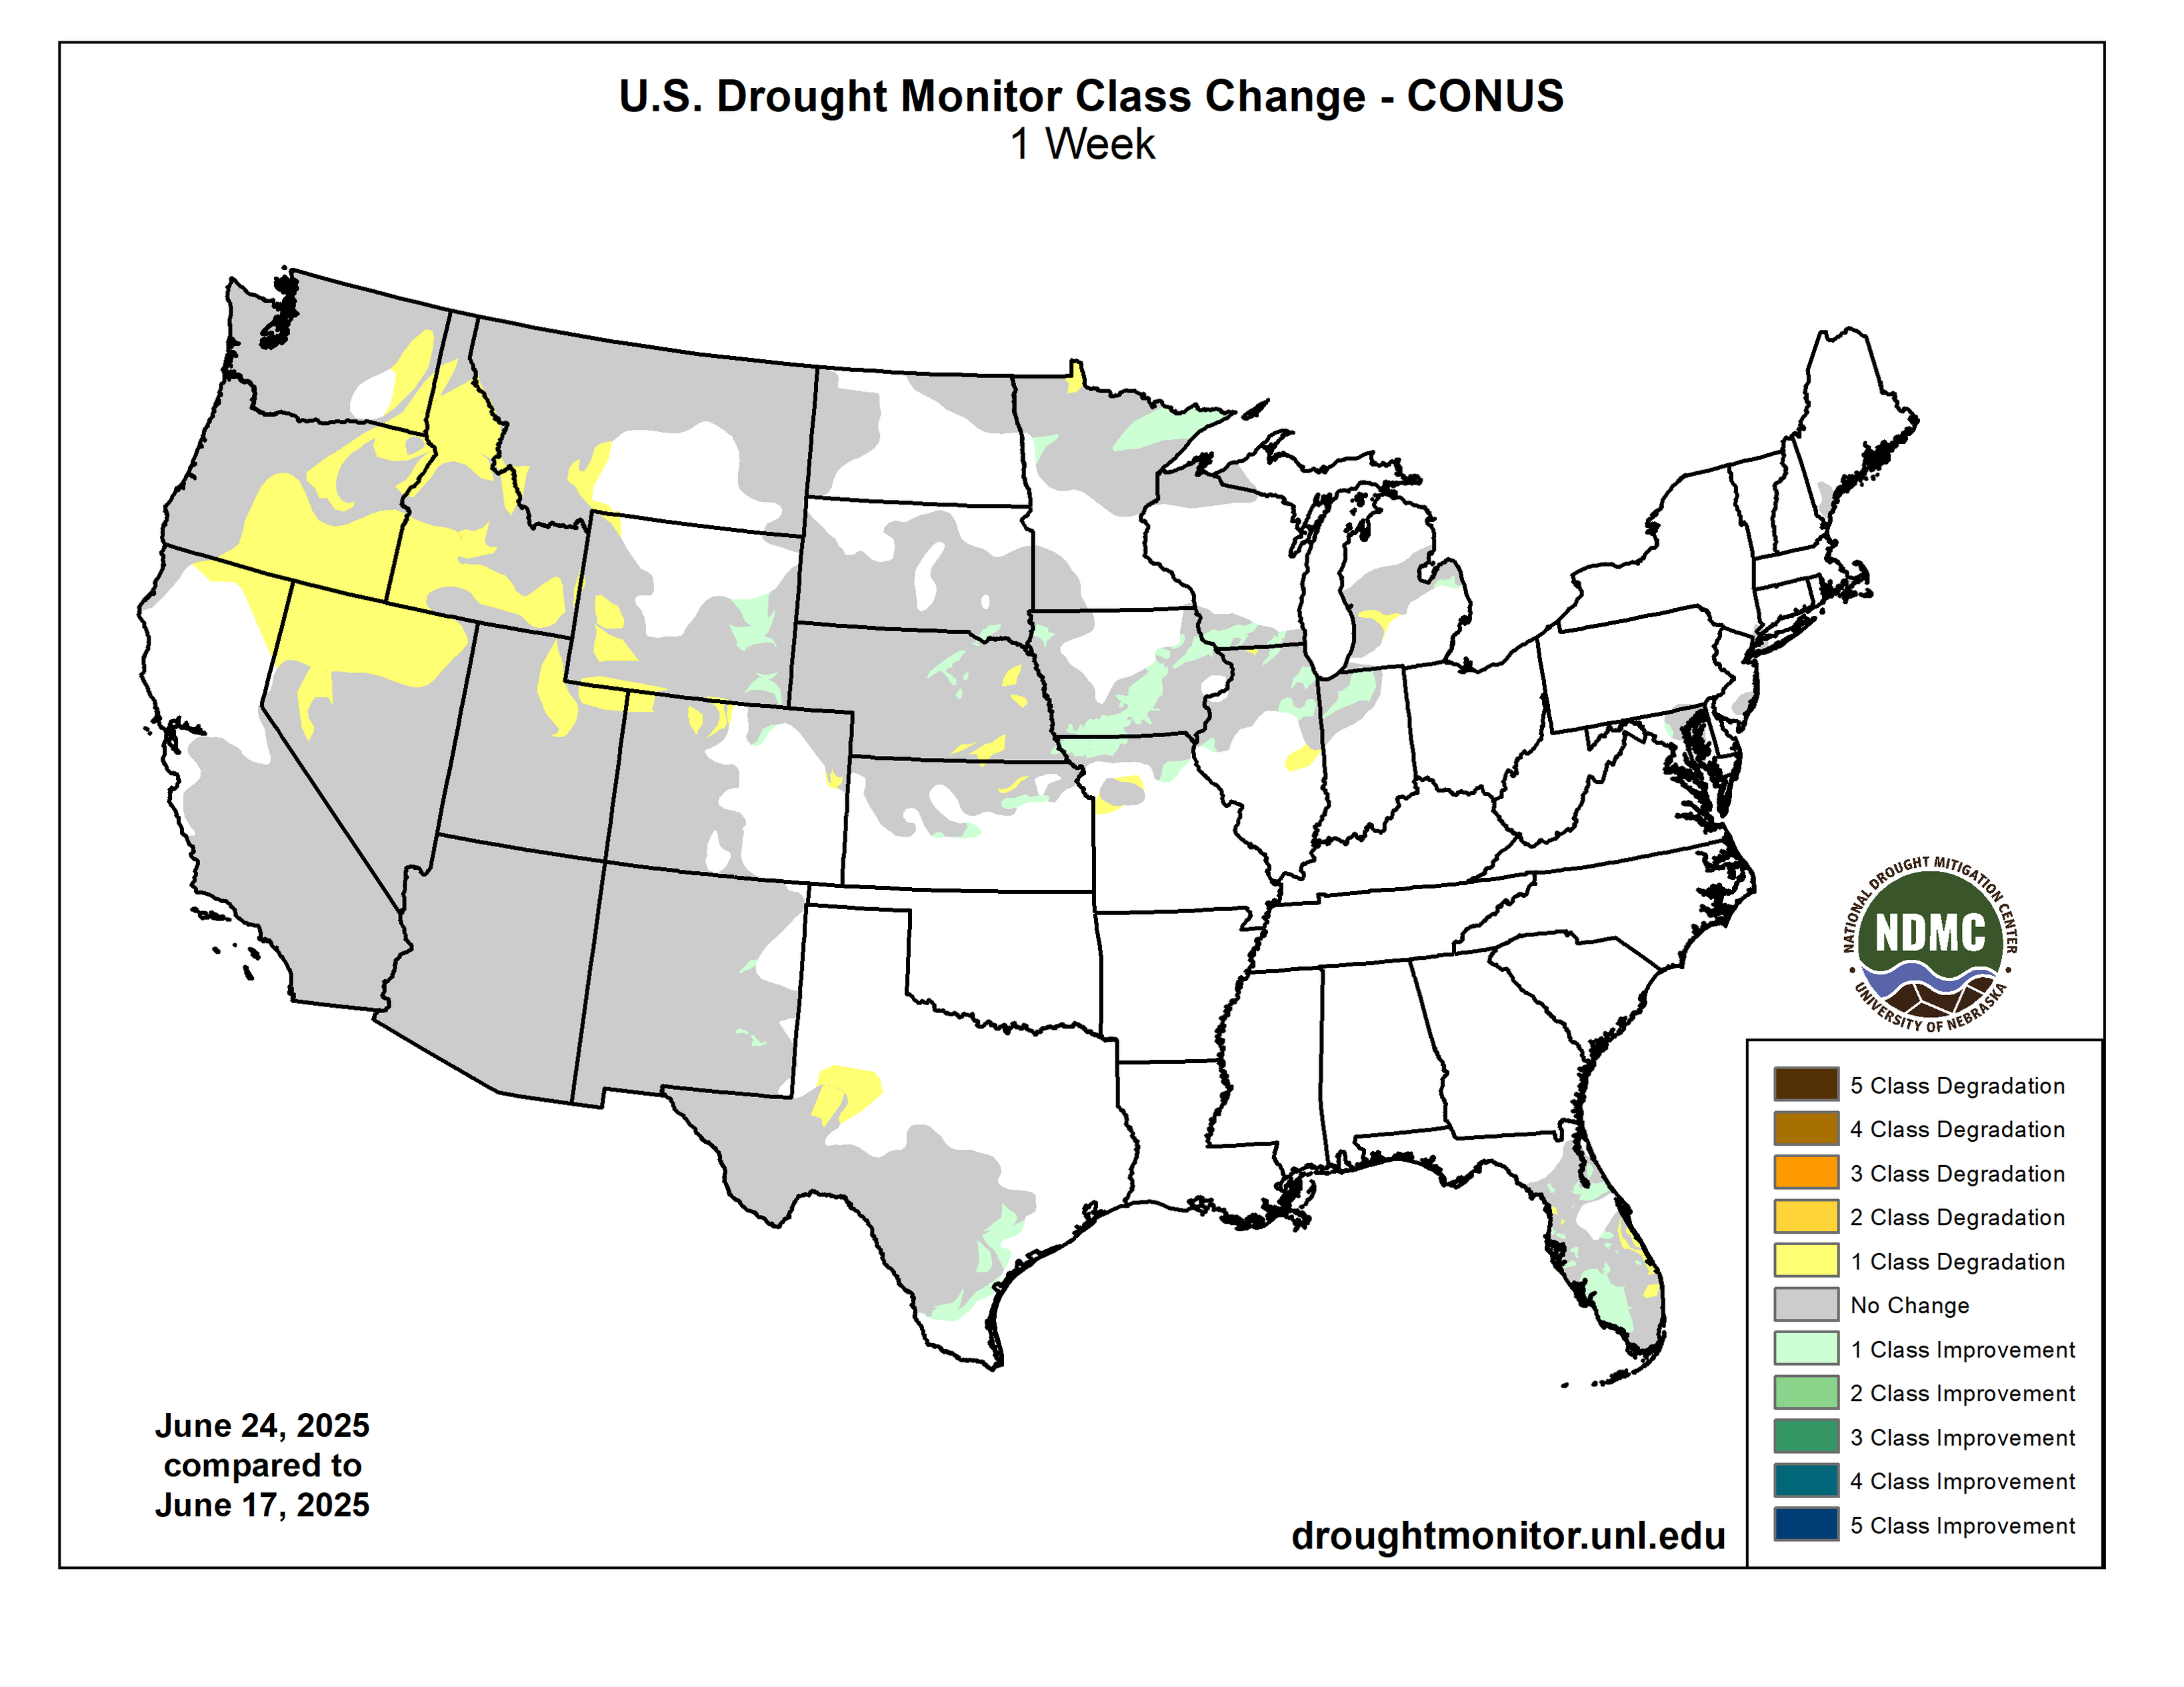
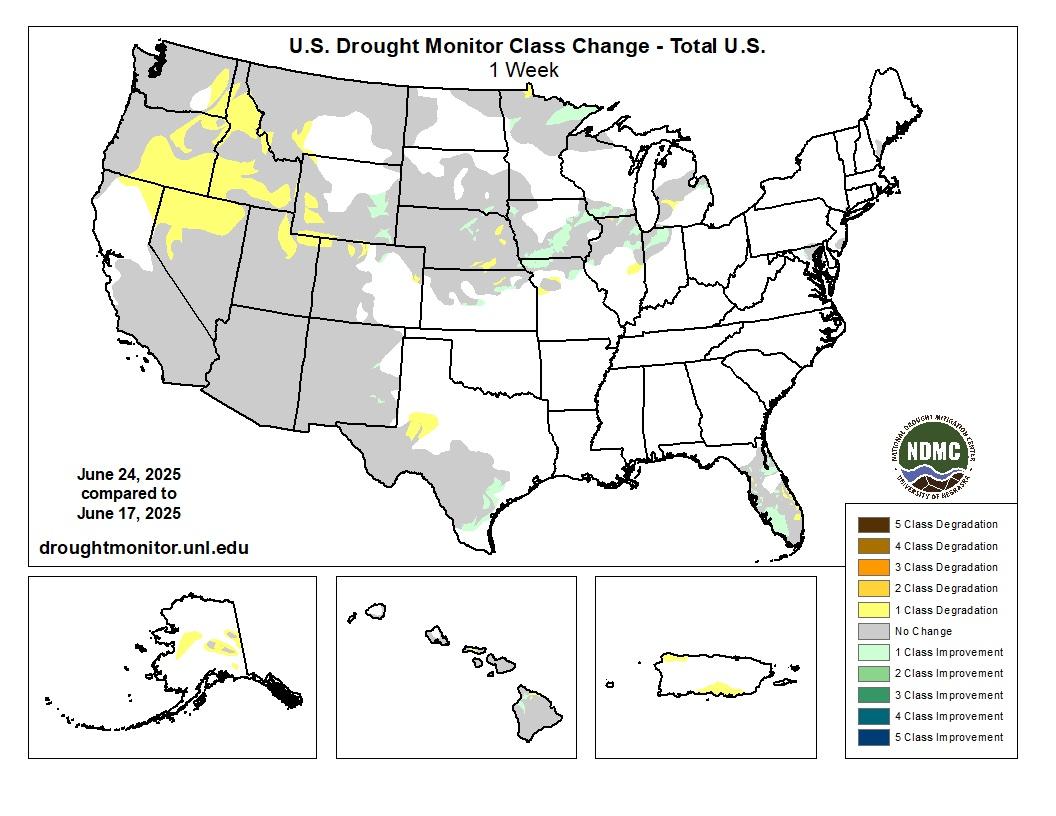
Degradations occurred across parts of the Pacific Northwest, plus western Montana and northern Nevada and Utah. Puerto Rico and Alaska also saw degradations. Mixed conditions occurred in parts of the High Plains, Midwest, Texas, Florida and Hawaii. Small areas of improvement occurred in Maryland and New Mexico.
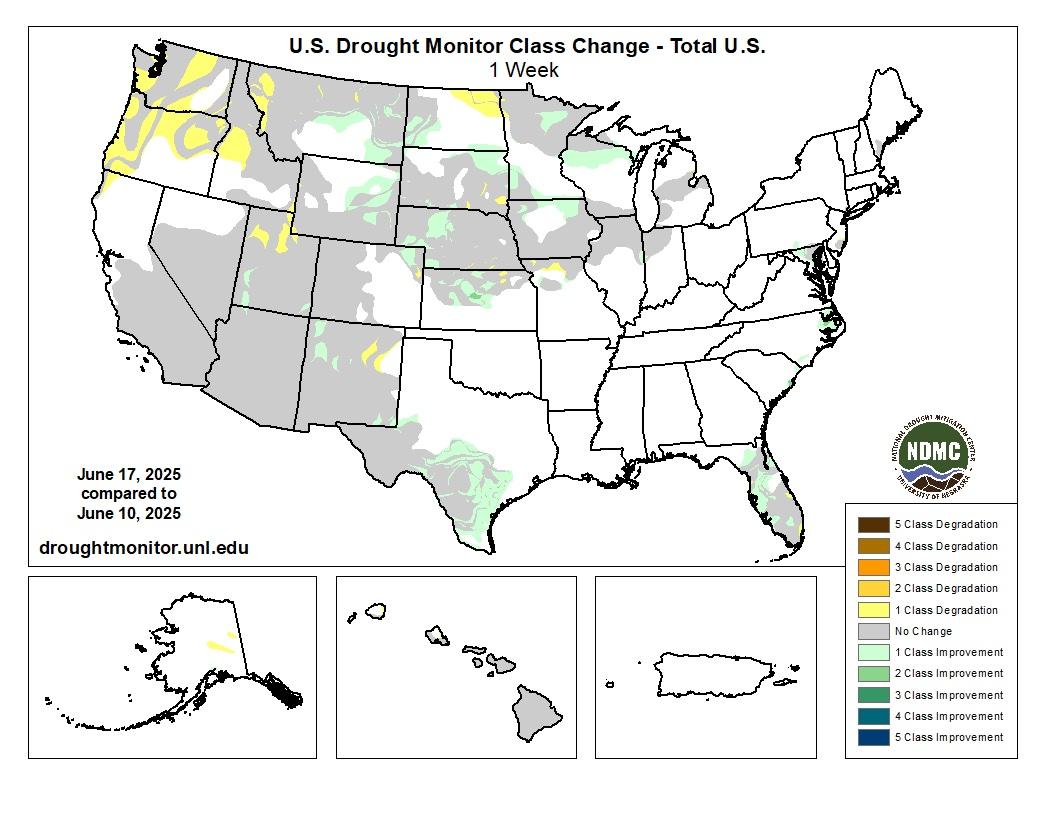
See more change maps: https://droughtmonitor.unl.edu/Maps/ChangeMaps.aspx
US Drought Monitor 6-26-25
For the 50 states and Puerto Rico, the US Drought Monitor shows 25.83% in moderate drought or worse, compared to 25.21% last week.
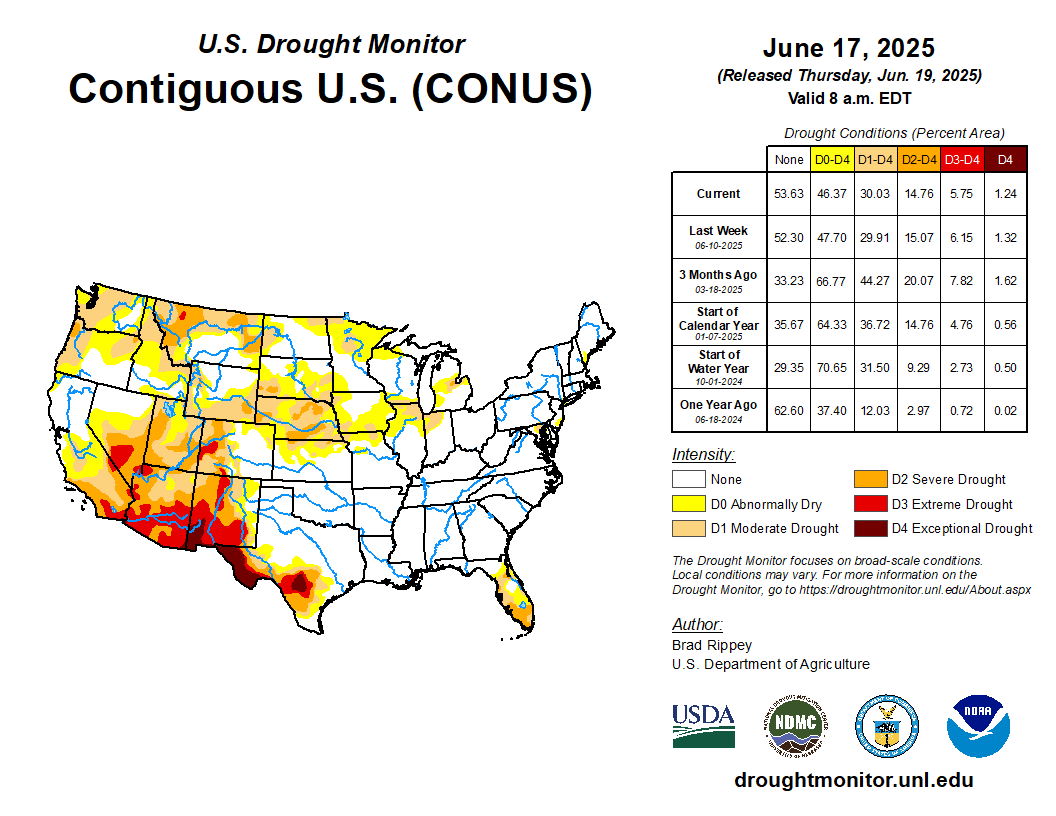
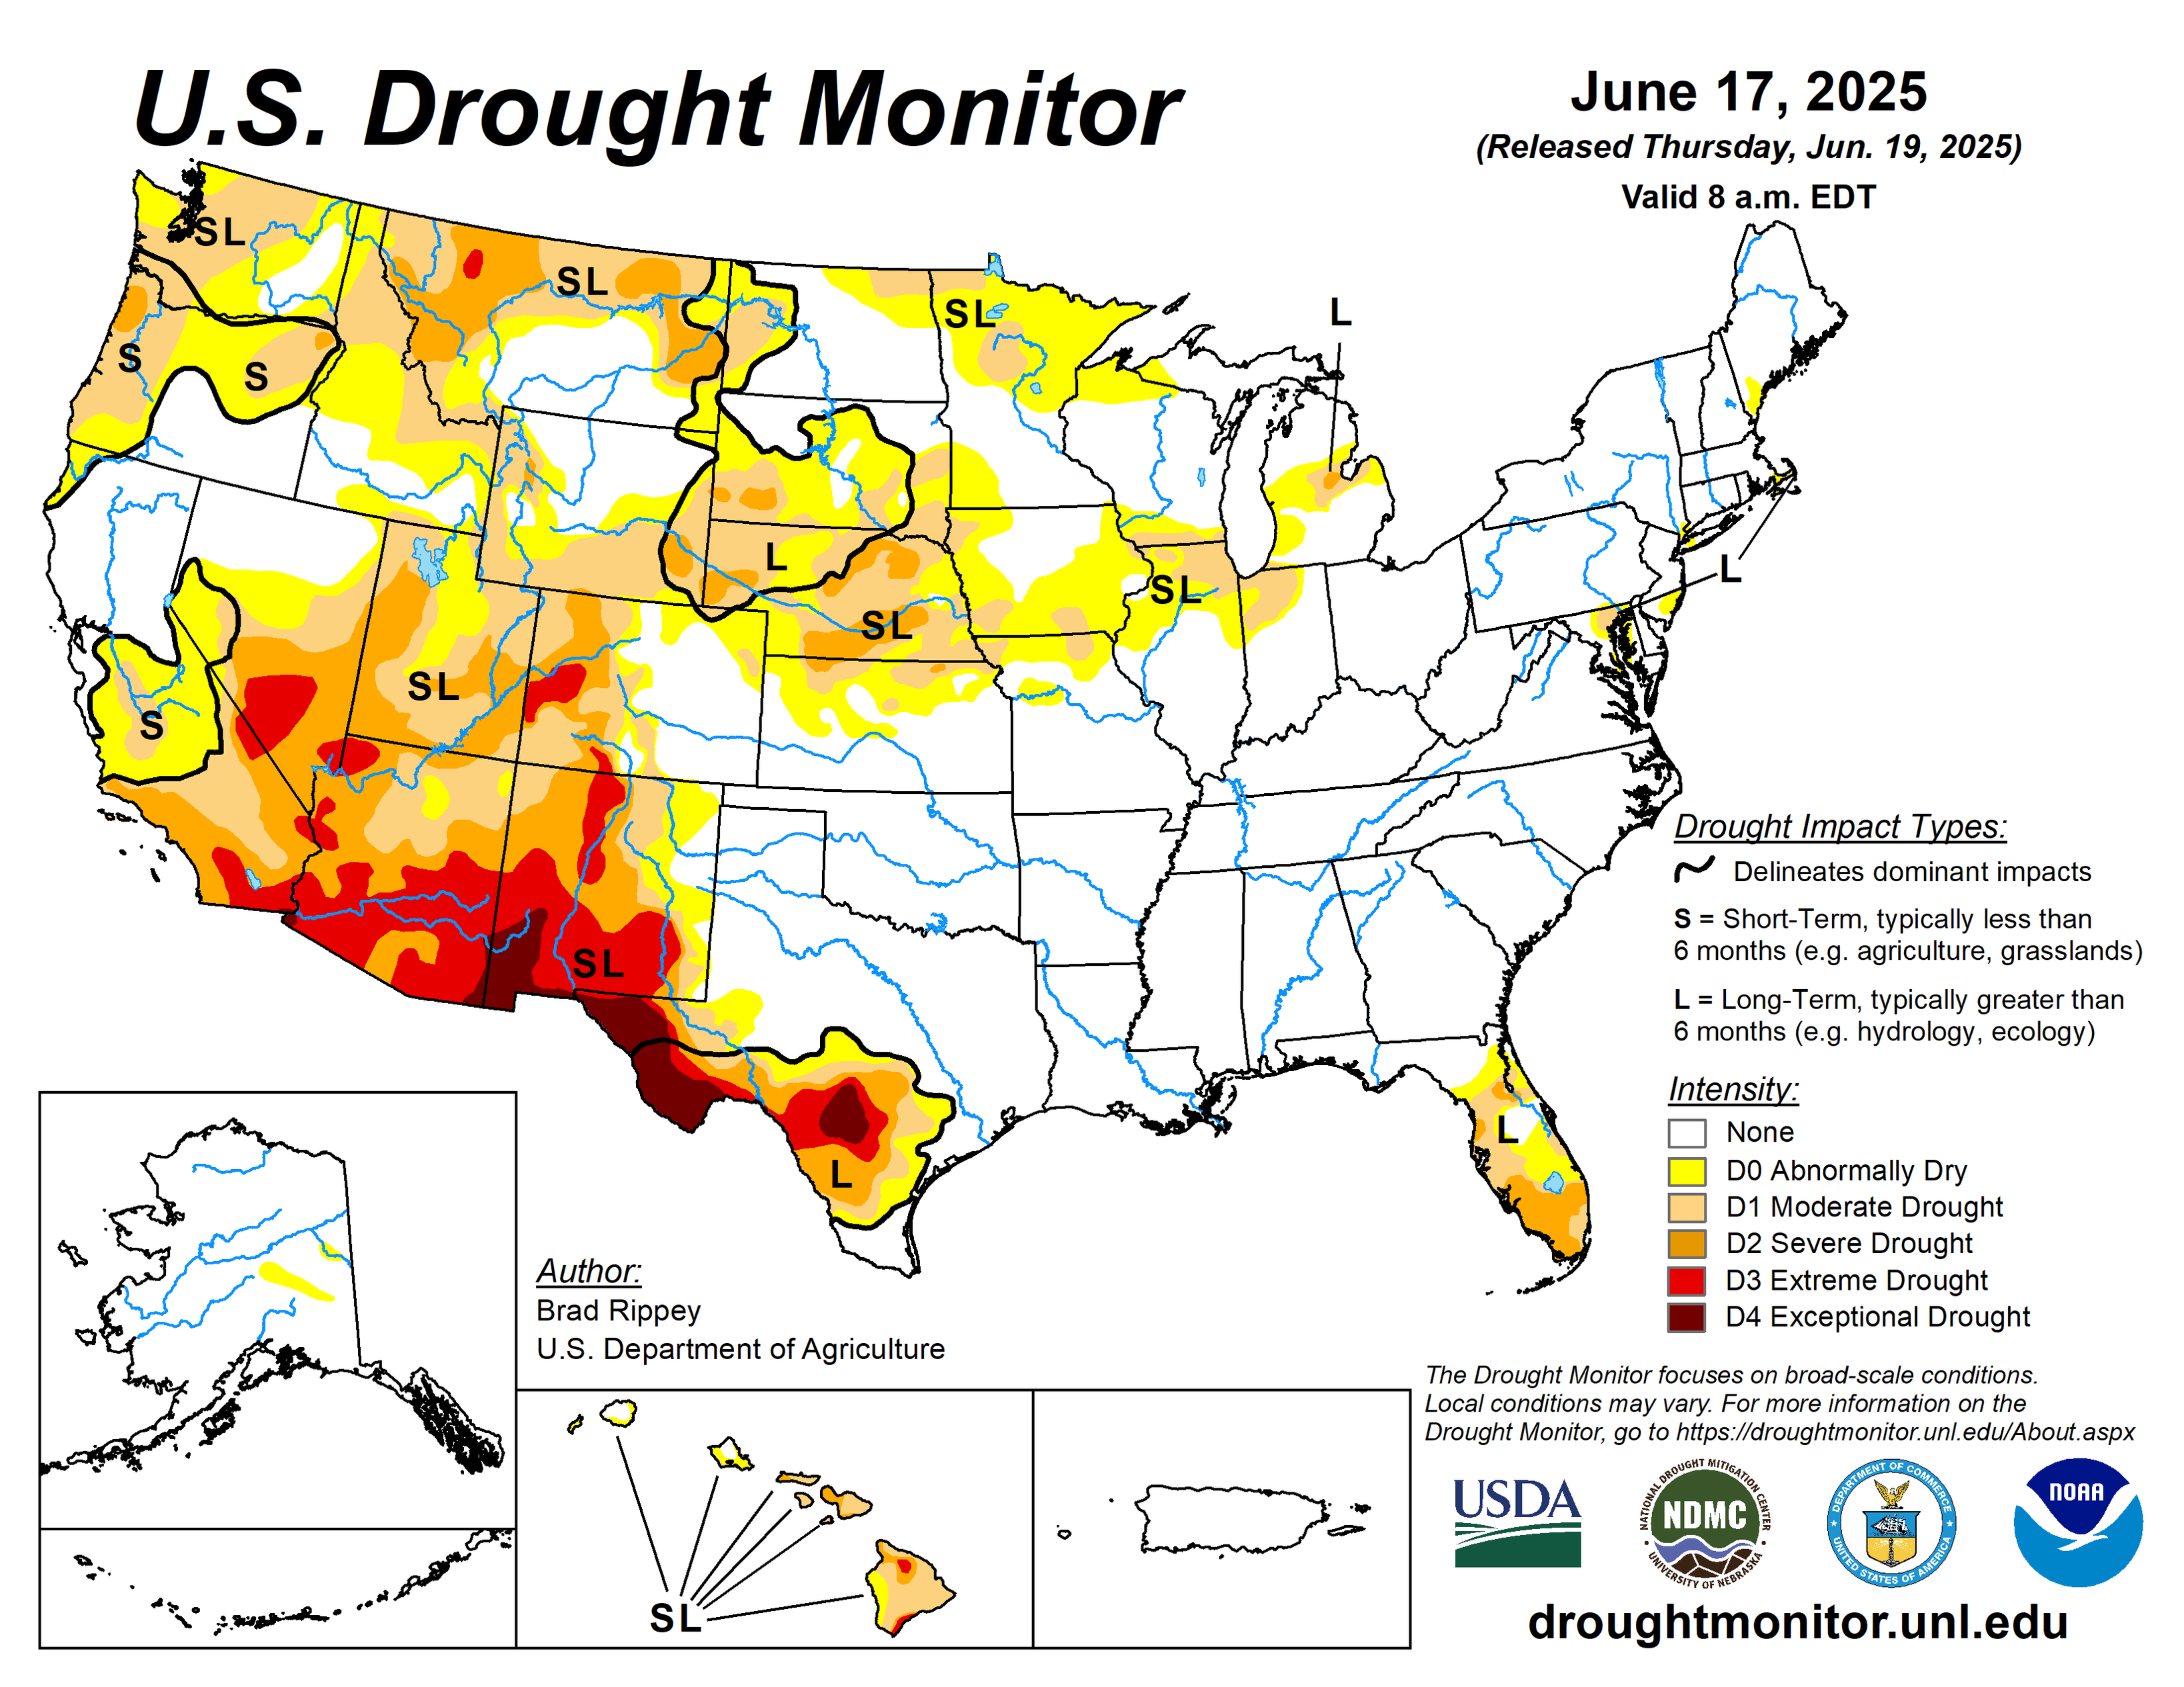
Drought intensified in parts of the Pacific Northwest and North Dakota and eased in pockets of the north central US, Texas and Florida. Drought covered 30.03% of the continental US, up from 29.91% last week.
Monitor de Sequía de los Estados Unidos
Mapa publicado: junio 19, 2025
Join the CMOR Challenge during the 2025 growing season! Share reports and photos every week showing how wet or dry conditions are in your area. https://go.unl.edu/cmor_drought
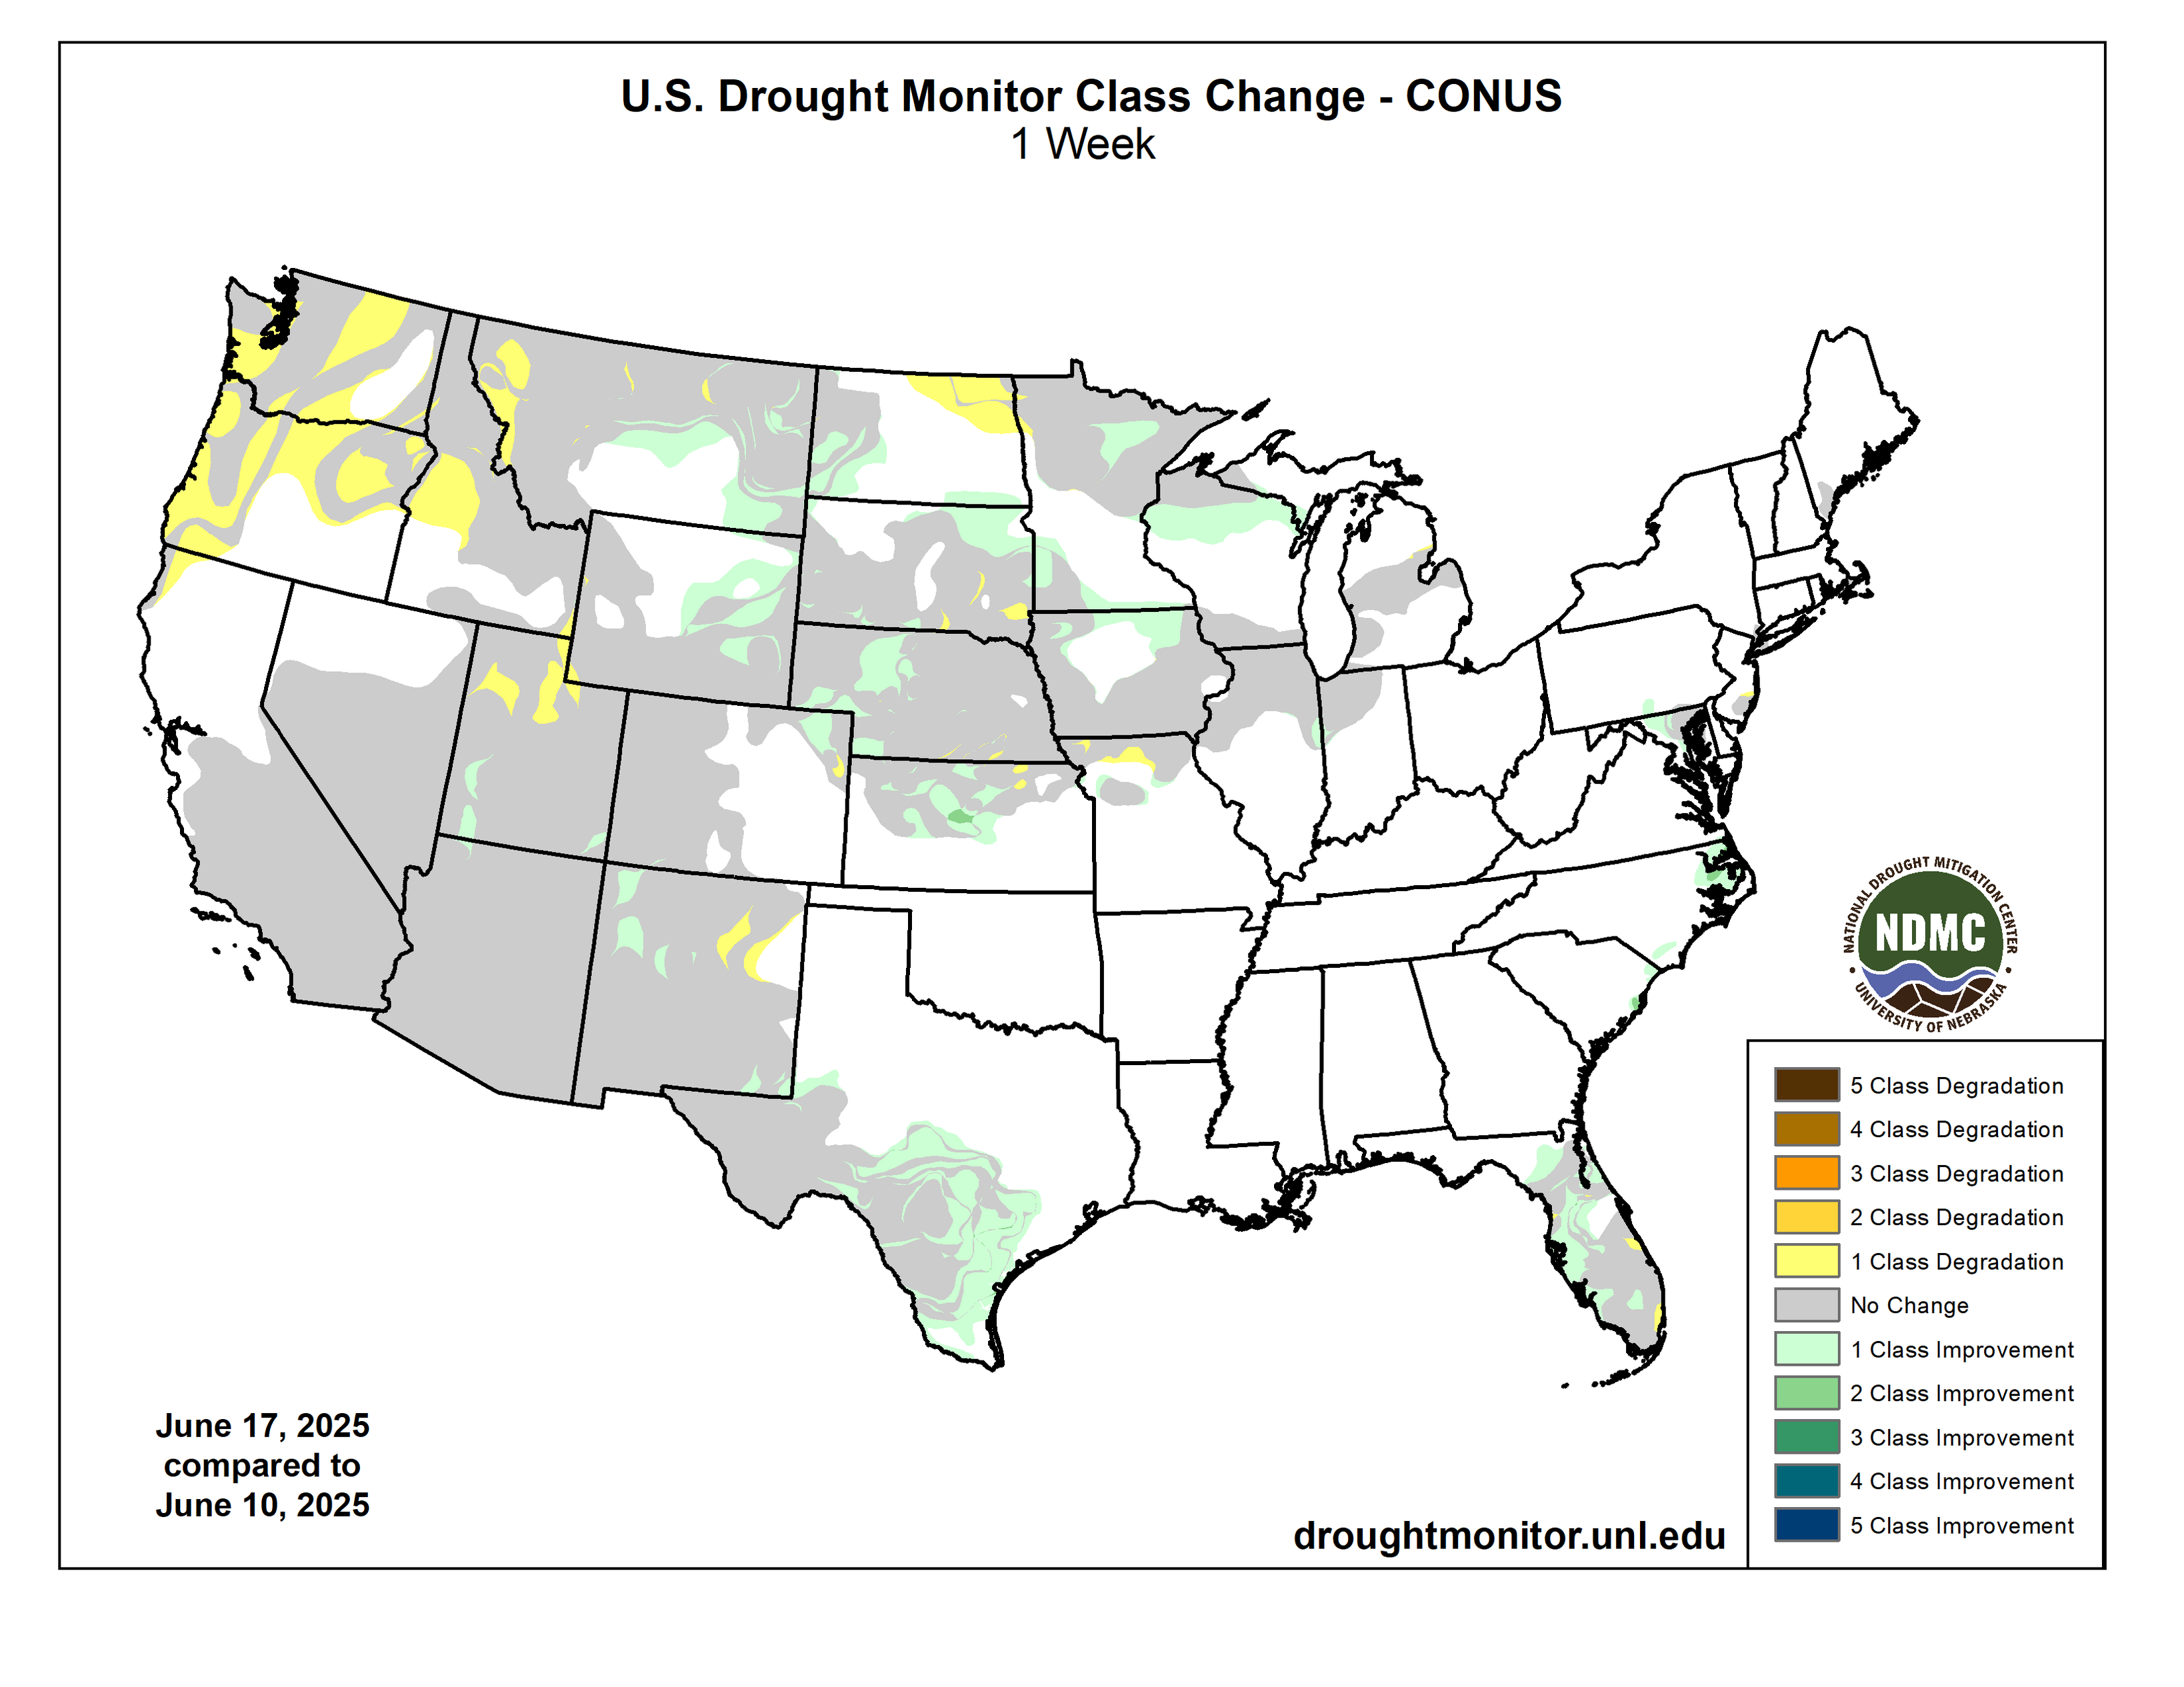
Improvements occurred in parts of Texas and the Mid-Atlantic, with an area of degradation in New Jersey. Degradations occurred in parts of the Pacific Northwest and Alaska. Mixed conditions occurred in parts of the Southwest, High Plains, Midwest and Florida.
See more change maps: https://droughtmonitor.unl.edu/Maps/ChangeMaps.aspx
US Drought Monitor 6-19-25
For the 50 states and Puerto Rico, the US Drought Monitor shows 25.21% in moderate drought or worse, compared to 25.12% last week.
Monitor de Sequía de los Estados Unidos
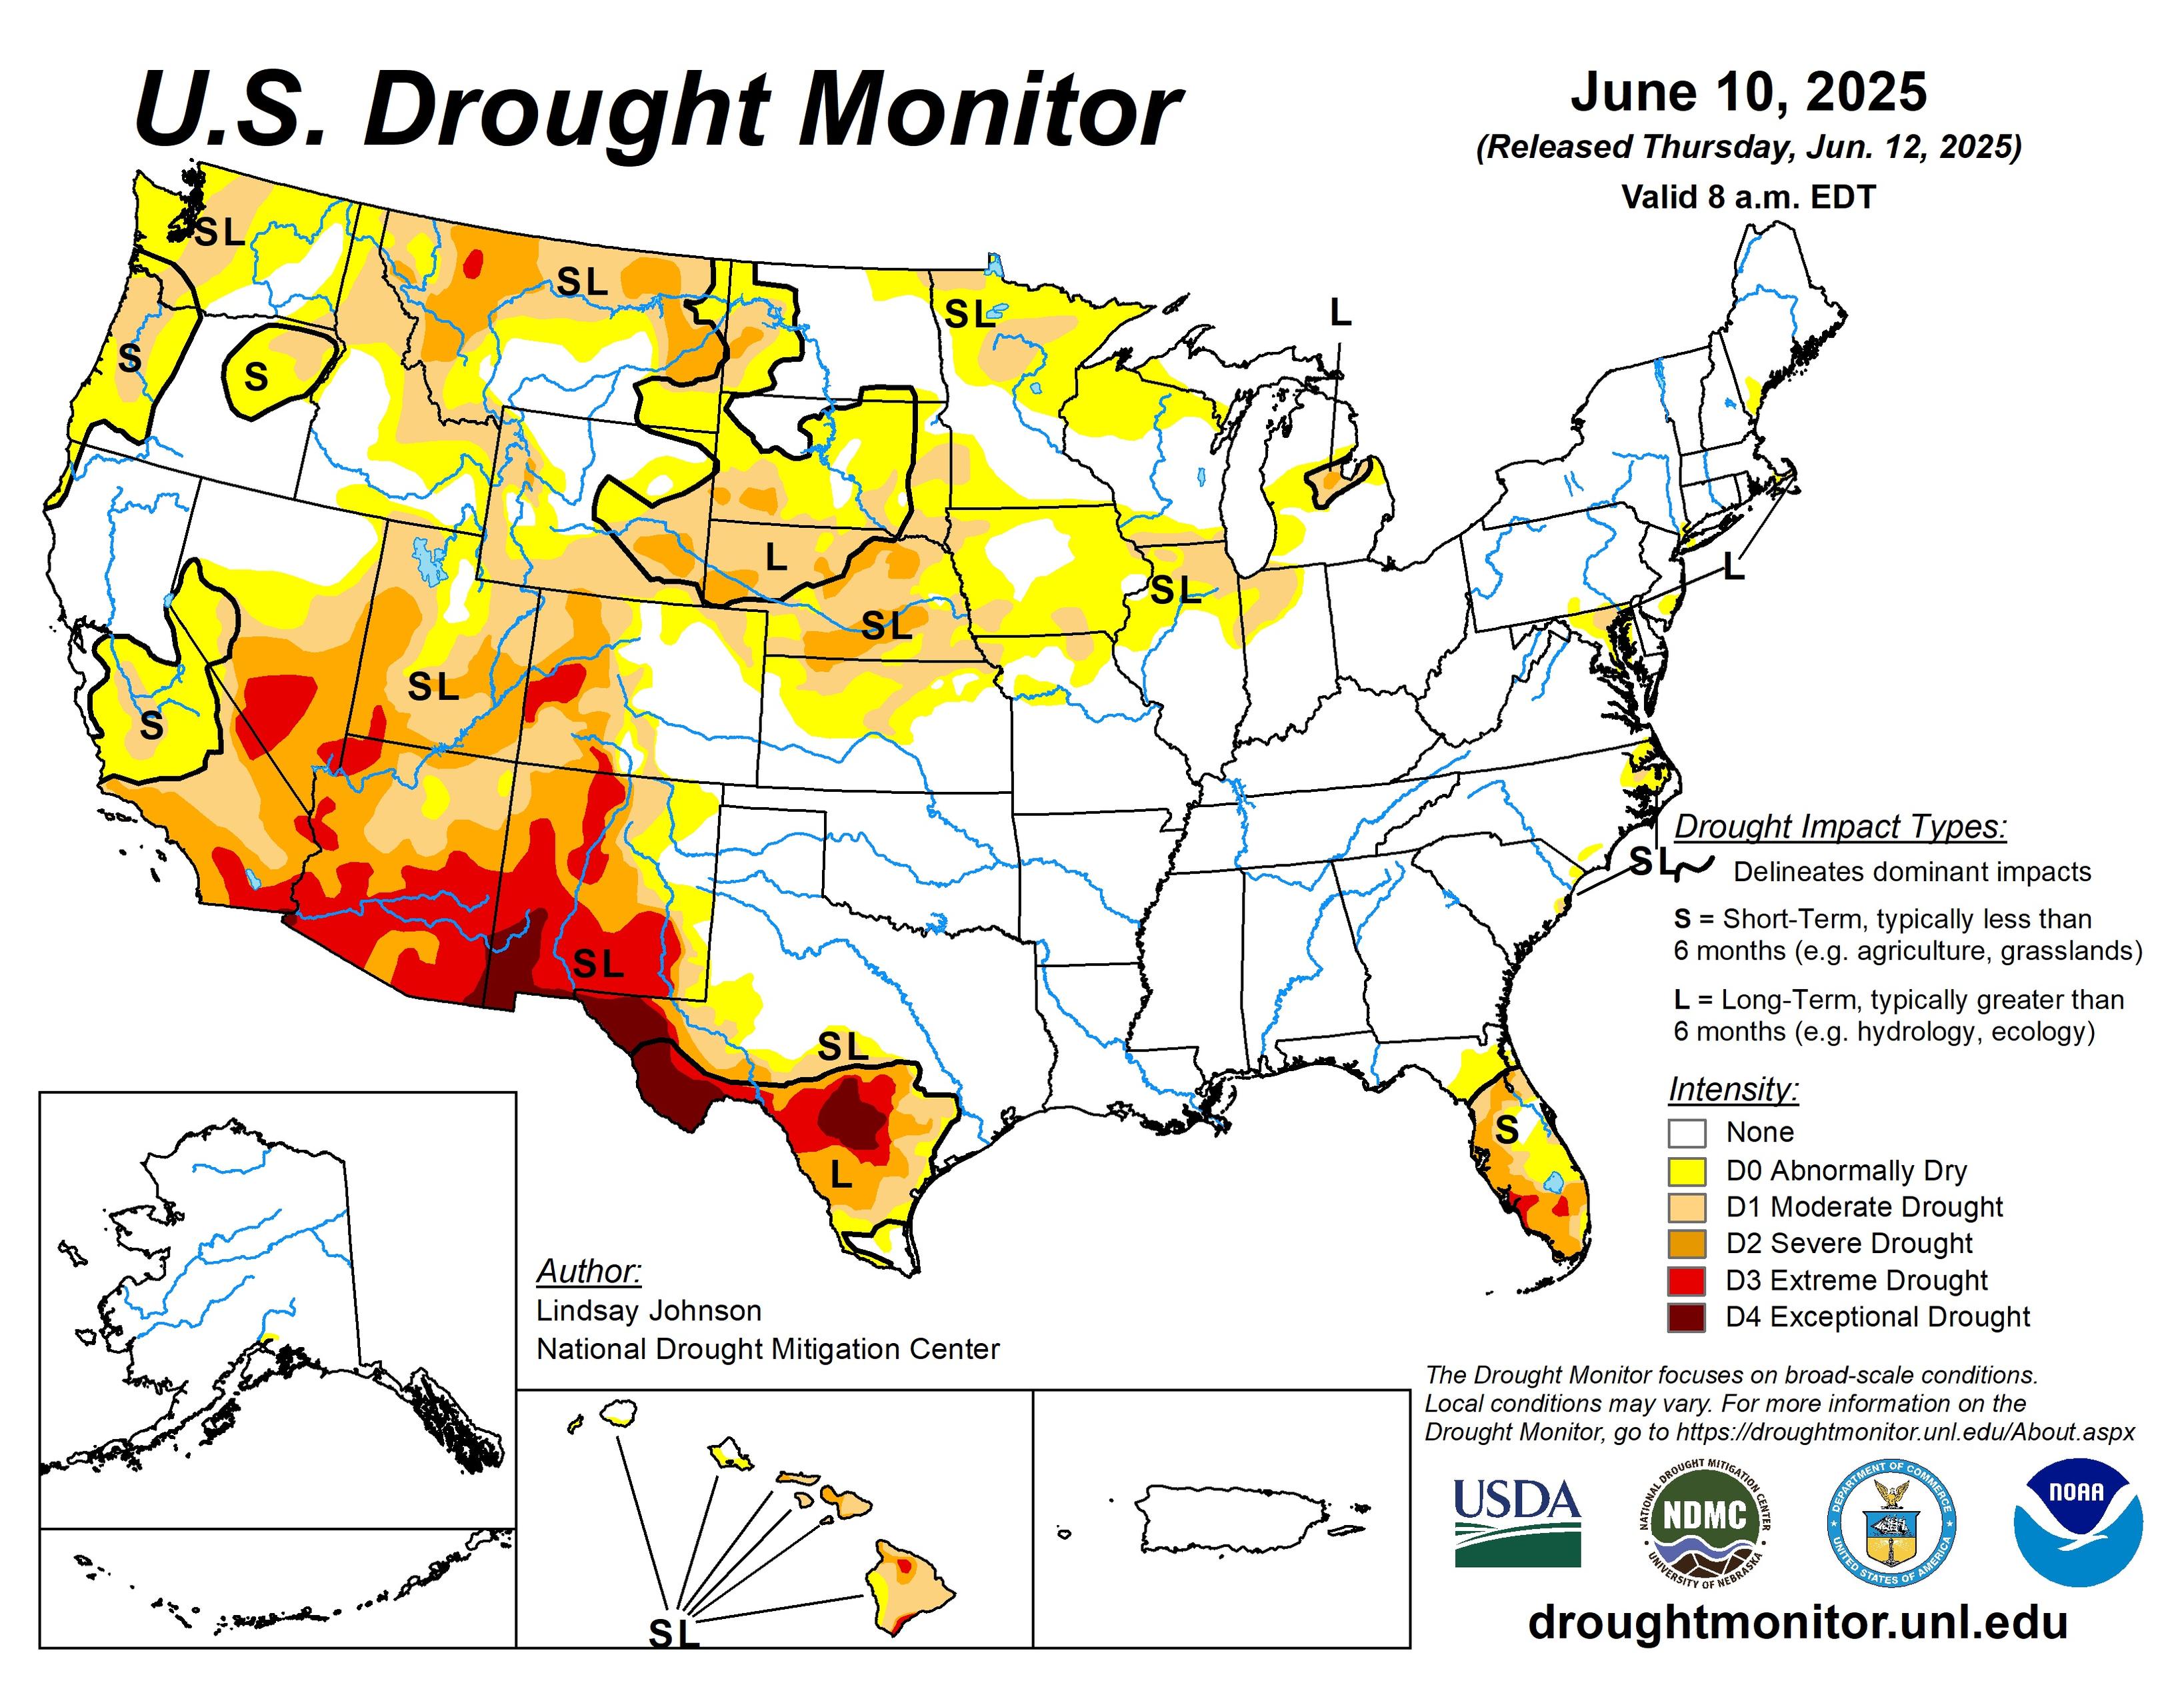
Mapa publicado: junio 12, 2025

Join the CMOR Challenge during the 2025 growing season! Share reports and photos every week showing how wet or dry conditions are in your area. https://go.unl.edu/cmor_drought
Improvements occurred in parts of the Southwest, East Coast and Southeast, with small areas of degradation in New Mexico, Florida and Maryland. Mixed conditions occurred in the Midwest, High Plains and West, plus Texas and Hawaii.
See more change maps: https://droughtmonitor.unl.edu/Maps/ChangeMaps.aspx
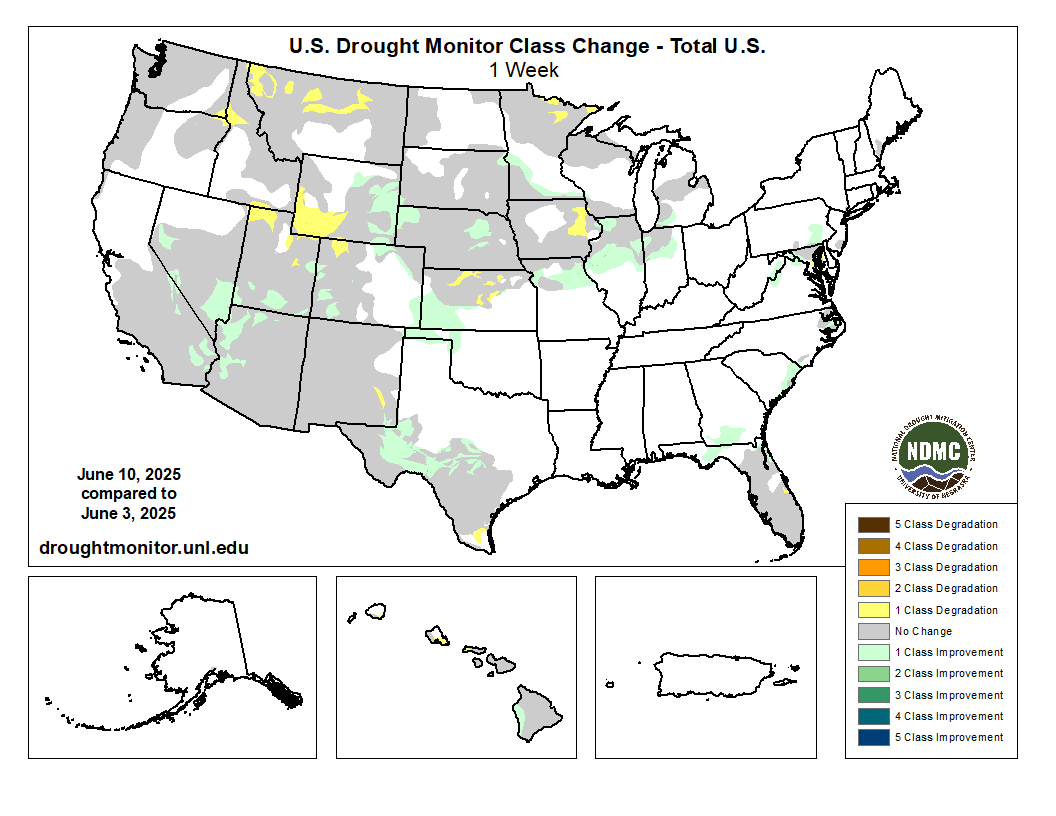
US Drought Monitor 6-12-25
For the 50 states and Puerto Rico, the US Drought Monitor shows 25.12% in moderate drought or worse, compared to 24.86% last week.
Monitor de Sequía de los Estados Unidos
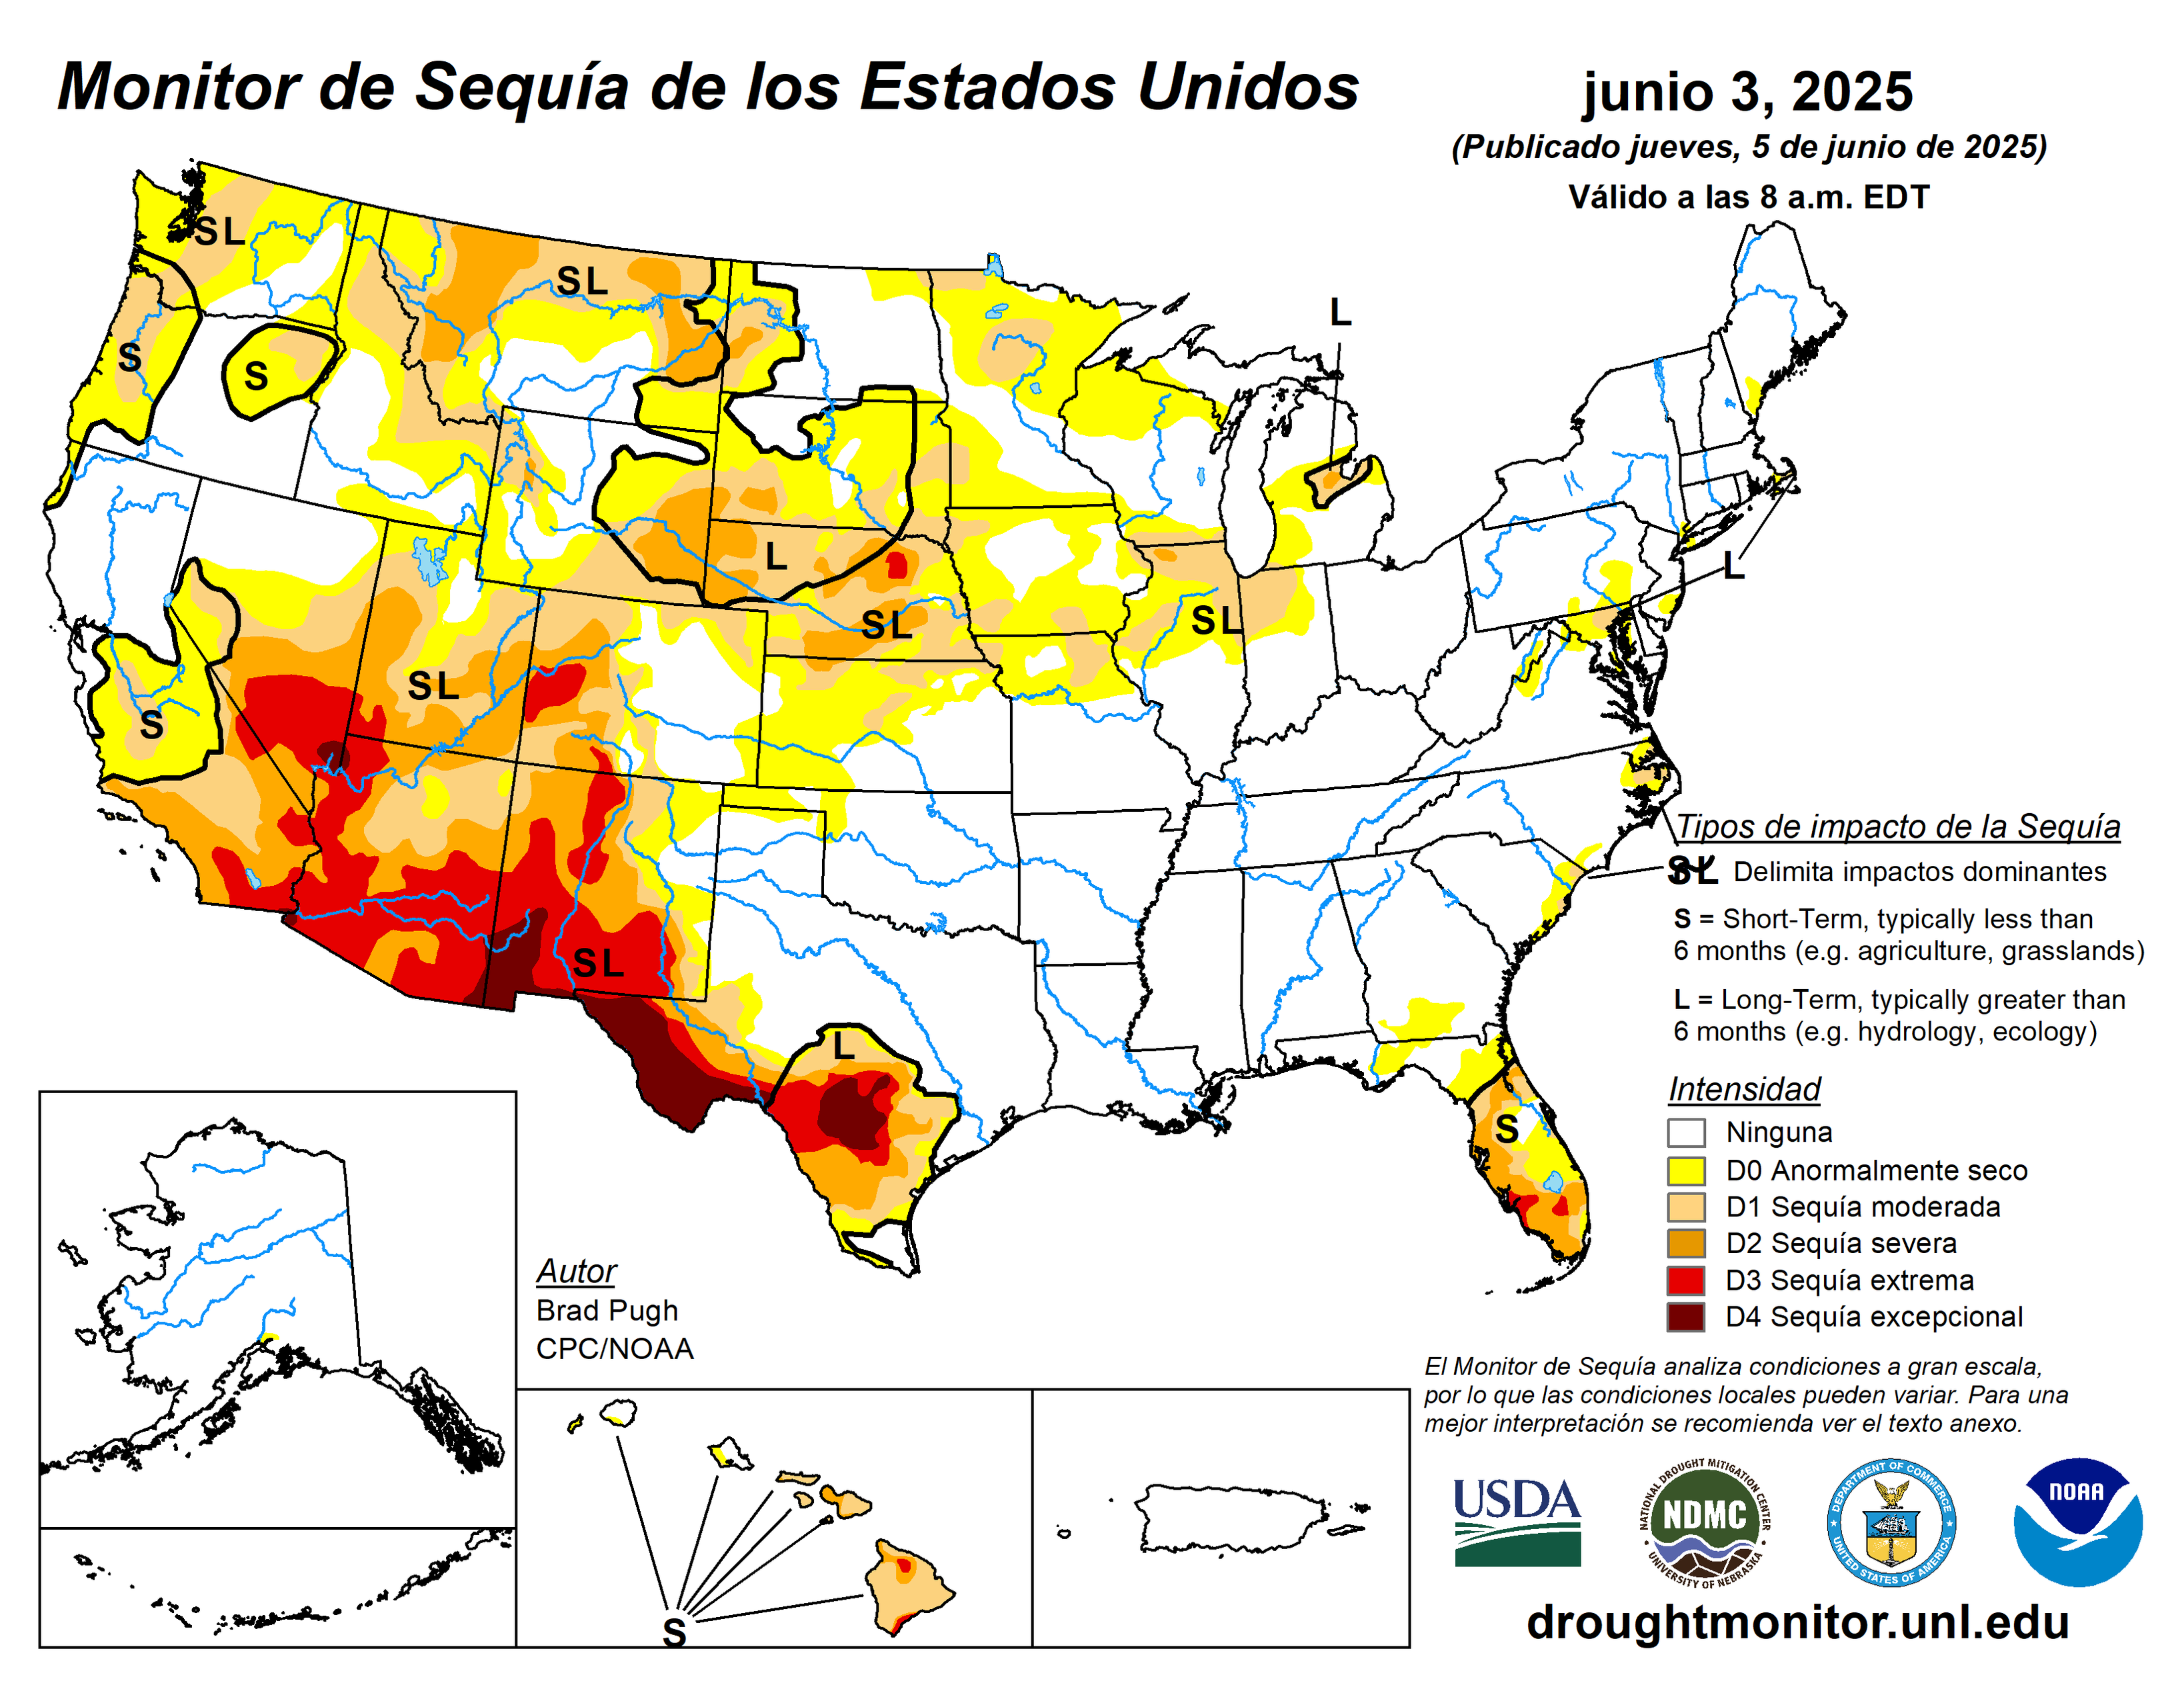
Mapa publicado: junio 5, 2025
Join the CMOR Challenge during the 2025 growing season! Share reports and photos every week showing how wet or dry conditions are in your area. https://go.unl.edu/cmor_drought
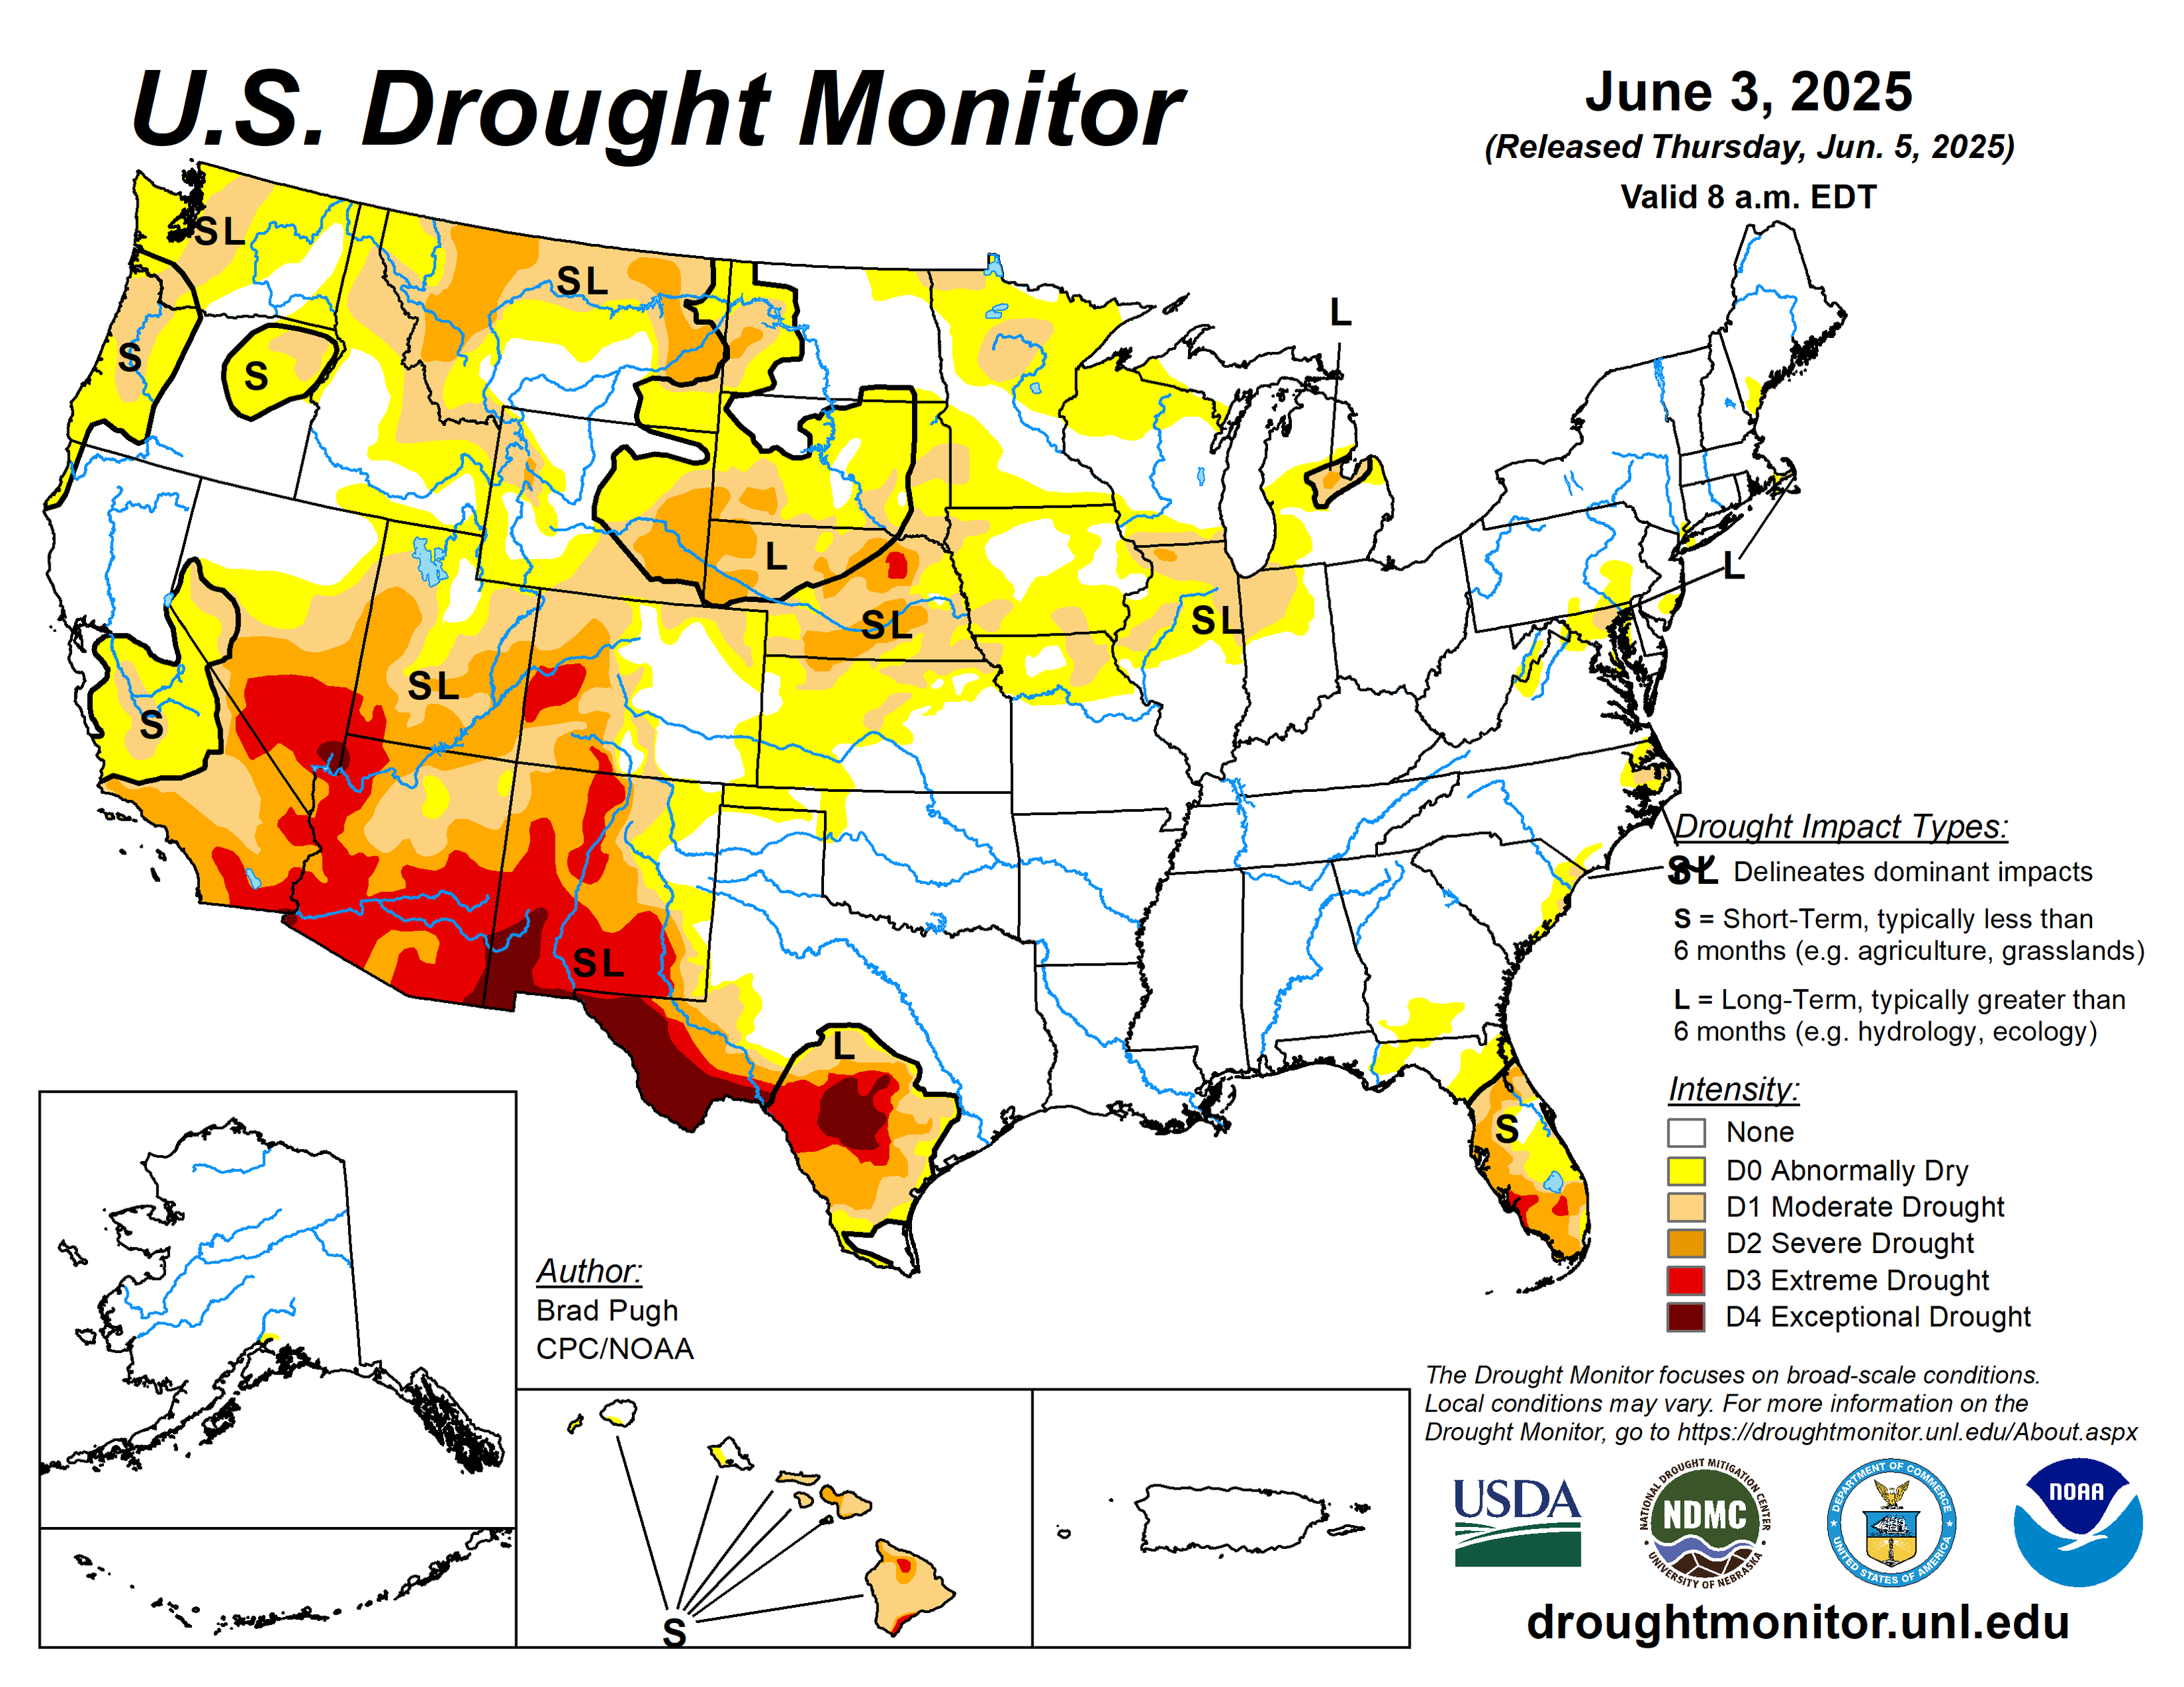
Improvements occurred in parts of the Mid-Atlantic and Southeast, with an area of degradation in Florida. The High Plains and Southwest also saw improvements, with degradations in Wyoming and Utah.
Degradations occurred in parts of the Midwest and Pacific Northwest. Montana saw mixed conditions.
See more change maps: https://droughtmonitor.unl.edu/Maps/ChangeMaps.aspx

US Drought Monitor 6-5-25
For the 50 states and Puerto Rico, the US Drought Monitor shows 24.86% in moderate drought or worse, compared to 26.08% last week.
Monitor de Sequía de los Estados Unidos
Mapa publicado: mayo 29, 2025

Client Info
Server: https://mastodon.social
Version: 2025.04
Repository: https://github.com/cyevgeniy/lmst