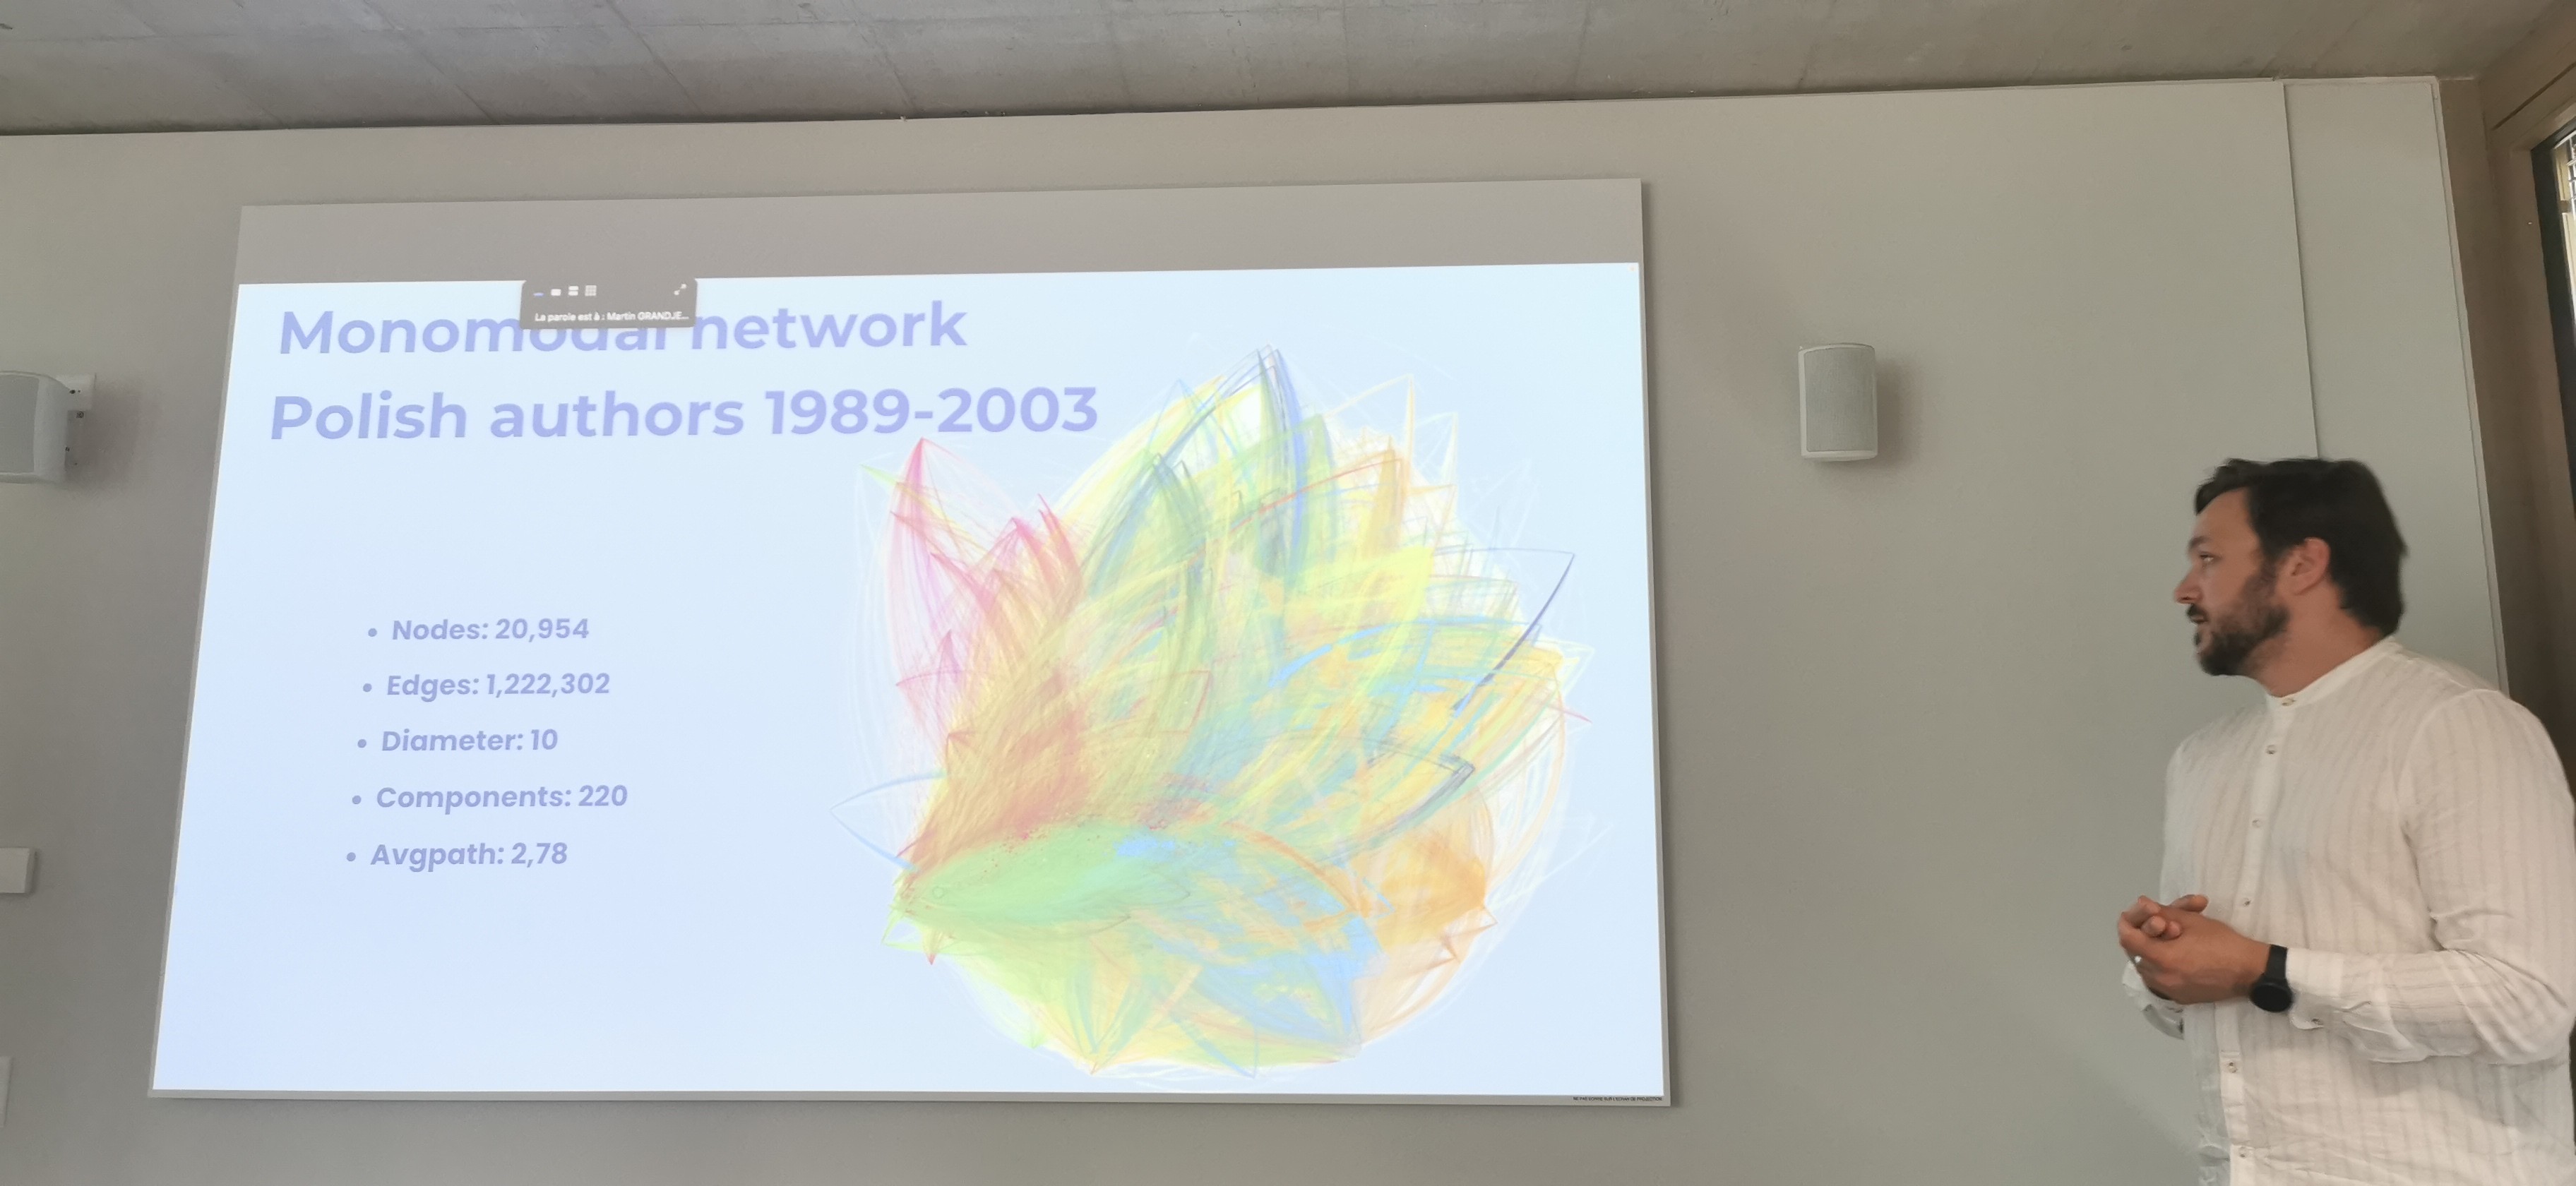
A very nice networks representation of the polish authors by Maciej Mary.
#HNR2024
#HNR2024
The scope and diversity of topics in Historical Network Research is mind-boggling #hnr2024
' High Density = High Citations? Approaches for Tracking Knowledge Evolution' by Raphael Schlattmann
@HNR
Oh no, now I want to be in two rooms at the same time: 'Exploring Biographical Networks of Person Objects from Newspaper Clippings' by Erdal Ayen versus 'Networks of Displacement: Spatial and Temporal Dynamics of Post-WWII Migration and Resettlement' by Konstantin Schischka #hnr2024
Fortunately the whole conference is recorded and can be watched later on @HNR YouTube channel: https://www.youtube.com/@HistoricalNetworkResearch
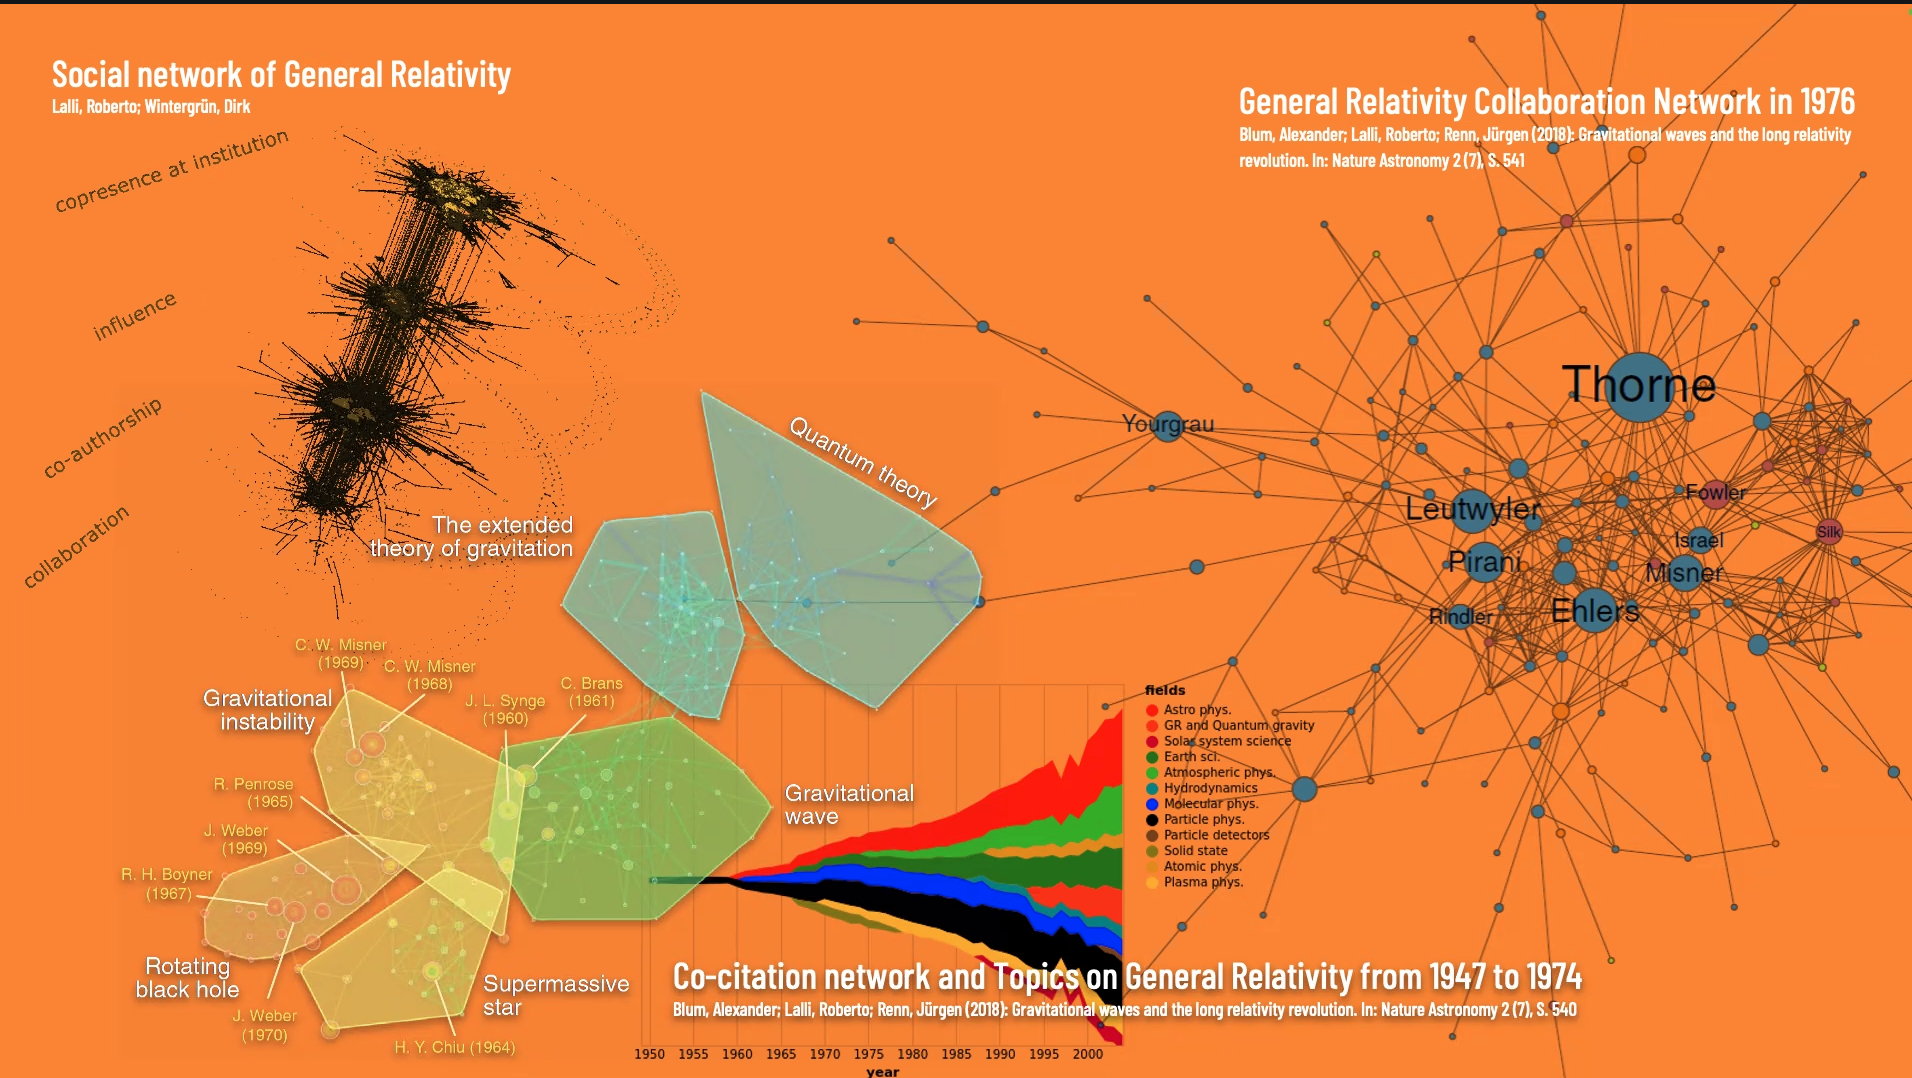
The second kind is network maps, Gephi-style.
It's a different trade-off in terms of method; it comes with its own challenges and opportunities.
Daniele explains that the network map we see below has flaws. We see long chains of nodes: those have "pseudo-nodes" that are artefacts of the method.
Lesson learned: Daniele can now make better decisions when building his networks. Visualization supports reflexivity.
Daniele Morrone is representing discourses as networks, two different ways.
First kind: argument maps. Links between arguments and conclusions in discourses.
Two examples below, a simple one and a rich one. This network is a diagram generated with GraphViz.
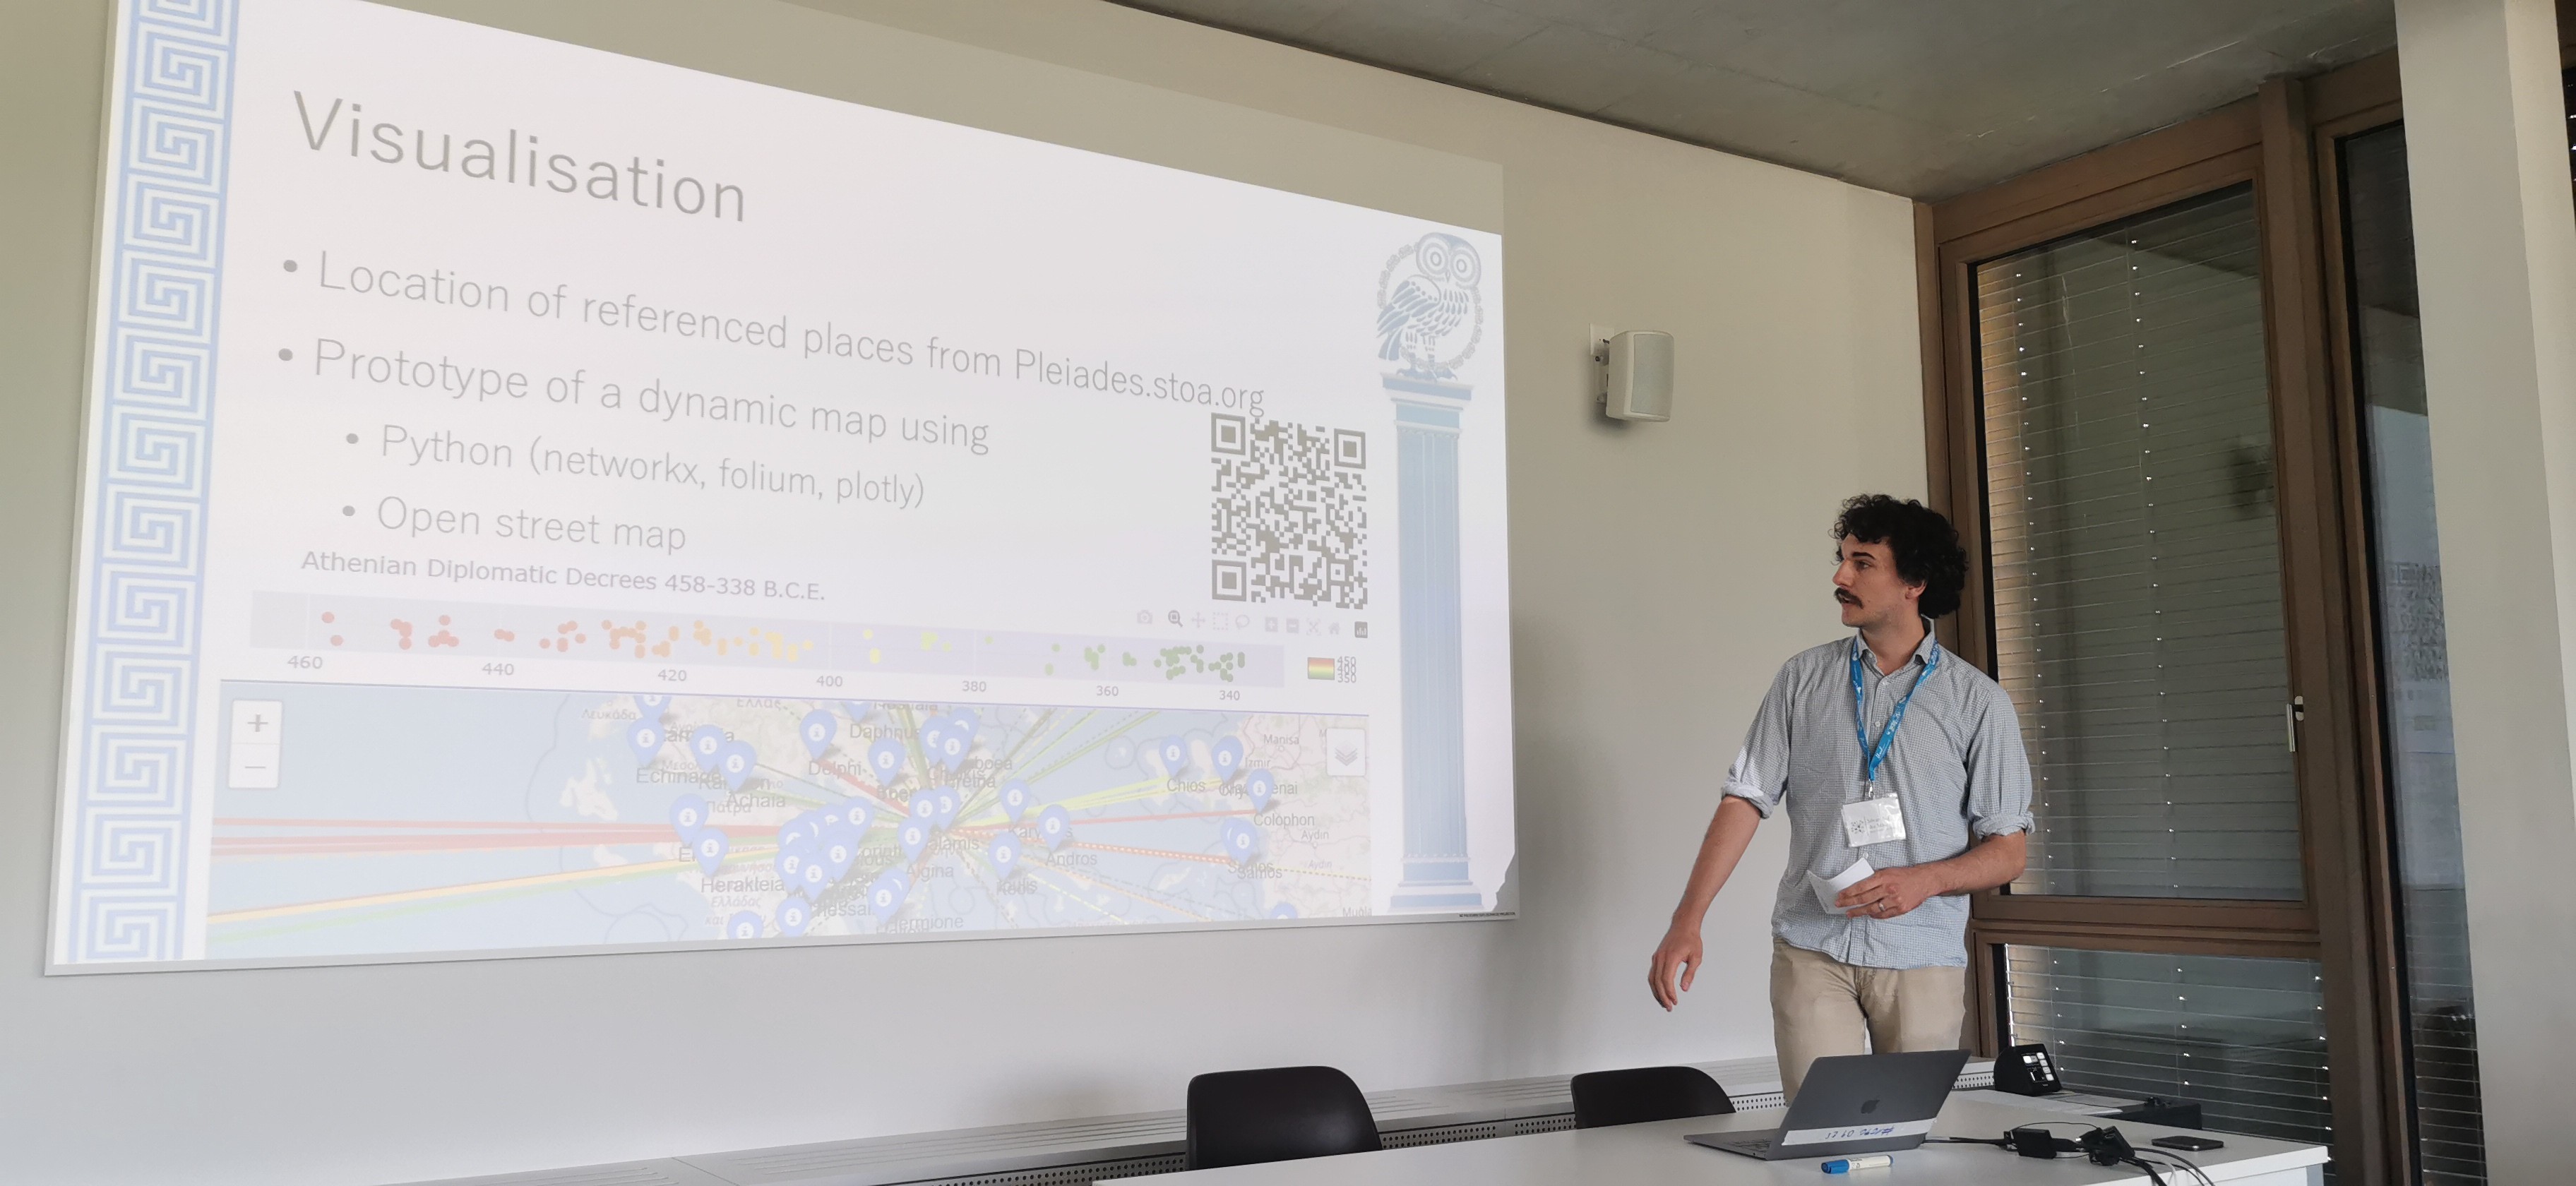
#HNR2024 now Silvan Auf Der Maur about the diplomatic network of Athens in Classical Greece.
She found the layouts in Gephi more natural to her, but the time dimension is still not easy to visualize. Tuba is still experimenting to find what suits her best.
#hnr2024
Tuba Nur Saraçoğlu visualizes early Islamicate scholars' networks.
Those are narration networks, transmission chains from one actor (ex: the Prophet) to others, until a final inscription in a document. We can track the chains in historical records.
Next up is Geert Kessels from @lab1100 (with Pim van Bree), creators of Nodegoat, the open source tool to analyze relational and temporal data.
https://nodegoat.net/
It's online-based, embeds a rich database system, does geolocated and force-driven visualizations, and always integrates the time dimension gracefully.
Geert and Pim told me yesterday that their tool has been inspired by Bruno Latour and Actor-Network Theory; I think he would be happy about it.
Here is an example of what Tayla was able to produce. The nodes are burial sites placed according to their geolocation. The connections are the similarities in the fibulae found there. Work in progress!
#hnr2024
I'm back to tooting about historical network research, still with rainbow moiré pictures 🌈.
Late Babylonian period. People have tablets (clay, not Apple). They have religion. Can we learn about it by building networks? Rocio Da Riva tells us about it.

So what do we learn?
* The organizations organize into a hierarchy
* The capitalist boom is the main shaping force of the elites
* The Cairo hub is gradually taking over
Gert is using his network maps as platforms to dive deeper into the data, and get qualitative when needed.
His inquiry is largely quali, even though the network is used as a narrative red thread in his presentation. Sometimes, it entails zooming on a detail because that's what the research demands.
Maarten van Dijck wants to know how the members of the Council of Formosa (17th century, now Taiwan) were connected to the rest of the population and how social capital functioned, based on baptism registers mentioning witnesses. #hnr2024
In this slides you can see the evolution of the elite network over the years.
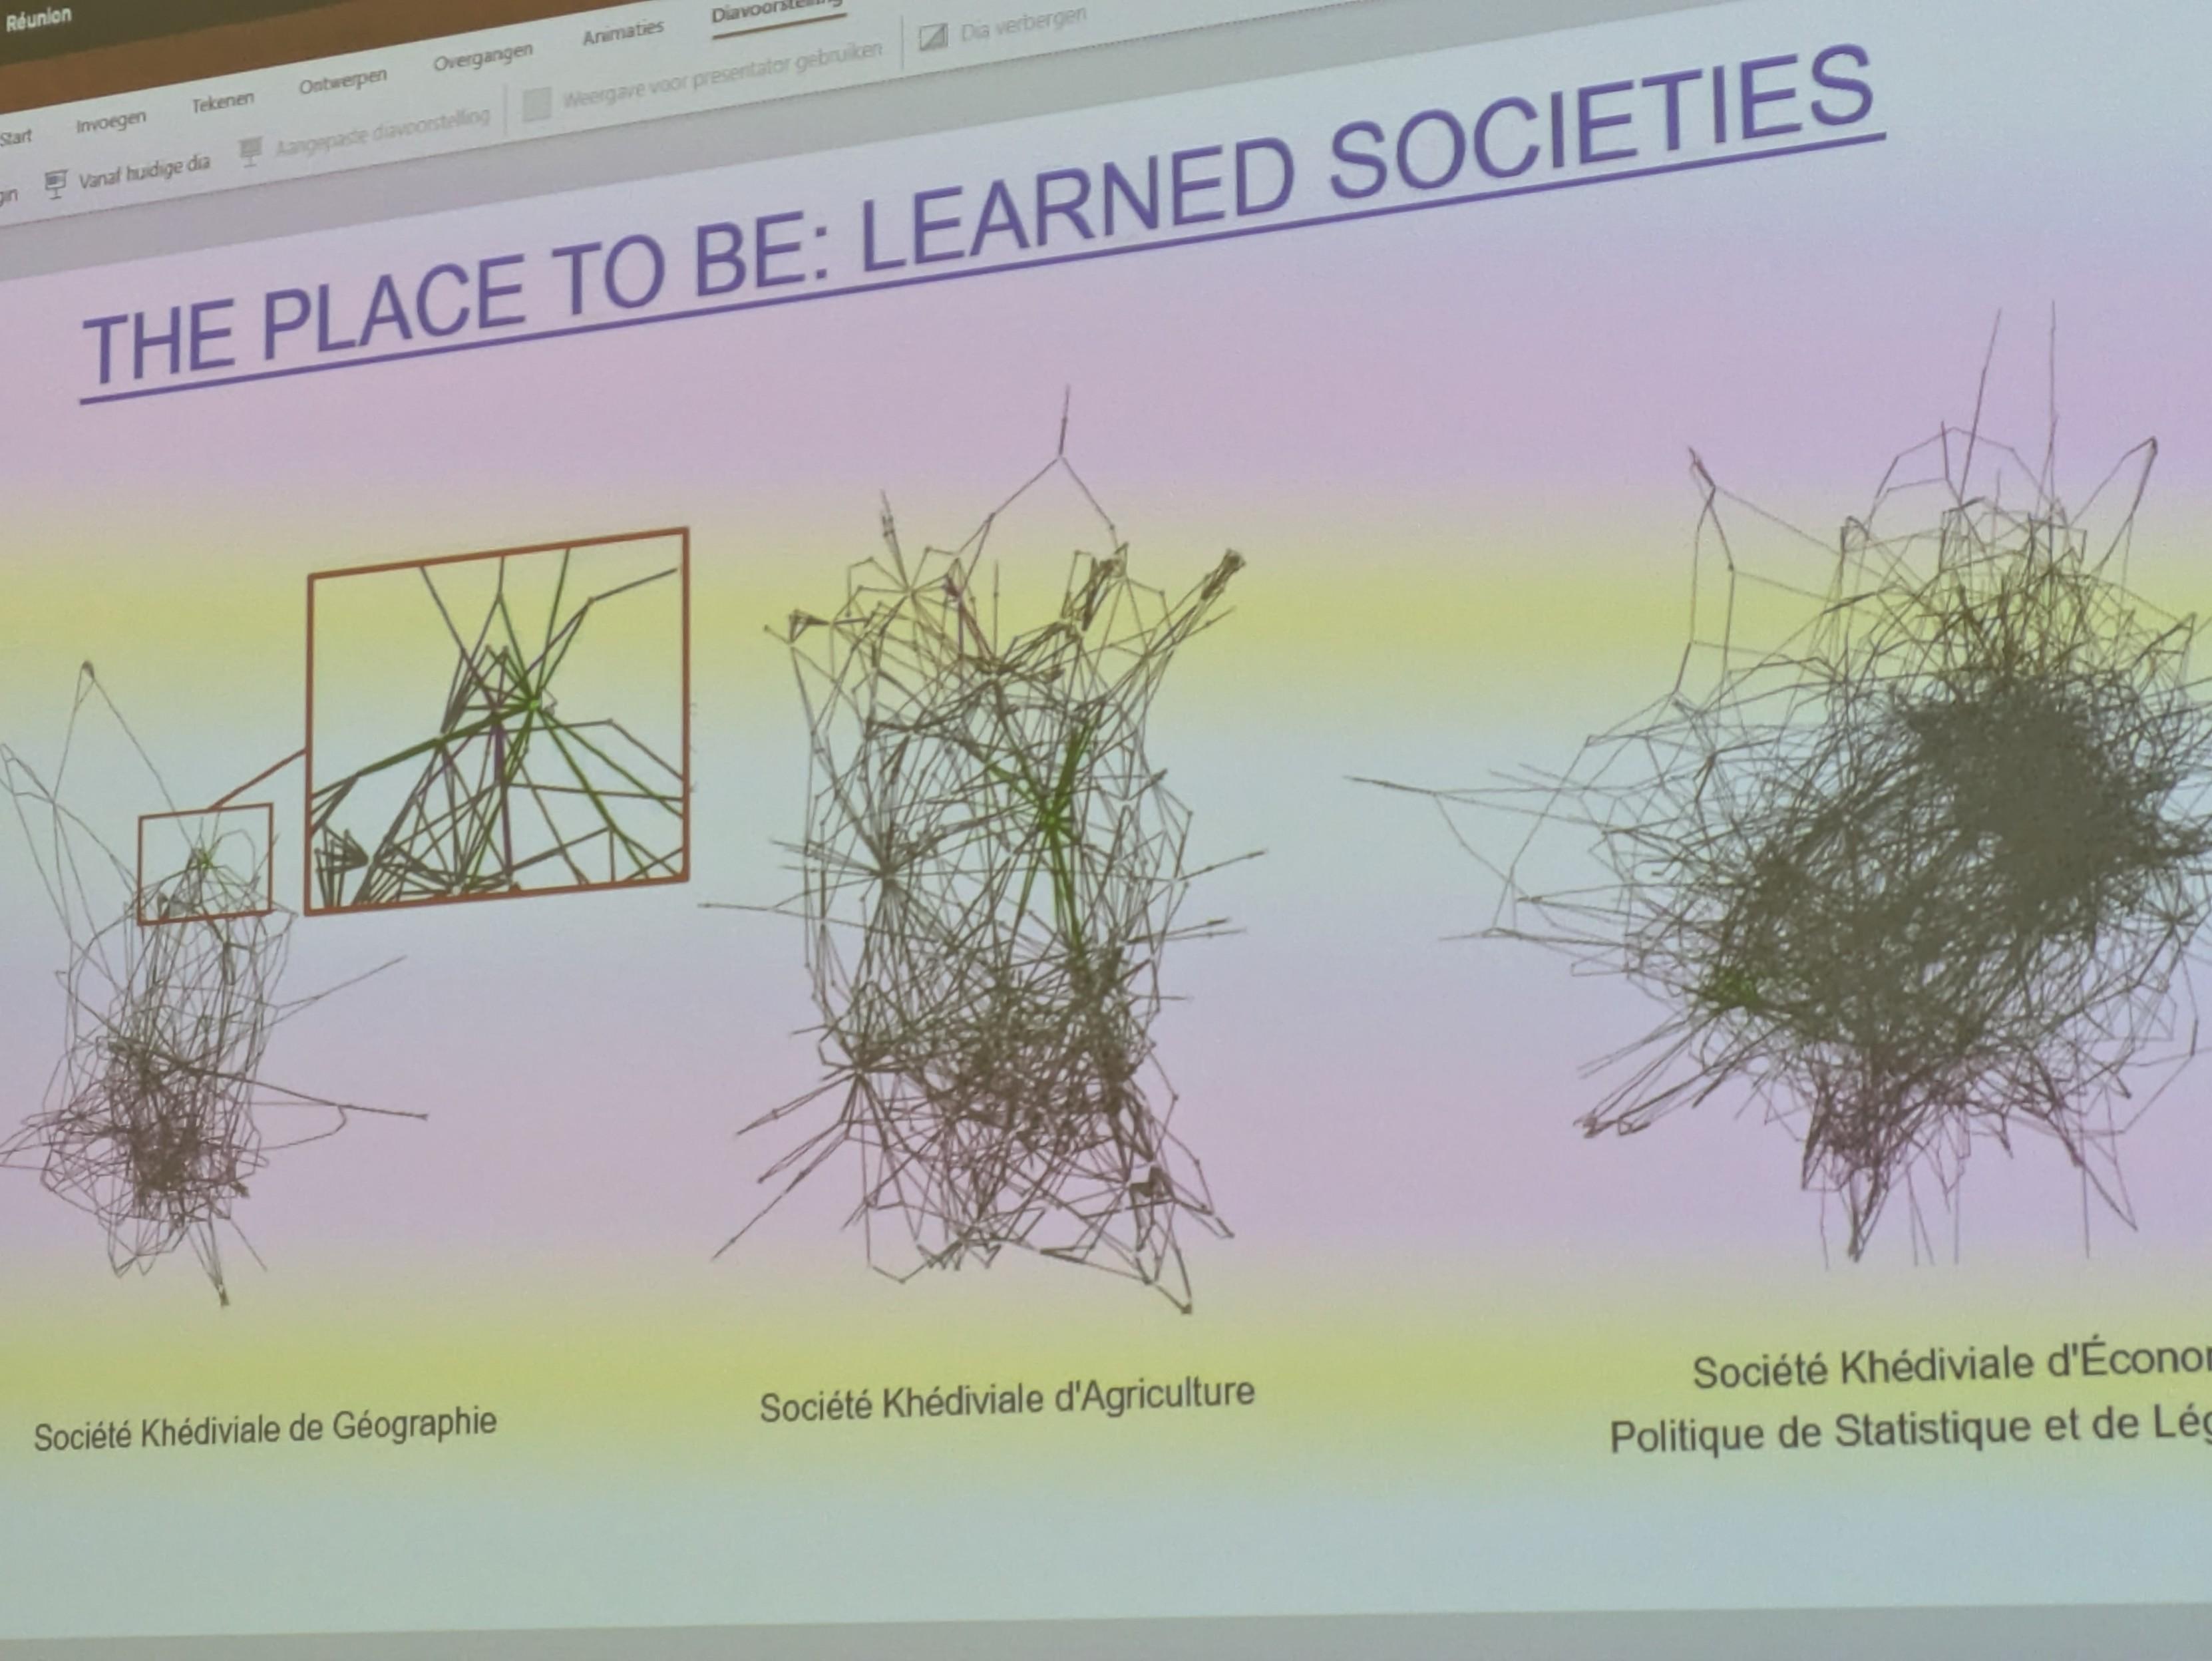
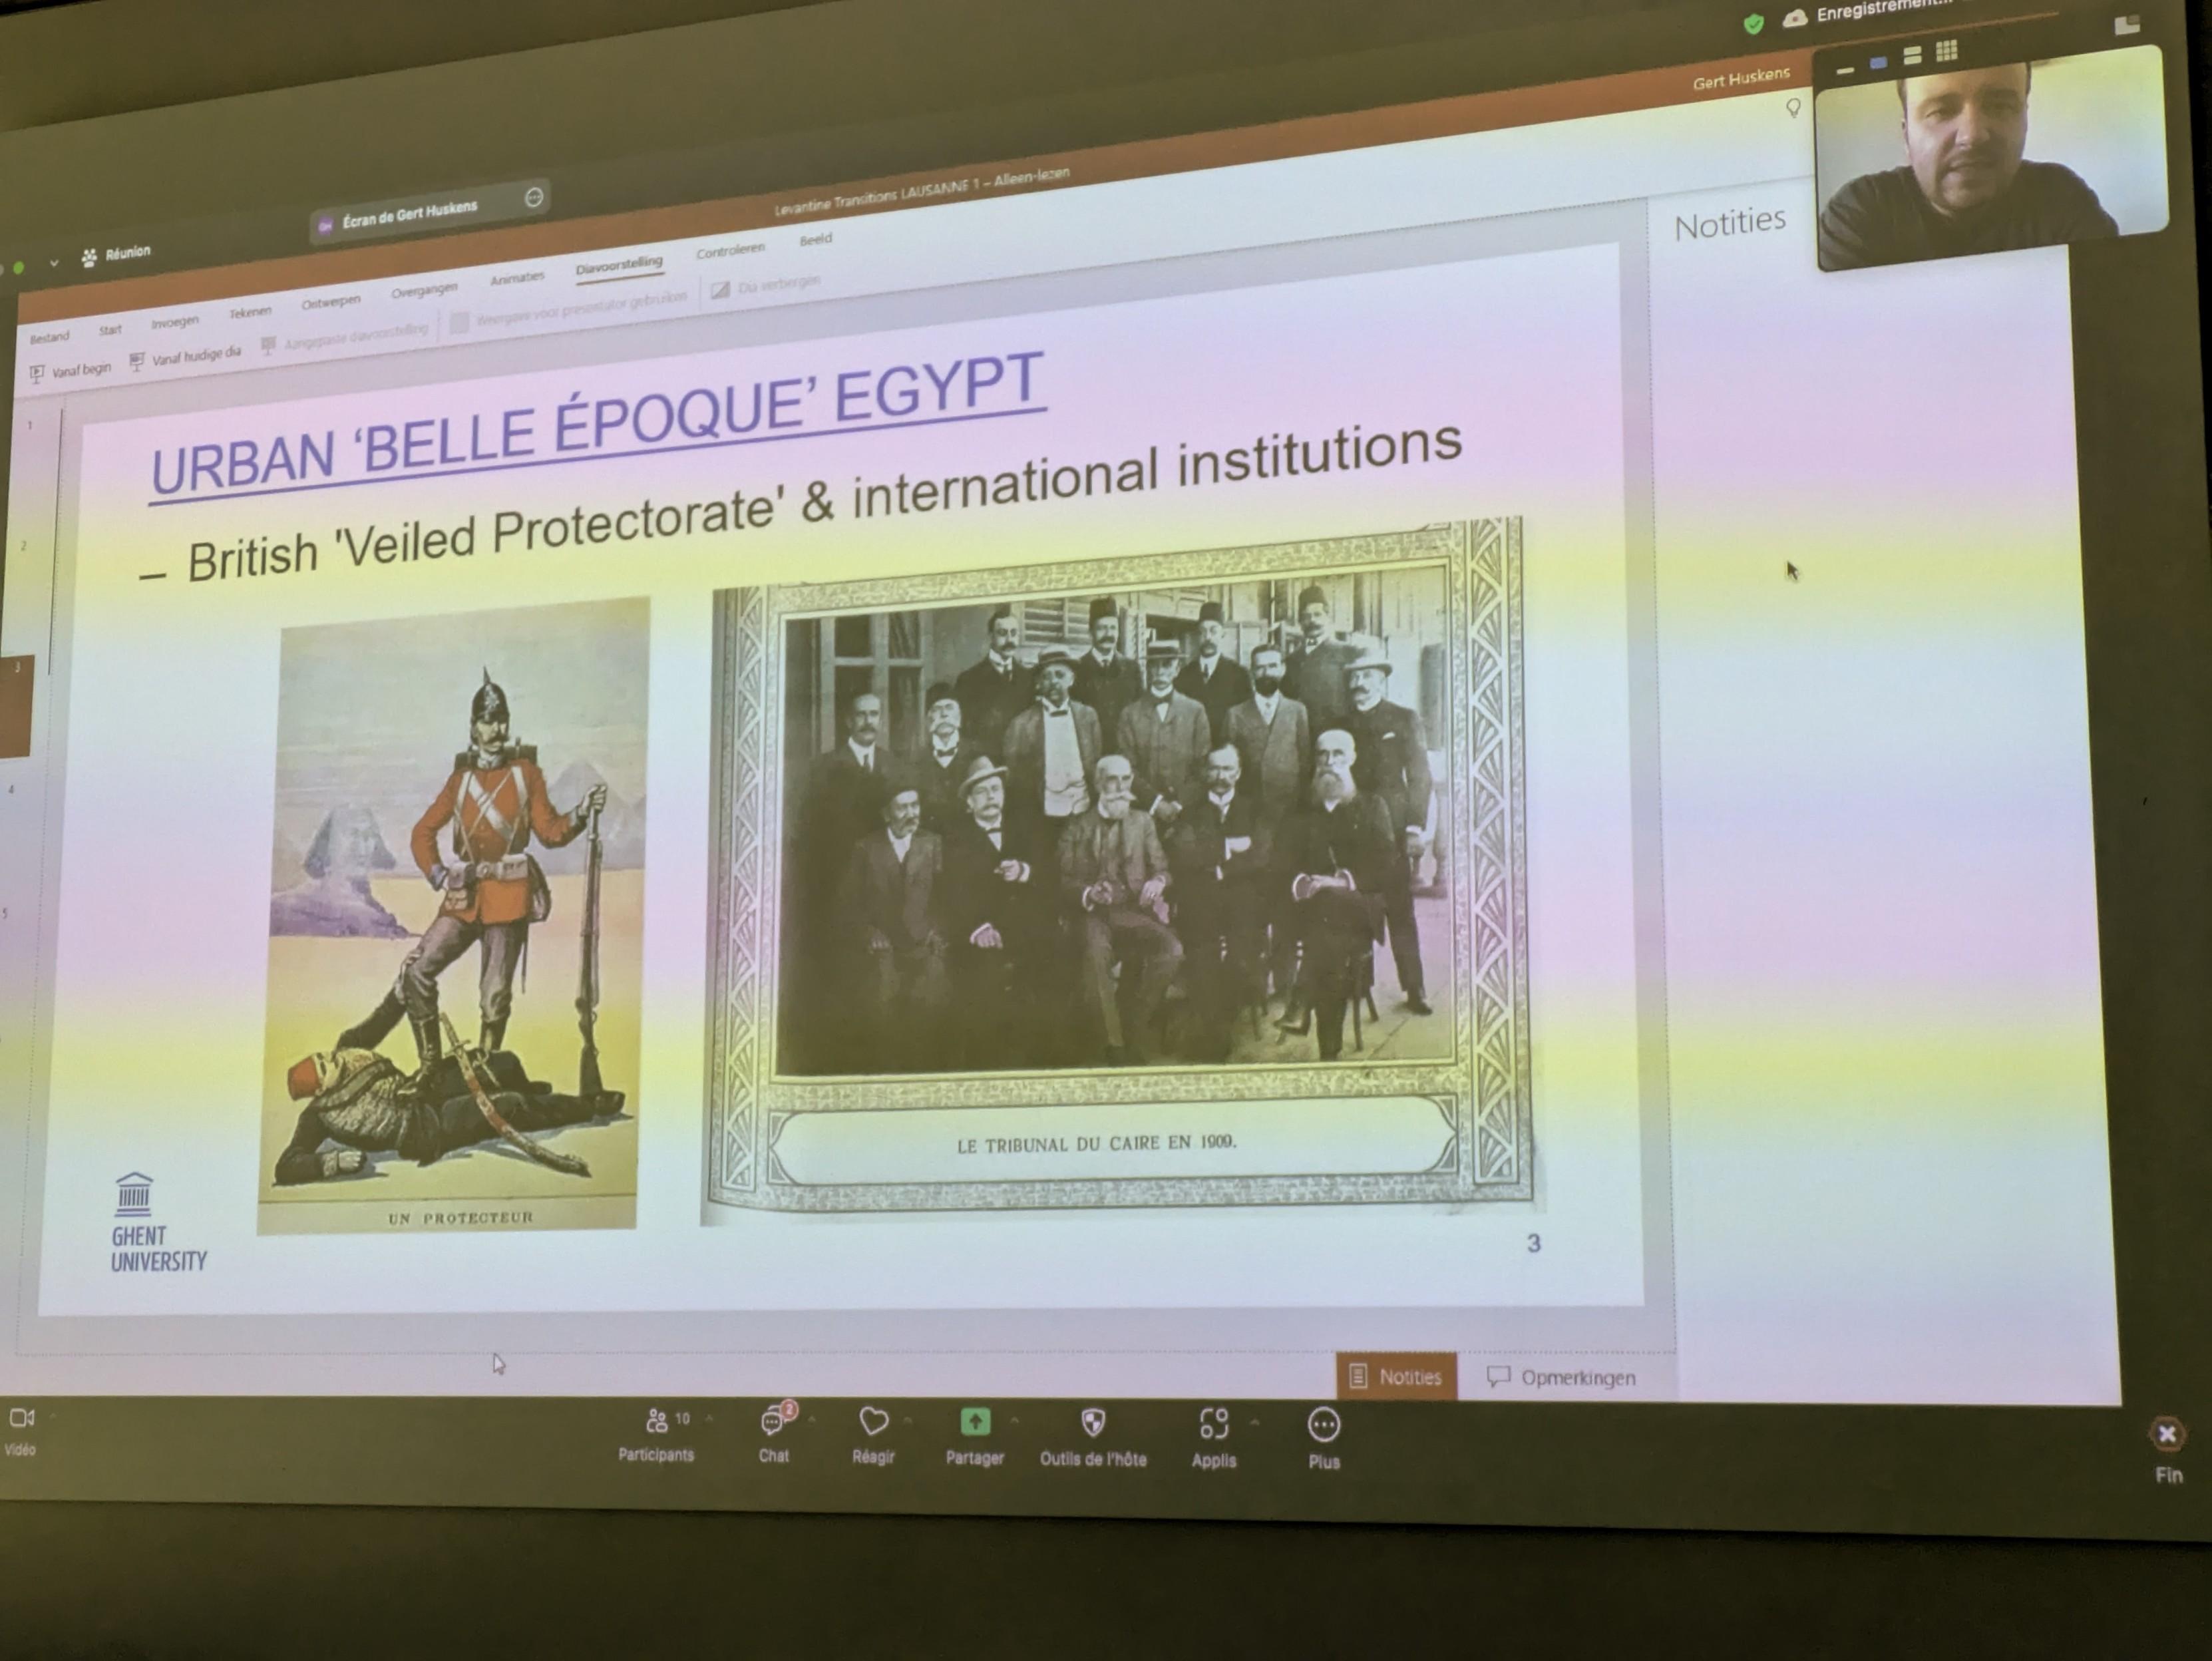
The elites are defined by two hubs, Cairo and Alexandria. Diplomats are bridging them.
Next up is Gert Huskens with a network about "elite formation in urban Egypt" at the end of 19th century.
Elites evolve quickly due to the everchanging colonial forces in Egypt (French, British...) + an autochthonous elite + an (agro-)capitalist boom.
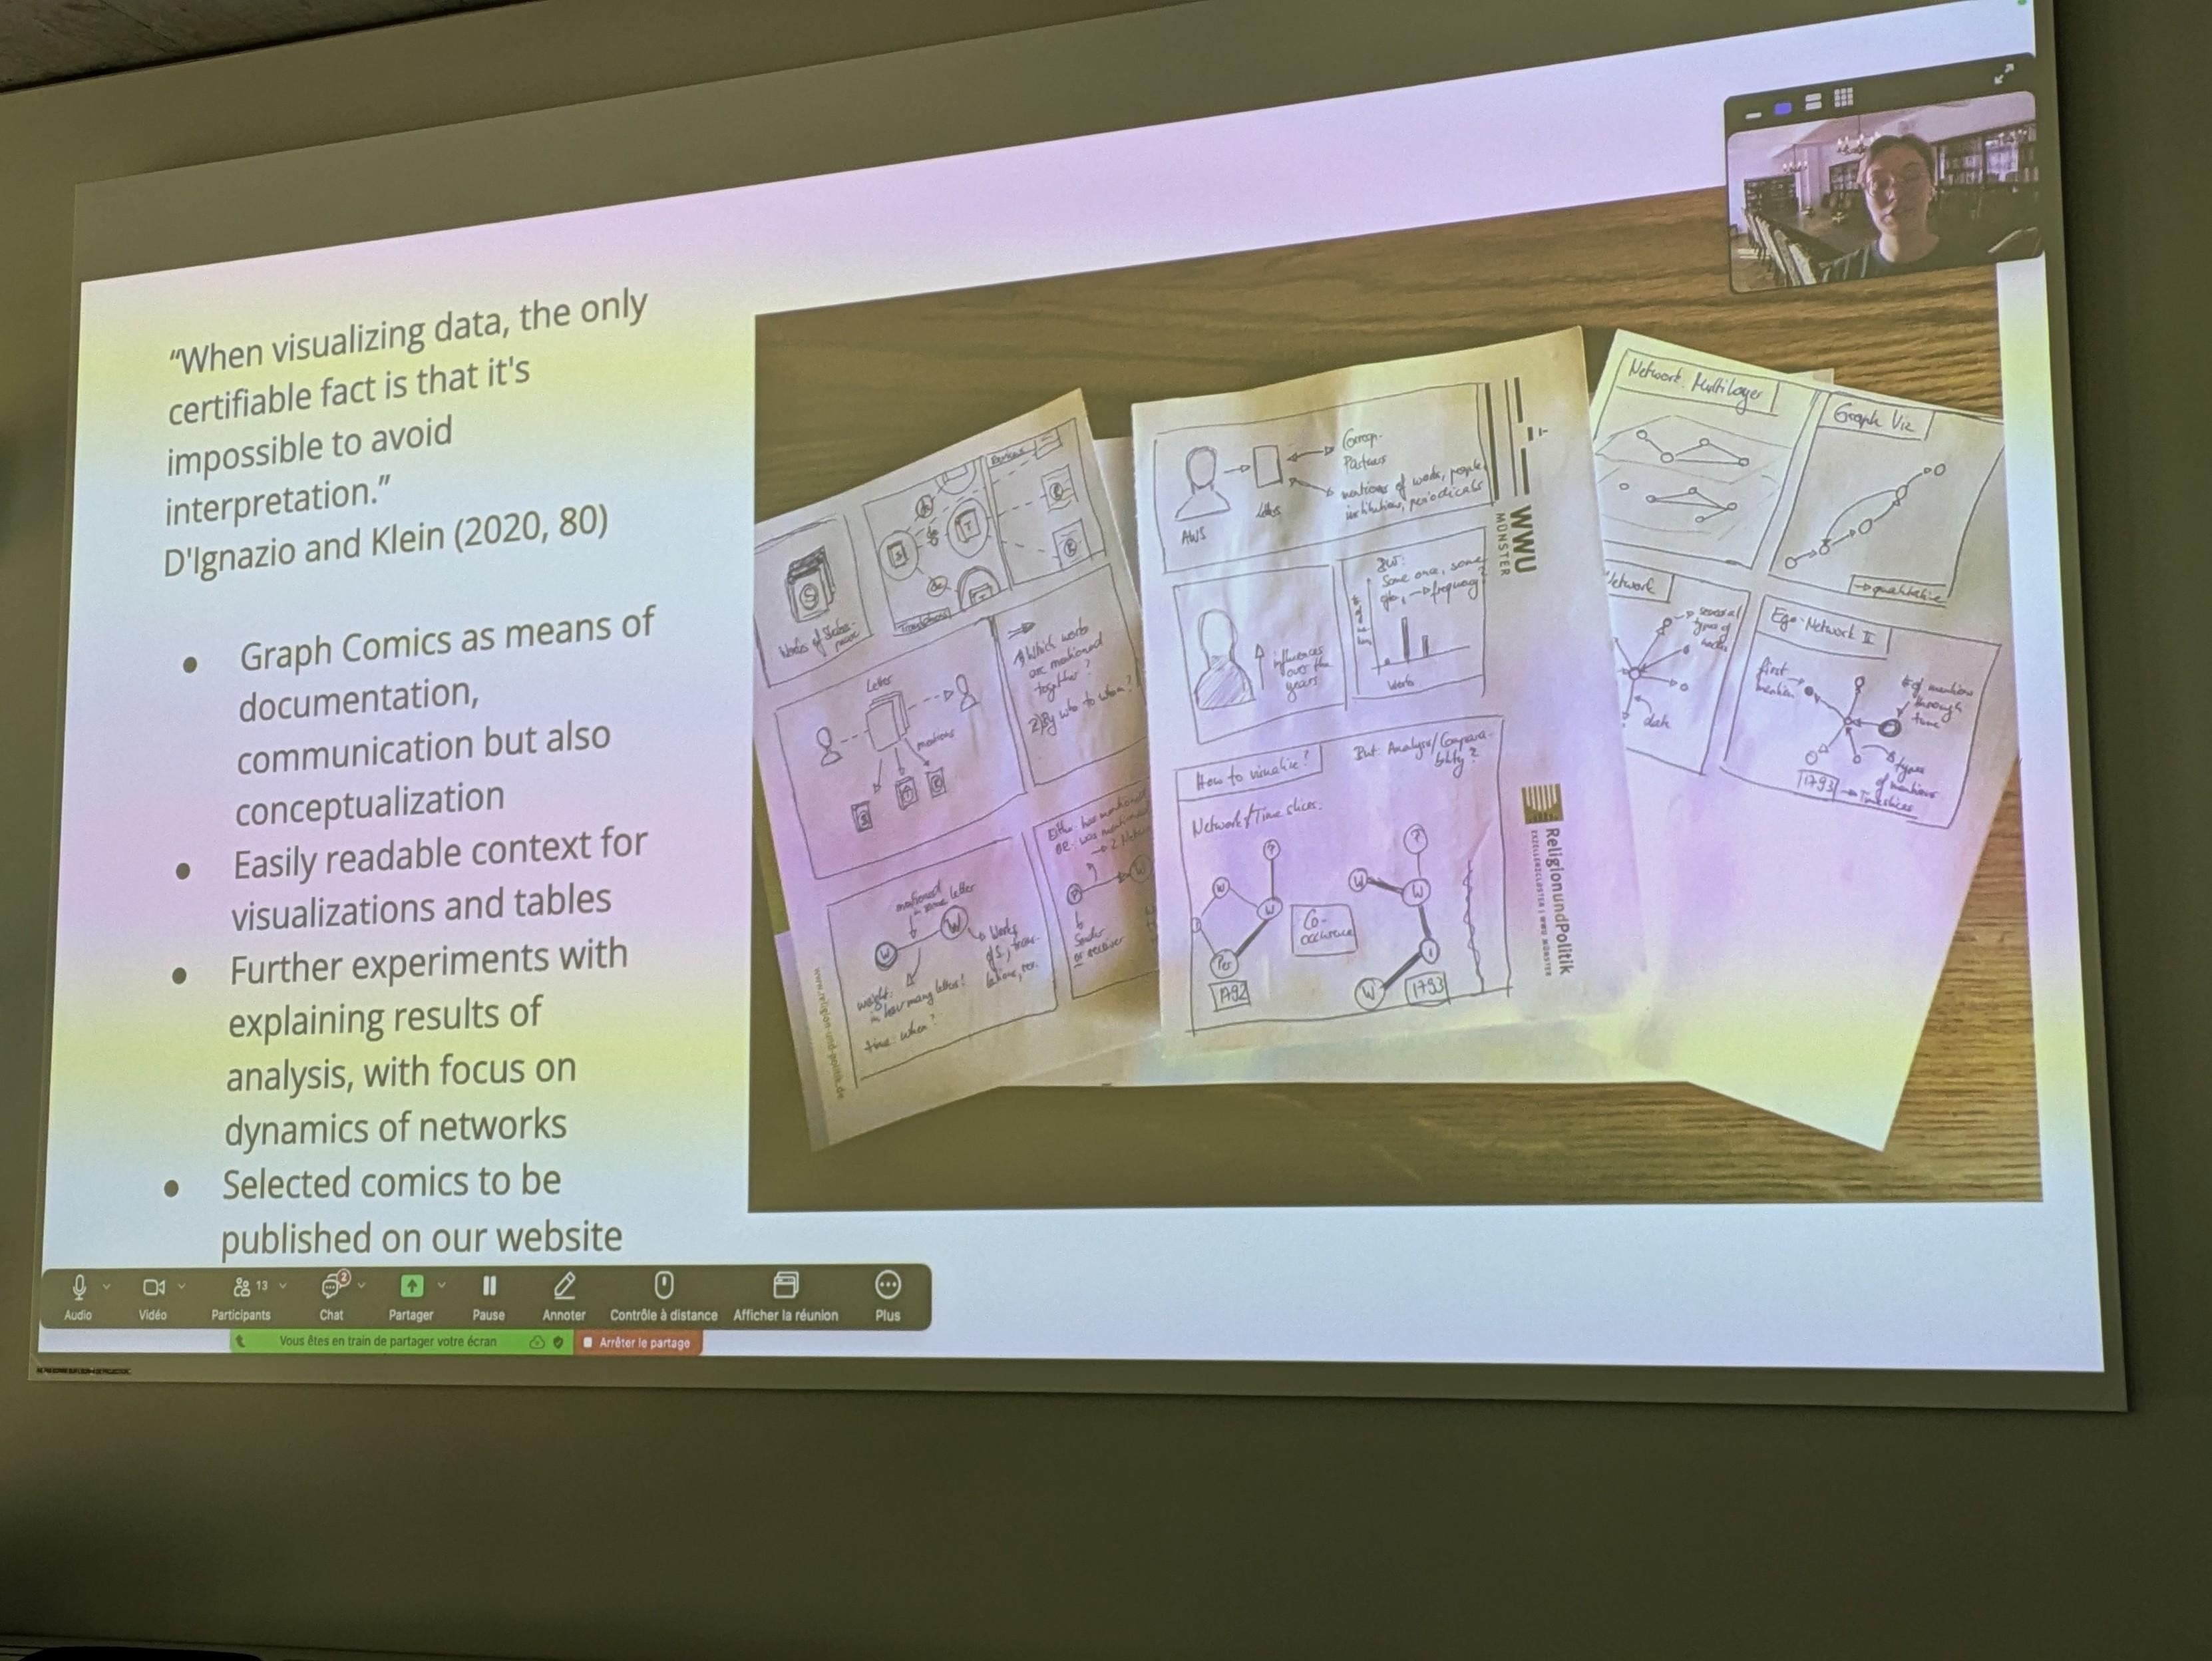
Graph comics is a solution to this issue.
Graph comics is a technique developed by Benjamin Bach.
https://aviz.fr/~bbach/graphcomics/
You have probably seen that paper, but we don't see an actual application that often. It's not easy to do!
You can see their process in those images. It is iterative, and largely manual.
Elena and Aline frame it as a matter of data feminism (following Catherine D’Ignazio and Lauren F. Klein).

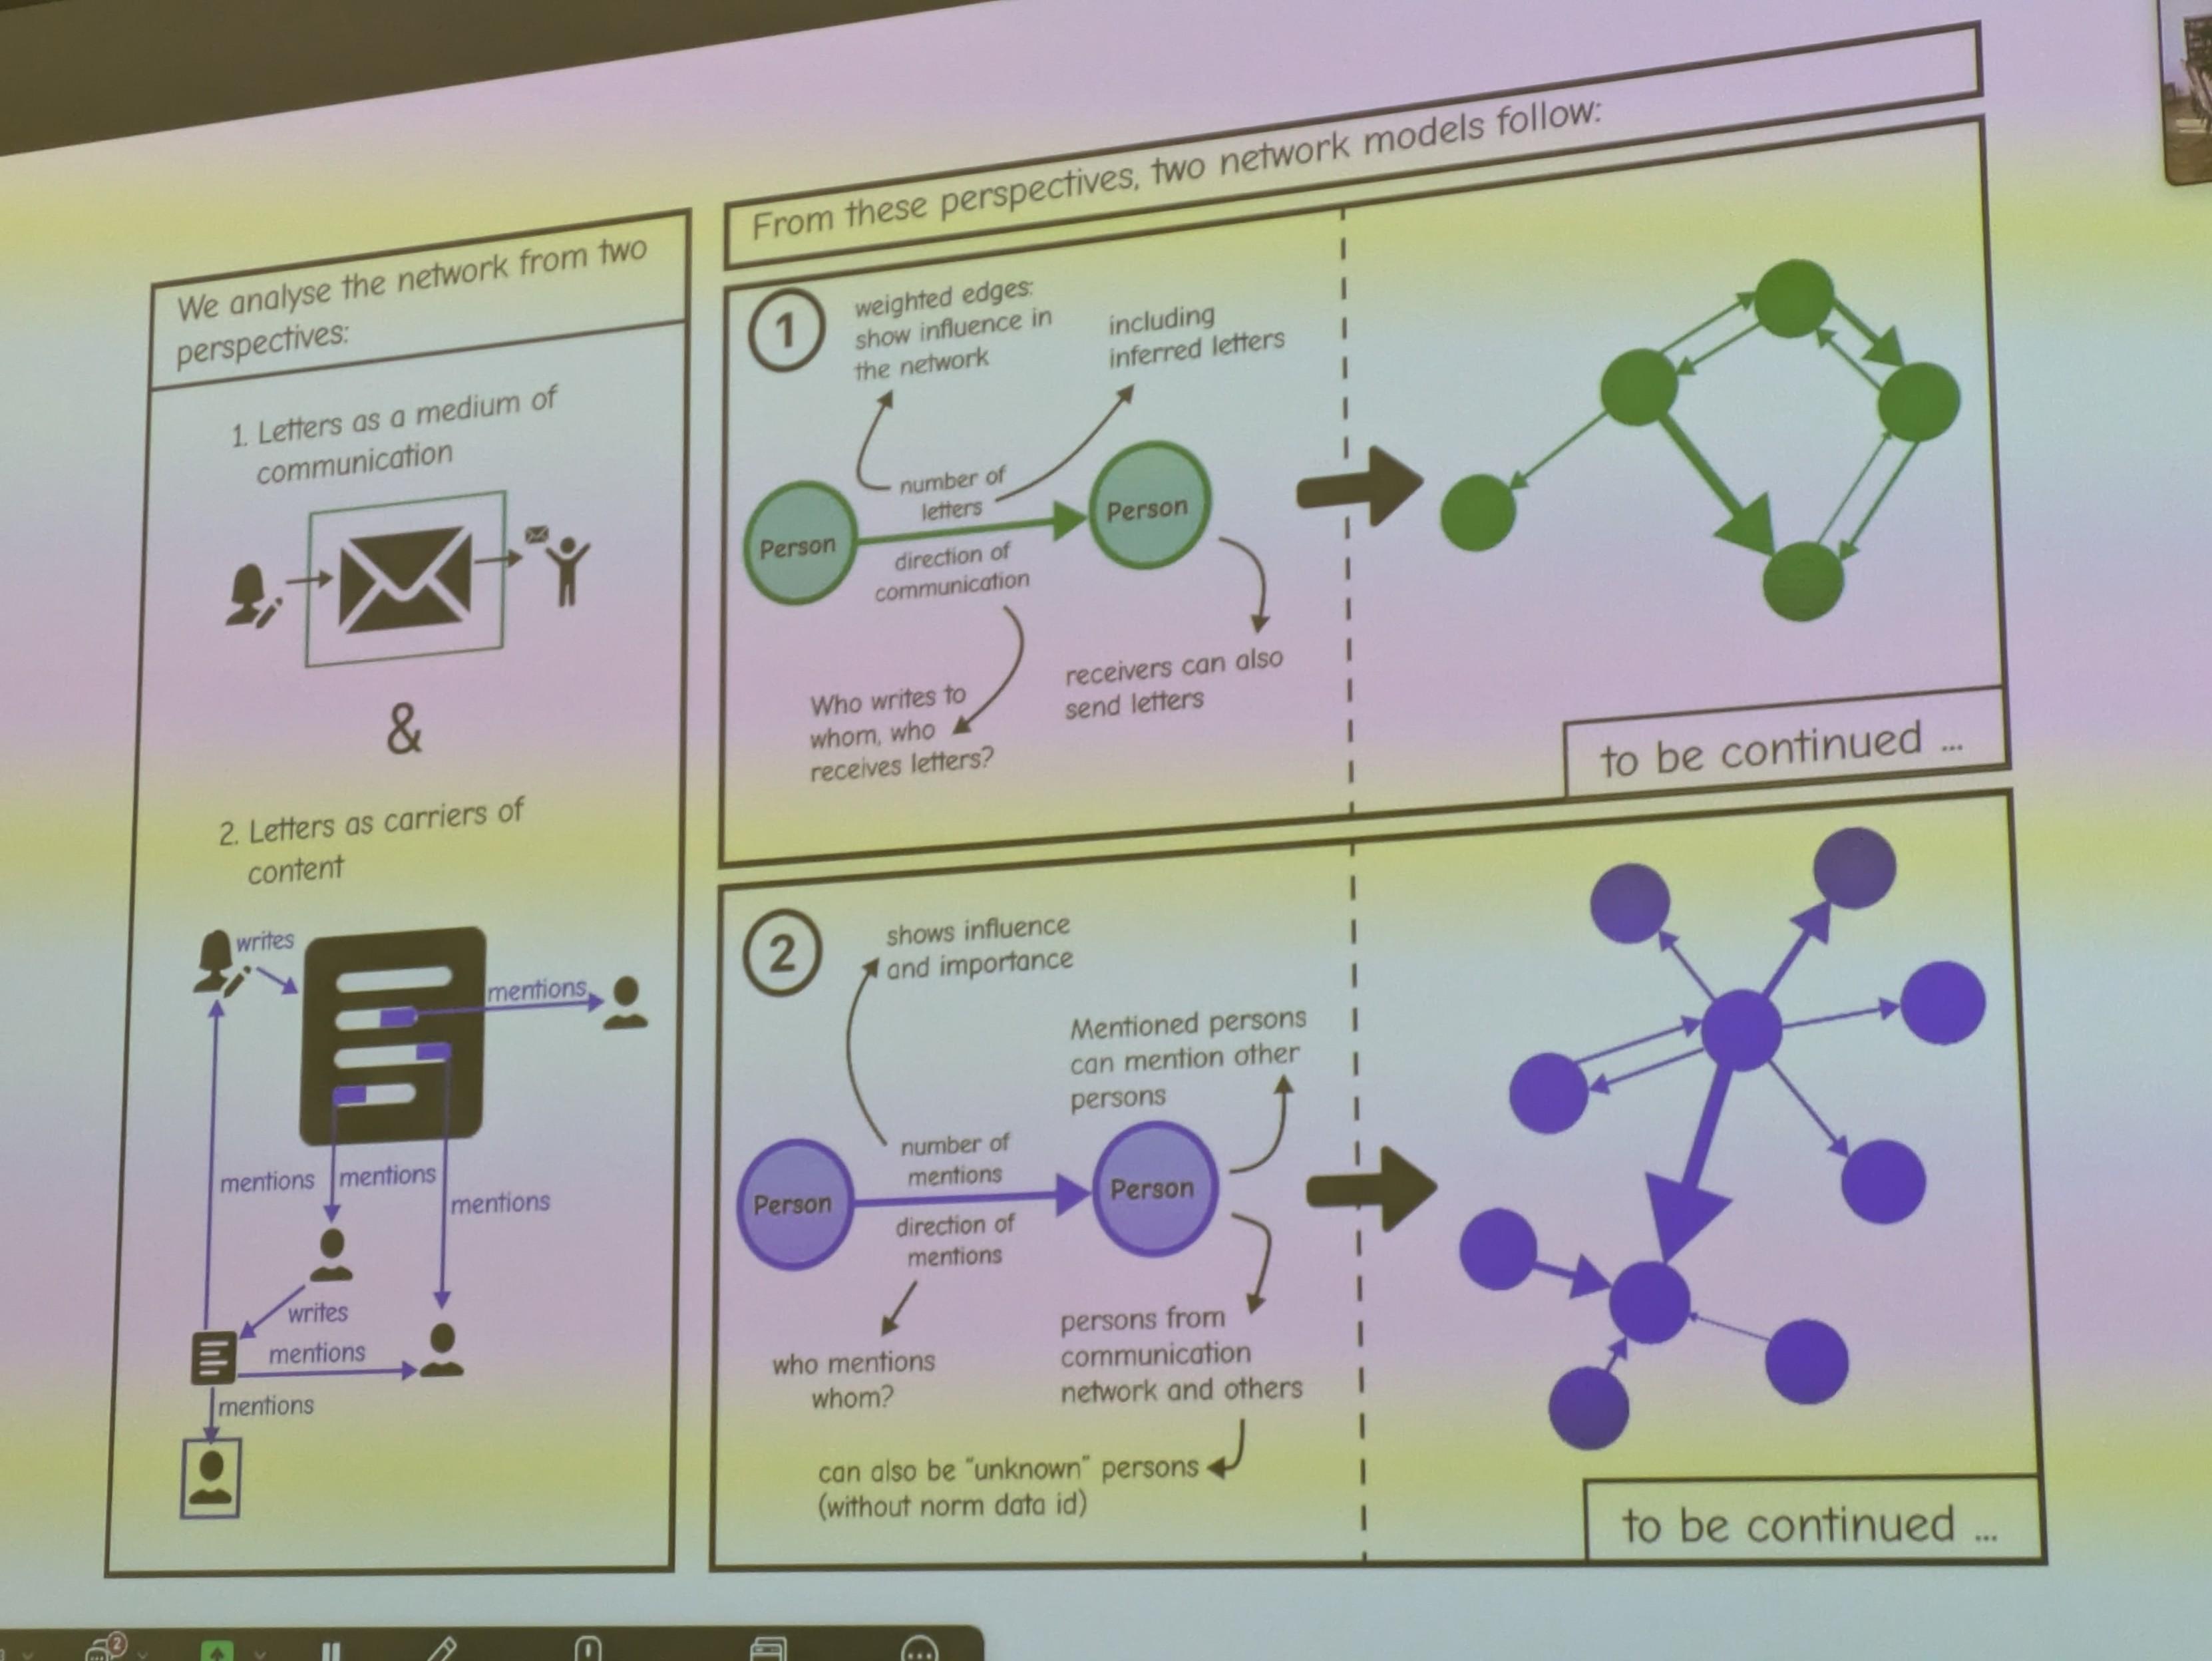
From there you can make different network visualizations such as those you can see below: who sends a letter to whom; who mentions whom...
But it is difficult to communicate about the work by using these visualizations, because it lacks context. It's Haraway's "god trick" once again.
Great illustration of the spaghetti monster, ending up with an impressive graph that doesn't give away its meaning easily by Marcella Tambuscio at #hnr2024
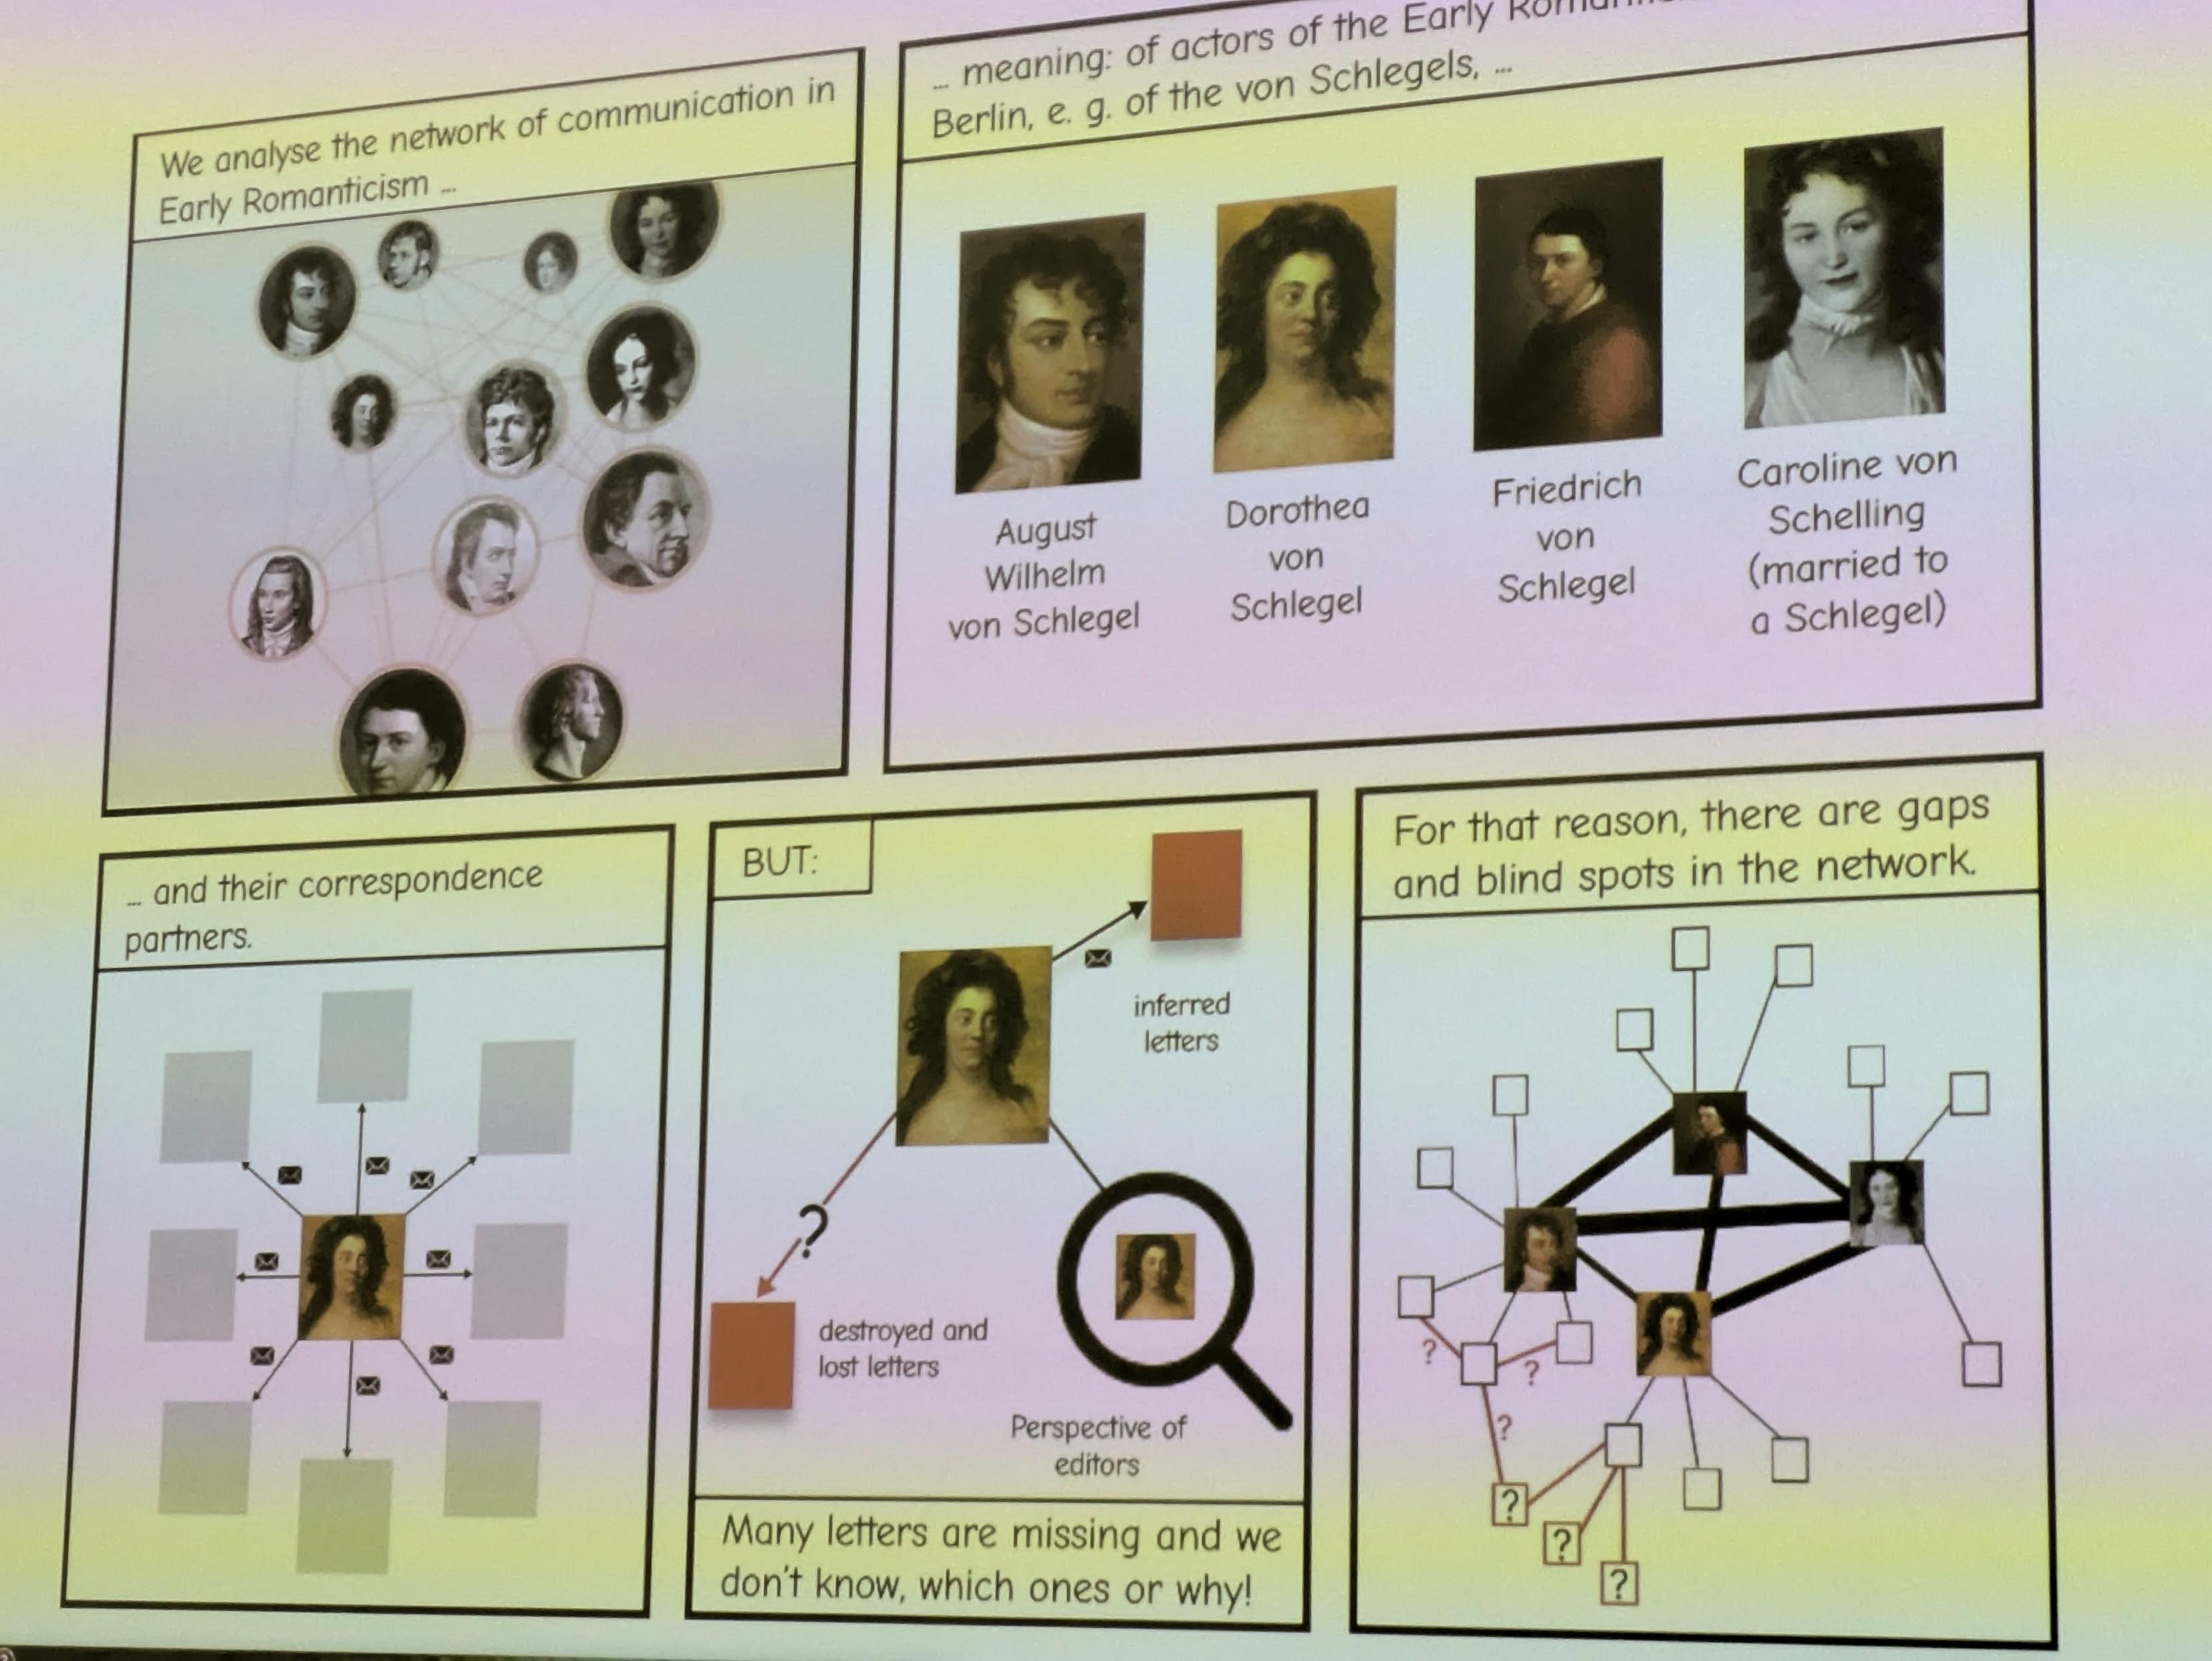
Now Elena Suárez Cronauer and Aline Deicke tell us about how they used graph comics to explore communication networks. Very exciting!
The question is: what is the dynamic within a group of authors sending letters to each other? The goal is to better understand early romanticism.
And it all starts with a knowledge graph in Neo4J, which you can see below. 💪
Client Info
Server: https://mastodon.social
Version: 2025.04
Repository: https://github.com/cyevgeniy/lmst