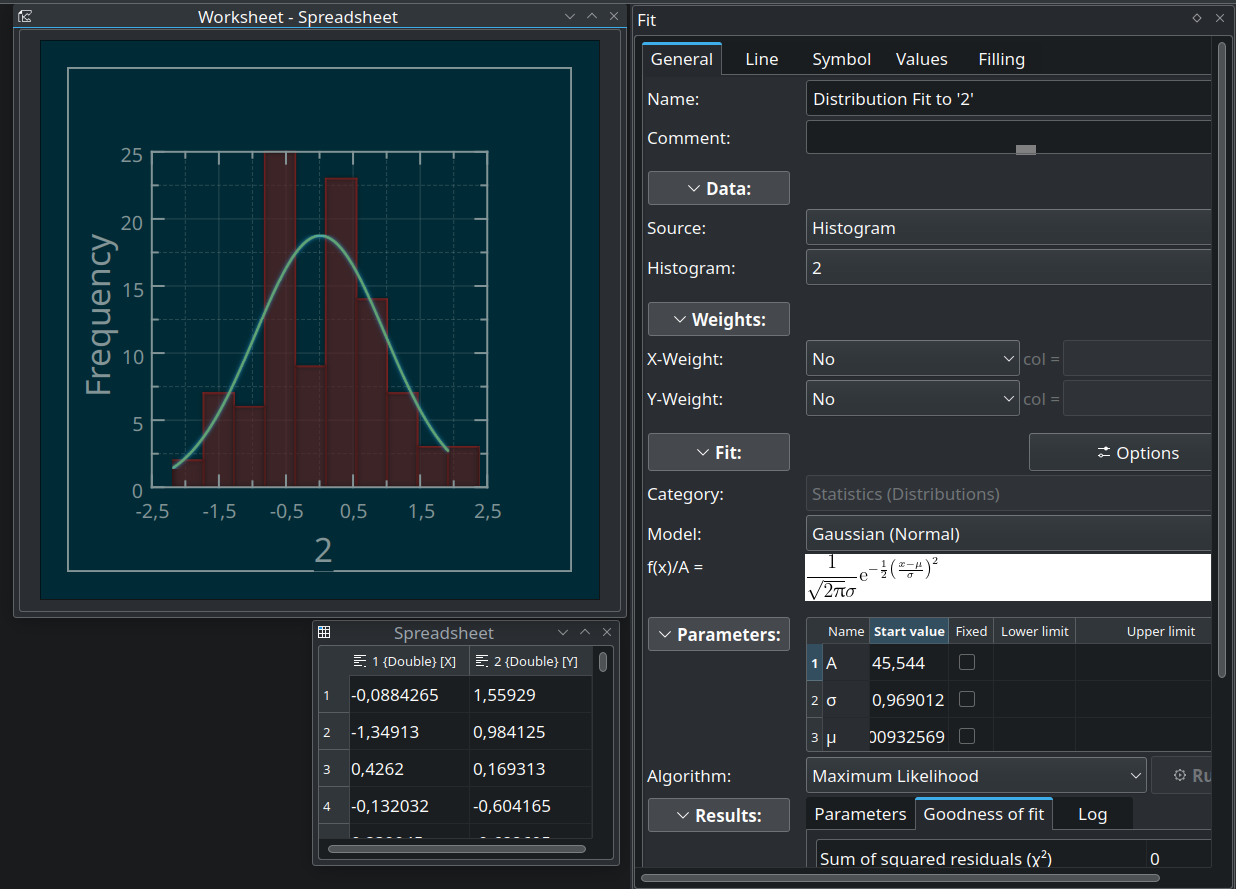
Quick DISTRIBUTION FITTING with @LabPlot (a new development version) in five easy steps:
1. Select a data column in a spreadsheet.
2. Context menu > Plot Data > Histogram.
3. Select the histogram.
4. Context menu > Analysis > Fit your distribution of choice (e.g. Gaussian).
5. Tune the fitting properties (e.g. the Maximum Likelihood or Levenberg–Marquardt algorithm.
#LabPlot #OpenSource #MaximumLikelihood #LevenbergMarquardt #DistributionFitting #Statistics #Gaussian #NormalDistribution