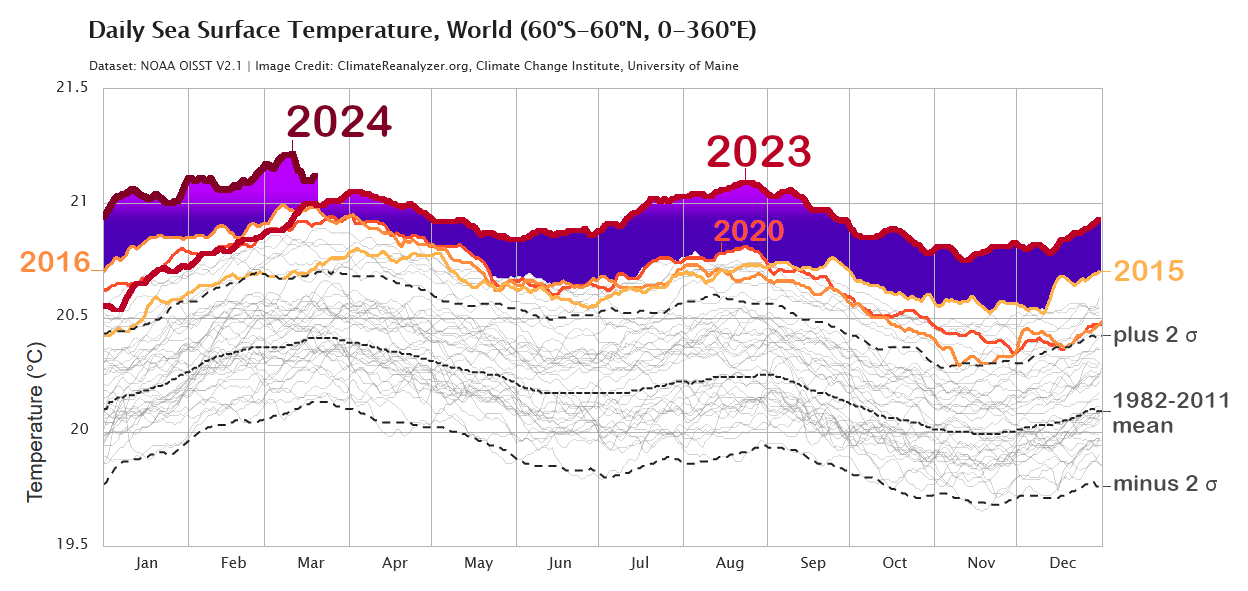
#OISST

Daniele de Rigodderigo@hostux.social
2024-03-20

5/

Updated visualisation of the daily #SeaSurfaceTemperature (SST):

climatereanalyzer.org/clim/sst

(2023-2024 trends highlighted on the diagram exported from the URL above, see "License and Citation" section: "Climate Reanalyzer content is licensed under a #CreativeCommons Attribution 4.0 International License" creativecommons.org/licenses/b )

Data from #NOAA Optimum Interpolation SST (#OISST: ncei.noaa.gov/products/optimum ) - from latitude 60°S to 60°N, global scale.

See also @ZLabe
fediscience.org/@ZLabe/1121233

Daily sea surface temperature (SST), data from #NOAA Optimum Interpolation SST (#OISST: https://www.ncei.noaa.gov/products/optimum-interpolation-sst ) -  from latitude 60°S to 60°N, global scale.

The SST in 2023 exceeded the previous peaks recorded mostly in 2015, 2016, 2020. In 2024, the SST had peaks even higher than in 2023 - showing a temperature anomaly exceeding the previous years (1981 - 2022) with a prolonged fluctuation for more than a full year.

2023-2024 trends highlighted on the diagram exported from
https://climatereanalyzer.org/clim/sst_daily/

See "License and Citation" section: "Climate Reanalyzer content is licensed under a #CreativeCommons Attribution 4.0 International License Creative Commons License" https://creativecommons.org/licenses/by/4.0/ )

Client Info

Server: https://mastodon.social
Version: 2025.04
Repository: https://github.com/cyevgeniy/lmst