When it comes to making informed decisions about inventory pricing, having access to powerful analytics data is crucial. Competitively pricing your inventory makes a big difference when it comes to maximizing sponsorship revenue.
That’s where Blinkfire’s inventory management tool (BIM) steps in, providing you with comprehensive insights and AI-driven pricing recommendations to help further develop partnerships and sales strategies.
Pricing Insights Report
We continue to see that data-driven decisions maximize revenue for our customers. Our Pricing Insights report calculates the average sales price of your target assets across all proposals they’ve been included in.
With this data, you can compare the average sales price to the listed price and determine whether adjustments are needed. Plus, our sell-through rate metric gives you valuable insight into how well your assets are performing in the market.
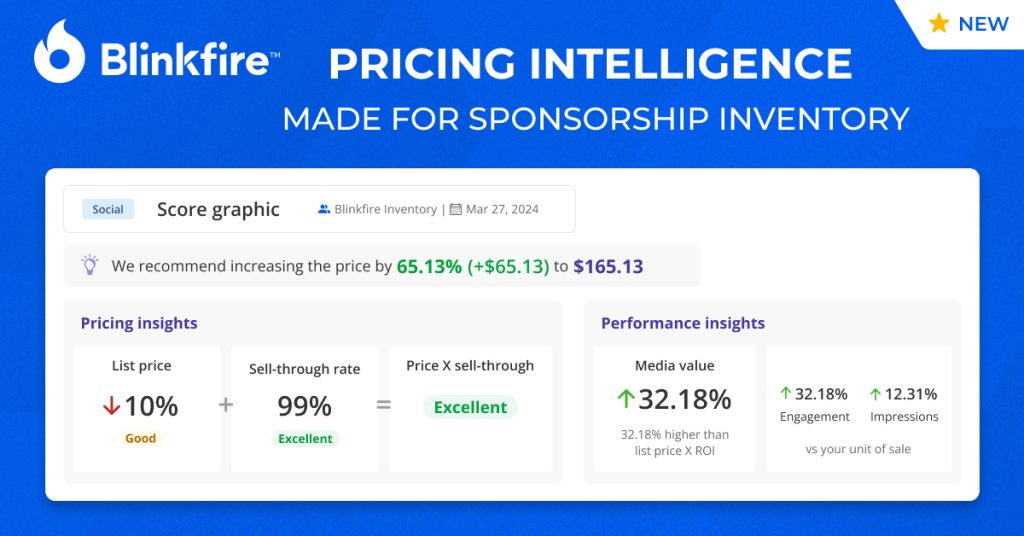
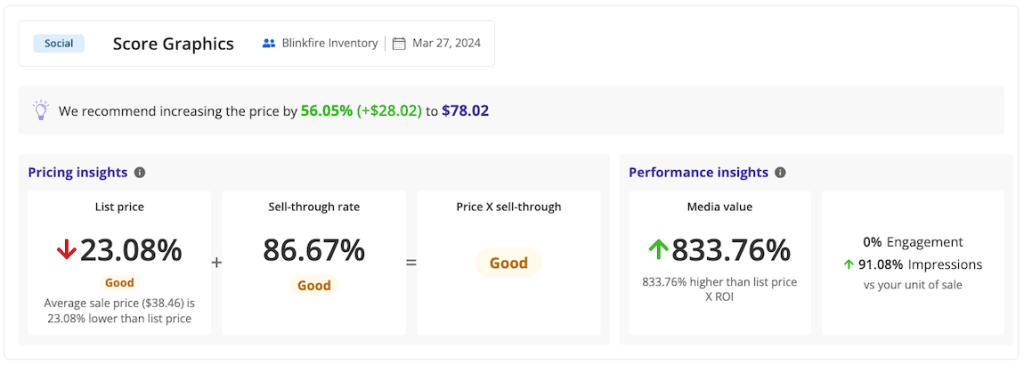
List Price: This card compares the average sales price of the target asset to its listed price by showing the actual average sales price. It also shows the percentage difference between the listed price and the average sales price, which have three statuses: “Poor” “Good” and “Excellent”.
Sell-through rate: This shows a percentage value for how many of the available units were actually sold compared to how many units of that asset exist in the inventory.
Price x Sell-through: This is a combination metric to show how the asset is selling through and at what price. This gives insight into the sales velocity and strength of each target asset.
Based on analytics measured for all goals connected to your target assets, our Performance Insights section provides you with a deep dive into media exposure KPIs such as media value, engagements, and impressions. This data allows you to assess the effectiveness of your assets and make informed decisions about their pricing.
Media value: This card shows the media valuation driven by the target asset adjusted for any ROI values set on the asset in the Inventory List.
Engagement: This KPI shows the percentage of engagements driven by the target asset above or below the target value in all attached Goals.
Impressions: This KPI shows the percentage of impressions driven by the target asset above or below the target value in all attached Goals.
Pricing Recommendations
Our tool goes a step further by generating pricing recommendations for partnership assets based on the insights gathered. By combining data from the Pricing Insights and Performance Insights sections, we provide you with actionable recommendations to optimize your inventory pricing strategy.
With direct access to the Pricing Insights report from your customized inventory lists, along with consolidated information such as recommended list prices and sell-through rates, you’ll have everything you need to make data-driven decisions about your inventory pricing strategy. Don’t miss out on maximizing the value of your inventory assets!
Start Pricing and Tracking Your Inventory with Blinkfire
Are you tired of relying on Excel spreadsheets to manage your inventory, proposals, and deliveries? It’s time to upgrade to our customizable dashboards, designed to streamline deal management, track deliverables, and monitor goals across your organization. Let us handle the heavy lifting so you can focus on selling and executing your partnerships more efficiently!
Demo Blinkfire#blinkfireAnalytics #insights #Inventory #listPrice #MediaValue #Pricing #sales #SellThrough #socialMedia #Sponsorship