Visual Enhancement Tool! Use Renko and Heikin Ashi to Understand Market Trends
In quantitative trading, the traditional K-line chart is one of the most commonly used data presentation forms, but it also has certain limitations, such as insensitivity to fluctuations or excessive noise. In order to observe price trends more clearly, traders often use some improved charts.
#trading #crypto #data #renko #chart #heikinashi #backtest #trend #code #javascript
https://www.fmz.com/digest-topic/10676
#backtest
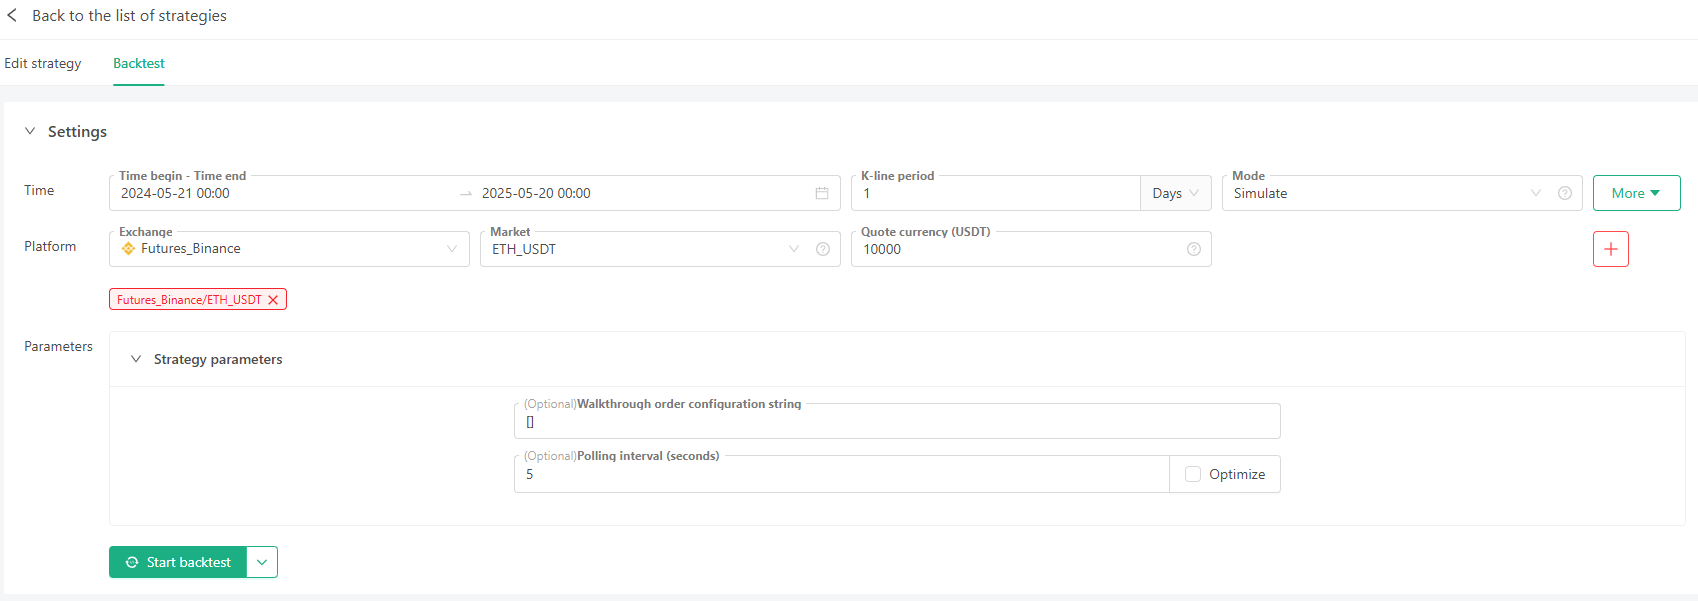
Building A Multi-Account Walkthrough System That Supports MyLanguage and Pine Strategy Language
In order to allow users to get started and focus on strategy logic, both have done a lot of encapsulation and abstraction at the language level, but this has also sacrificed a certain degree of flexibility: by default, only single-account, single-product strategy execution models are supported.
#mylanguage #pine #code #strategy #trading #backtest #logic #docker #API #risks
https://www.fmz.com/bbs-topic/10665
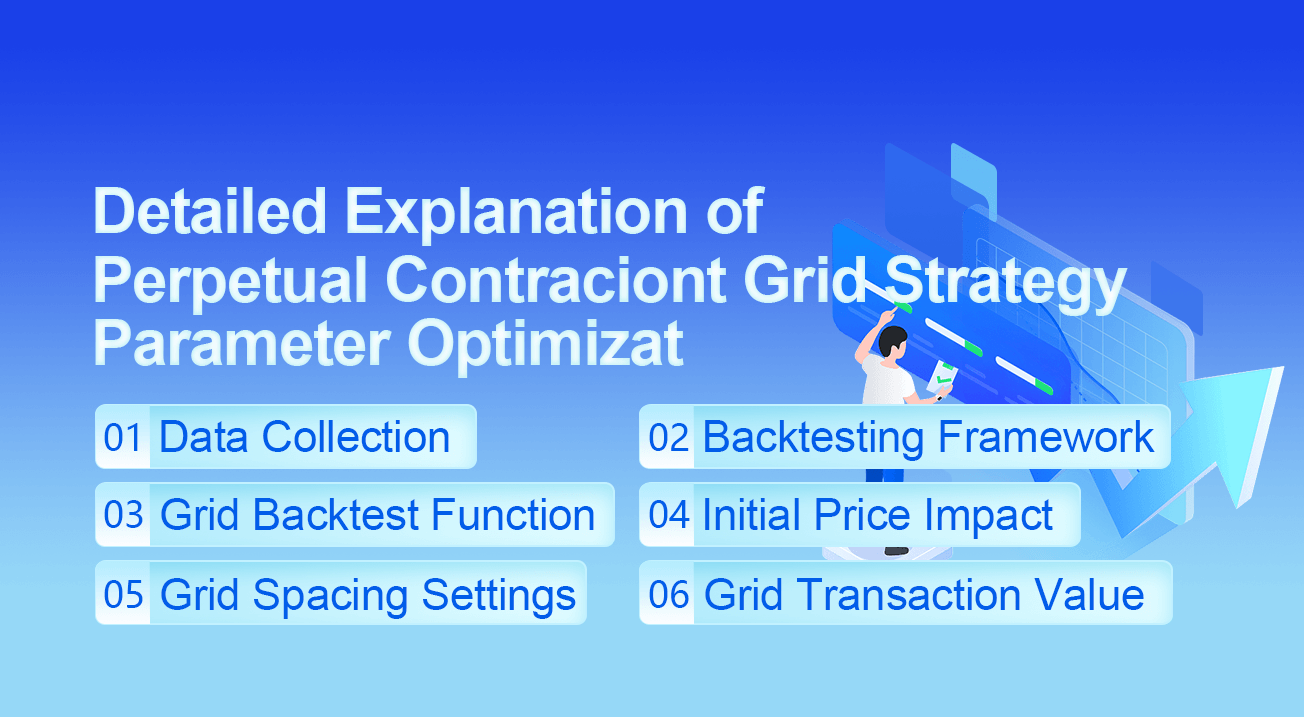
Detailed Explanation of Perpetual Contract Grid Strategy Parameter Optimization
In this article, we will introduce the complete Python backtesting process, including data collection, backtesting framework, backtesting functions, parameter optimization, etc. You can try it yourself in juypter notebook.
#python #data #code #crypto #trading #grid #backtest #framework #market #risks
https://www.fmz.com/bbs-topic/10317
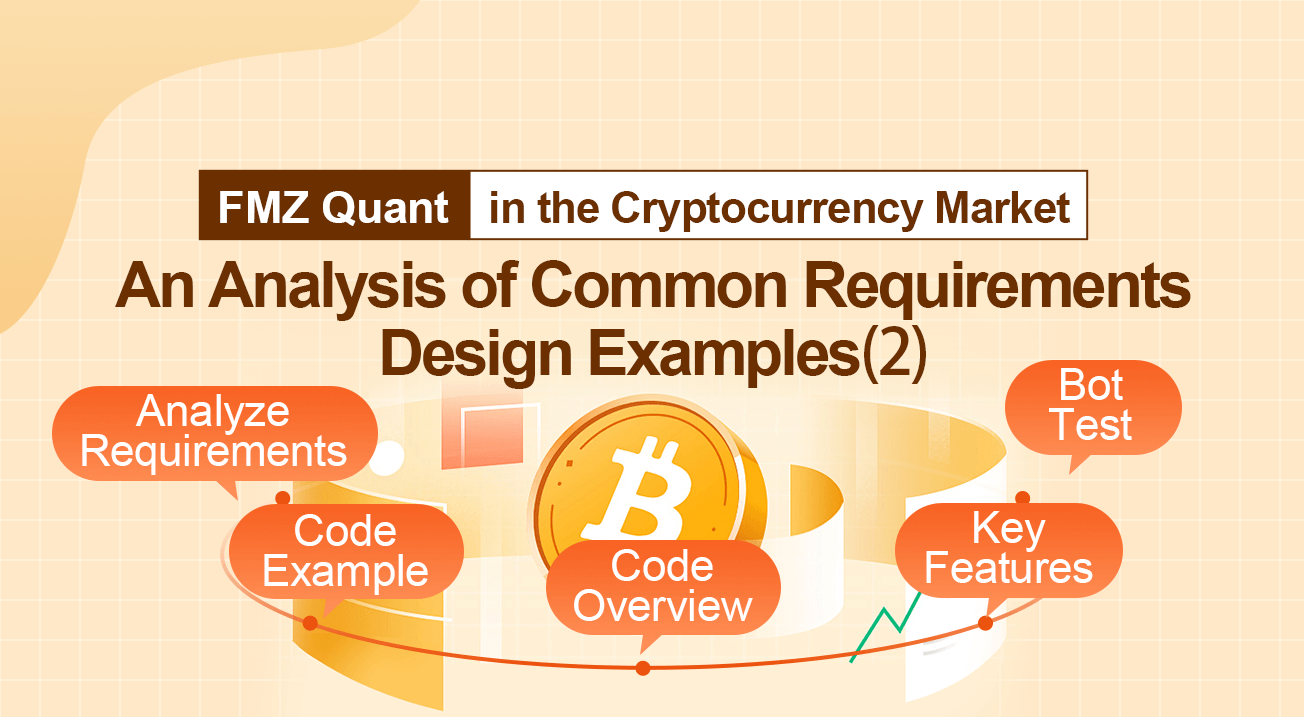
An Analysis of Common Requirements Design Examples in the Cryptocurrency Market (II)
In response to the comments from readers in the previous article, they requested a program example for monitoring contract account transfers. In this article, we will use Binance exchange as the test object to implement the requirement and learn how to design it together.
#Binance #crypto #trading #analysis #contract #javascript #code #data #backtest #strategy
https://www.fmz.com/bbs-topic/10332
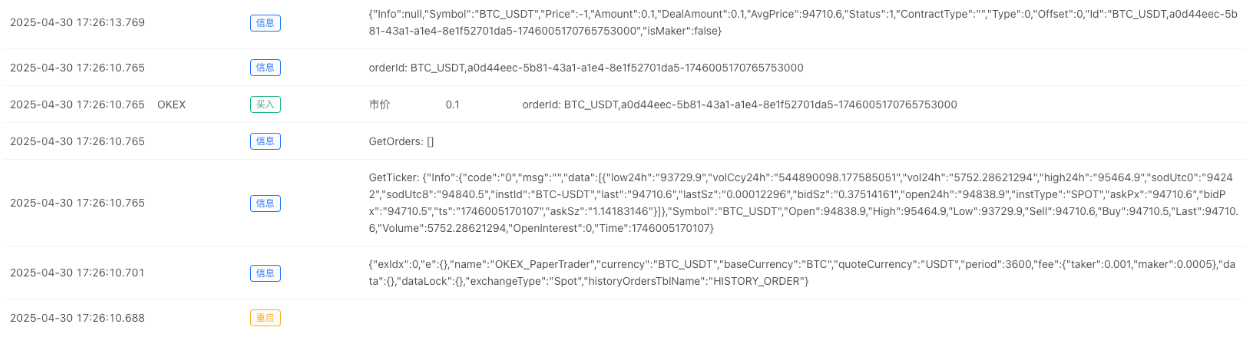
Design of Real Ticker Driven Simulation Trading System
This article will explain the design concept and key implementation from the aspects of system architecture, matching mechanism, interface compatibility, etc., and provide a complete practical demonstration case to help quantitative strategies build a safe and reliable "intermediate sandbox" before going online.
#ticker #trading #crypto #strategy #backtest #code #simulation #order #PaperTrader #position
https://www.fmz.com/bbs-topic/10657
The Go-Anywhere Quantitative Journey Starts from FMZ
This article will take you from 0 to quickly get started with FMZ, feel the charm of automated trading, and use data and strategies to master the market rhythm. Whether you are a beginner or a veteran seeking to improve efficiency, this journey is worth a try.
#crypto #trading #strategy #code #parameter #backtest #position #control #javascript #order
https://www.fmz.com/bbs-topic/10645
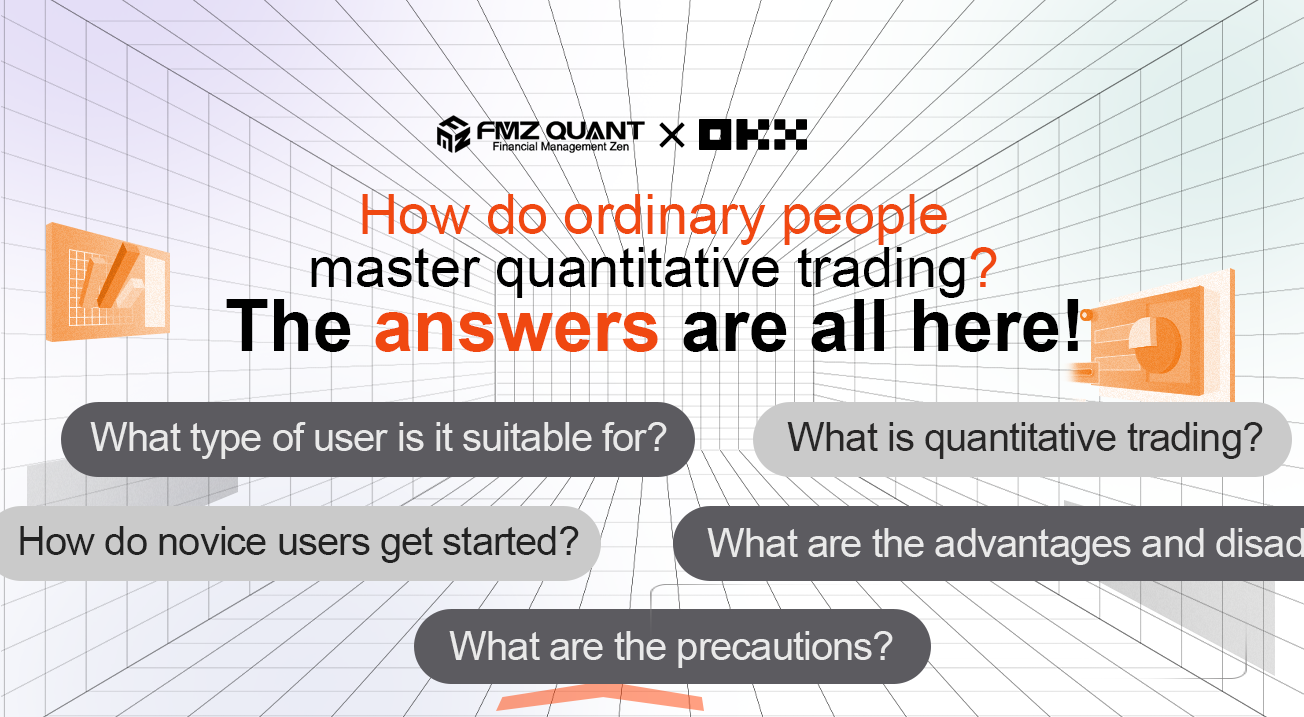
How Do Ordinary People Master Quantitative Trading? The Answers Are All Here!
How to see through the complex data and discover valuable information to optimize trading strategies has always been a hot topic in the market. To this end, OKX has specially planned the "Insight Data" column, and cooperated with mainstream data platforms.
#OKX #crypto #trading #strategy #platform #data #profits #backtest #analysis #market
https://www.fmz.com/bbs-topic/10458
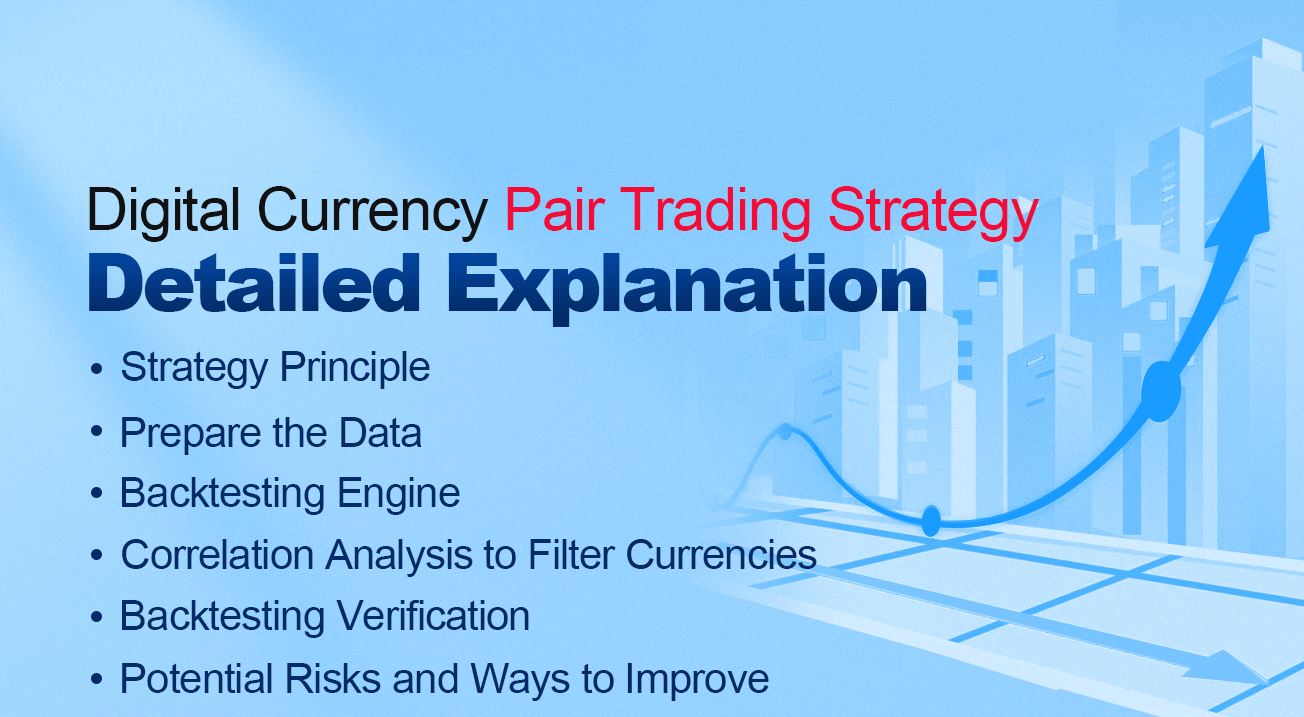
Detailed Explanation of Digital Currency Pair Trading Strategy
Pair trading strategies rely on the historical correlation between the prices of two digital currencies. When the prices of two currencies show a strong correlation, their price trends are generally in sync.
#trading #crypto #strategy #data #backtest #analysis #risks #market #trend #debug
https://www.fmz.com/bbs-topic/10459
How to Build a Universal Multi-Currency Trading Strategy Quickly
Especially for multi-currency strategies, obtaining market conditions, accounts, and transactions are much simpler than before, and IO functions are no longer required to access the exchange's API interface. For backtesting, it has also been upgraded to be compatible with live trading.
#trading #backtest #crypto #strategy #docker #market #code #API #ticker #exchange
https://www.fmz.com/bbs-topic/10508
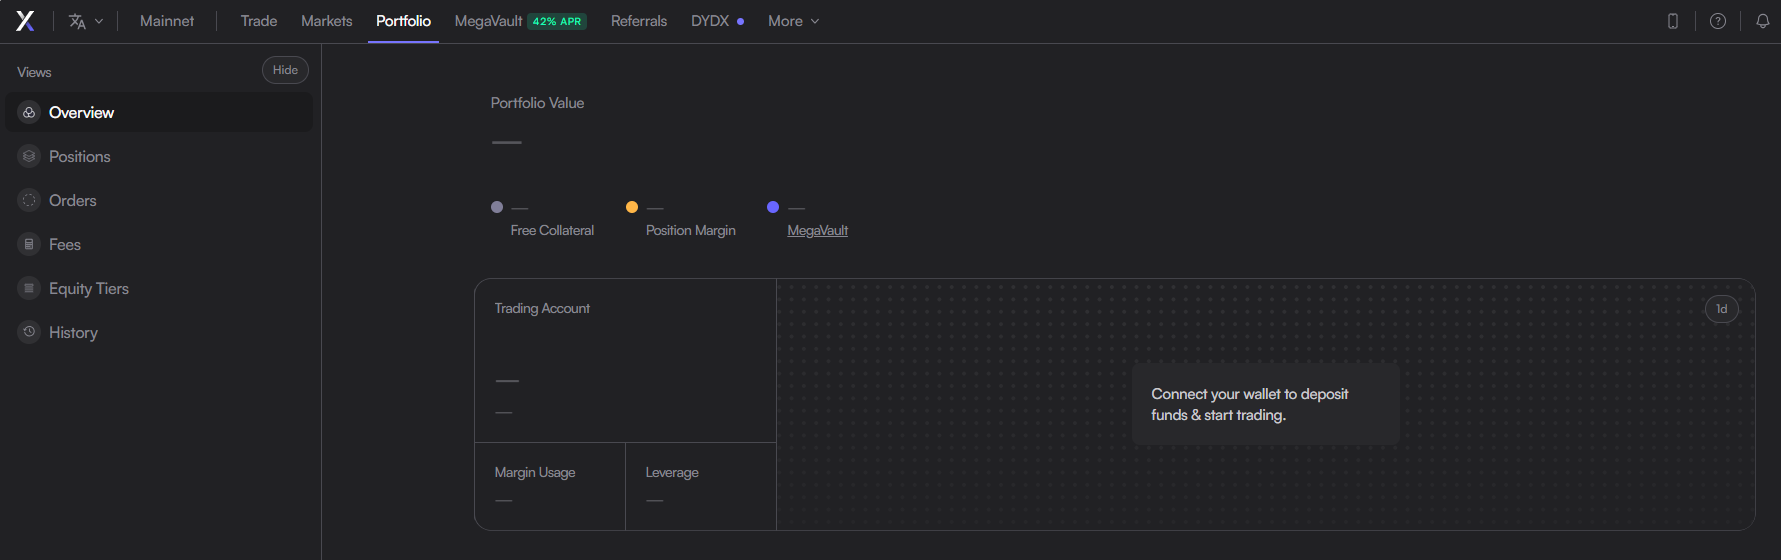
Quantitative Practice of DEX Exchanges (1) -- dYdX v4 User Guide
As one of the most popular decentralized trading platforms, dYdX provides powerful trading functions and supports futures perpetual contract trading. Its latest version v4 optimizes performance and user experience, making it the first choice for many quantitative traders.
#trading #dydx #crypto #code #exchange #market #data #backtest #API #order
https://www.fmz.com/bbs-topic/10566
A Complete Solution for Receiving Signals with Built-in Http Service in Strategy
In this article, let's implement a complete solution of using strategy built-in Http service to receive signals.Because the built-in services in the strategy can use Http or HTTPS, for a simple demonstration, we use the Http protocol, add IP whitelist verification, and add password verification.
https://www.fmz.com/bbs-topic/10558
#trading #code #cryptocurrency #signal #strategy #backtest #data #market #exchange #http
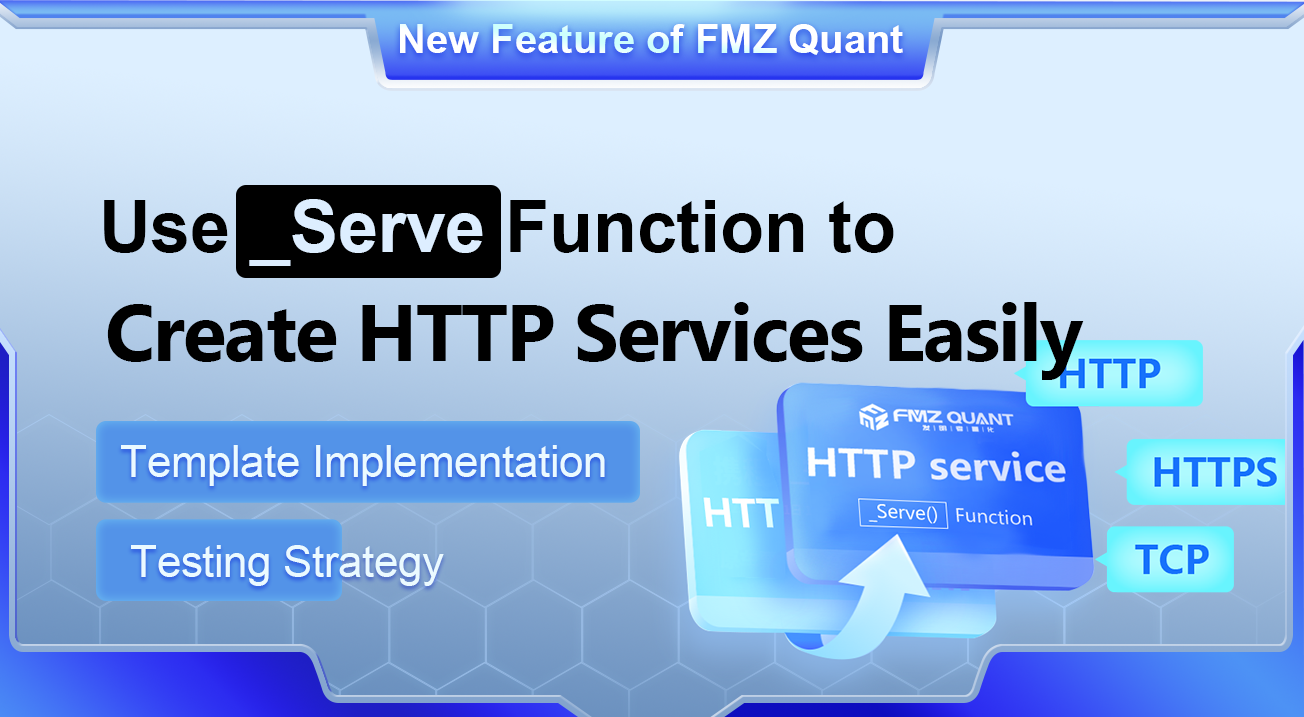
Use _Serve Function to Create HTTP Services Easily
This article will introduce the usage scenarios and basic operations of the function _Serve() to help you quickly get started with this new function.
https://www.fmz.com/bbs-topic/10532
#trading #crypto #strategy #code #backtest #OKX #exchange #protocol #function #javascript
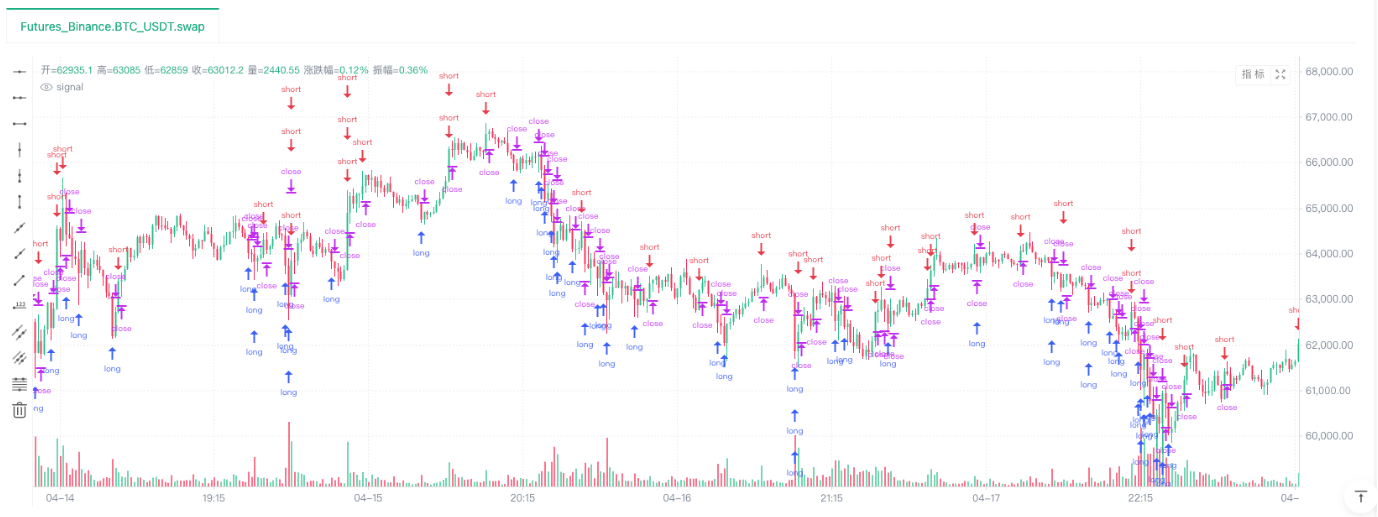
Discussion on Strategy Testing Method Based on Random Ticker Generator
In the field of quantitative trading, the development and optimization of strategies cannot be separated from the verification of real market data. However, in actual applications, due to the complex and changing market environment, relying on historical data for backtesting may be insufficient.
#trading #crypto #market #data #ticker #strategy #backtest #python #code #volatility
https://www.fmz.com/strategy/473286
Looking for others interesting trading that are in the fediverse #VSA #PriceAction #SP500 #nasdaq #TomWilliams #finance #HelloOutThere #Trading #Backtest
Gerade entdeckt: https://curvo.eu/backtest/
Client Info
Server: https://mastodon.social
Version: 2025.04
Repository: https://github.com/cyevgeniy/lmst