Our preprint about #datavzrd is finally published: https://doi.org/10.1101/2025.04.03.647146. Furthermore, #datavzrd has now been downloaded 500k times. https://datavzrd.github.io
#datavzrd
Excited to share that our preprint, Datavzrd: Rapid programming- and maintenance-free interactive visualization and communication of tabular data, is now up on bioRxiv! 🎉 #datavzrd
Among these, the #datavzrd version of the supplement of the fascinating Moscot paper from Fabian Theis' lab (https://doi.org/10.1038/s41586-024-08453-2) . https://datavzrd.github.io/example-report-moscot/. Using the suggest and publish subcommands, such reports are can now be created even faster.
The #Datavzrd docs now show 4 example reports from various disciplines (bioinf, social, astronomy, anthropology). This illustrates how it can replace spreadsheet supplementaries with visual and interactive interfaces. Thanks to @fxwiegand.mastodon.social for the work! https://datavzrd.github.io/docs/examples.html
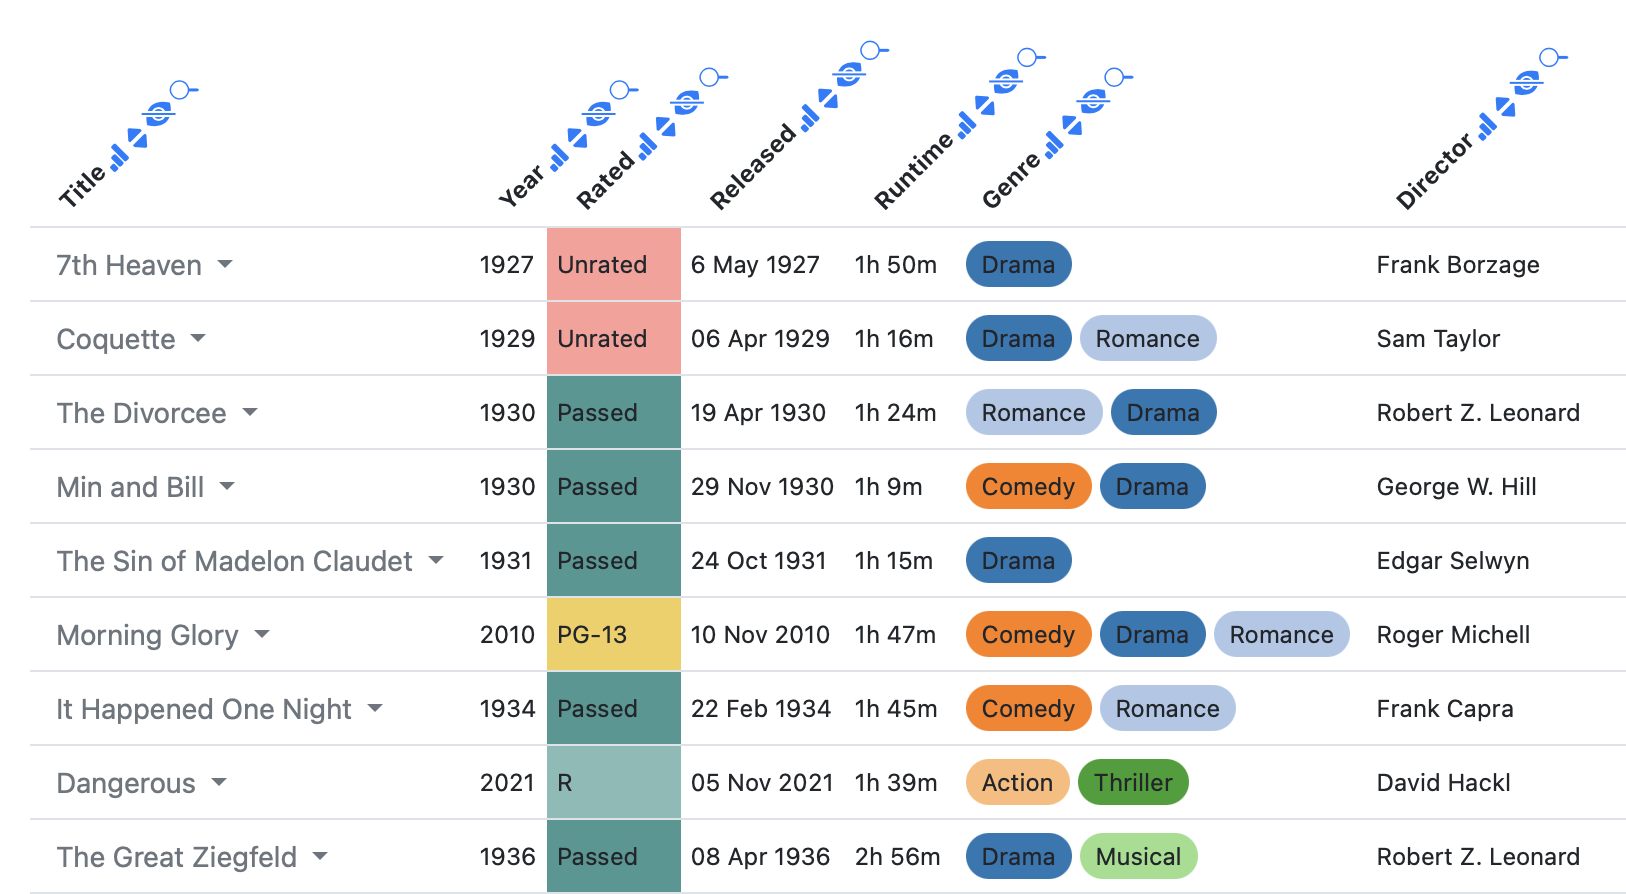
The latest #datavzrd version introduces a new pills option to visualize multiple values in a single table cell, with each ordinal value represented by a distinct color. @johanneskoester https://datavzrd.github.io
My PhD student Felxi Wiegand has released #datavzrd 2.46 (https://datavzrd.github.io). We have added two new subcommands: "datavzrd suggest" auto-generates a config from given tables. "datavzrd publish" automatically publishes a given report to github pages:
https://github.com/datavzrd/datavzrd/releases/tag/v2.46.0
I am thrilled to see #Datavzrd being used to get portable interactive visual output tables in #srahunter: https://www.biorxiv.org/content/10.1101/2024.03.19.585745v2
#datavzrd has a new spell for rendering tables columns containing clinical significance terms (from ClinVar) as colored badges: https://datavzrd.github.io/docs/spells.html#clin-sig
#Datavzrd, our tool for rapid and server-free visualization of tabular data now supports spells, which enable to share and collaborate on column visualizations and thereby extend Datavzrd further: https://datavzrd.github.io/docs/spells.html
There is a new #Snakemake tutorial that complements the general tutorial by specifically introducing how to use #Snakemake for plotting and interactive reporting, including how to combine #Snakemake with #Datavzrd: https://snakemake.readthedocs.io/en/stable/tutorial/interaction_visualization_reporting/tutorial.html
The resulting continuously updated reports nicely illustrate the power of combining #snakemake with #datavzrd: https://ncbench.github.io/report/report.html
#datavzrd, our tool for rendering modern interactive, visual, server-free, tabular scientific HTML reports with zero/low-code (https://datavzrd.github.io), now has a tutorial (1-2h): https://datavzrd.github.io/docs/tutorial.html.
The small variant calling benchmarking initiative of NGS-CN is published. Thanks a lot to all the contributors and @dfg_public
for the funding. Here is the paper: https://doi.org/10.12688/f1000research.140344.1
In short: we have implemented a continuous, driven benchmark of small genomic variant calling results: calls on @ZENODO_ORG
, evaluation via #snakemake inside @github
actions, reporting via #datavzrd, contribution via pull requests. (1/x)
#datavzrd 2.8 is released, adding export to Excel (from the browser), in addition to the already existing Vega-Lite export. #biodata22 https://github.com/koesterlab/datavzrd
Tomorrow at the CSHL biological data science meeting I will talk about our new tool #Datavzrd, which allows to rapidly generate interactive visually appealing HTML tables from a YAML file that points to CSV/TSV tables which can be linked between each other. #Datavzrd provides the ability to render columns as plots (tick, bar, heatmap), have automatic linkouts, cells with custom HTML and custom #Vega and #Vega-lite plots. By precomputing the paging, it can easily deal with big data. #Science
Client Info
Server: https://mastodon.social
Version: 2025.04
Repository: https://github.com/cyevgeniy/lmst