FX 超絶シンプル! 聖杯探しに疲れた人のための 1時間足ゆったりトレード手法。
#FX会社 #トレンドライン #迷晴れFX #サラリーマン #金持ち #FX業者 #移動平均線 #比較 #ナンピン #市場 #口座開設 #ヘッジファンド #ランキング #儲け #転職 #為替 #エントリー #人気 #円高 #トレンド #投資 #MACD #プライスアクション #ポンドドル #起業 #ドル円 #主婦 #インジケータ #ユロ円 #精神 #スキ...
FX 超絶シンプル! 聖杯探しに疲れた人のための 1時間足ゆったりトレード手法。
#FX会社 #トレンドライン #迷晴れFX #サラリーマン #金持ち #FX業者 #移動平均線 #比較 #ナンピン #市場 #口座開設 #ヘッジファンド #ランキング #儲け #転職 #為替 #エントリー #人気 #円高 #トレンド #投資 #MACD #プライスアクション #ポンドドル #起業 #ドル円 #主婦 #インジケータ #ユロ円 #精神 #スキ...

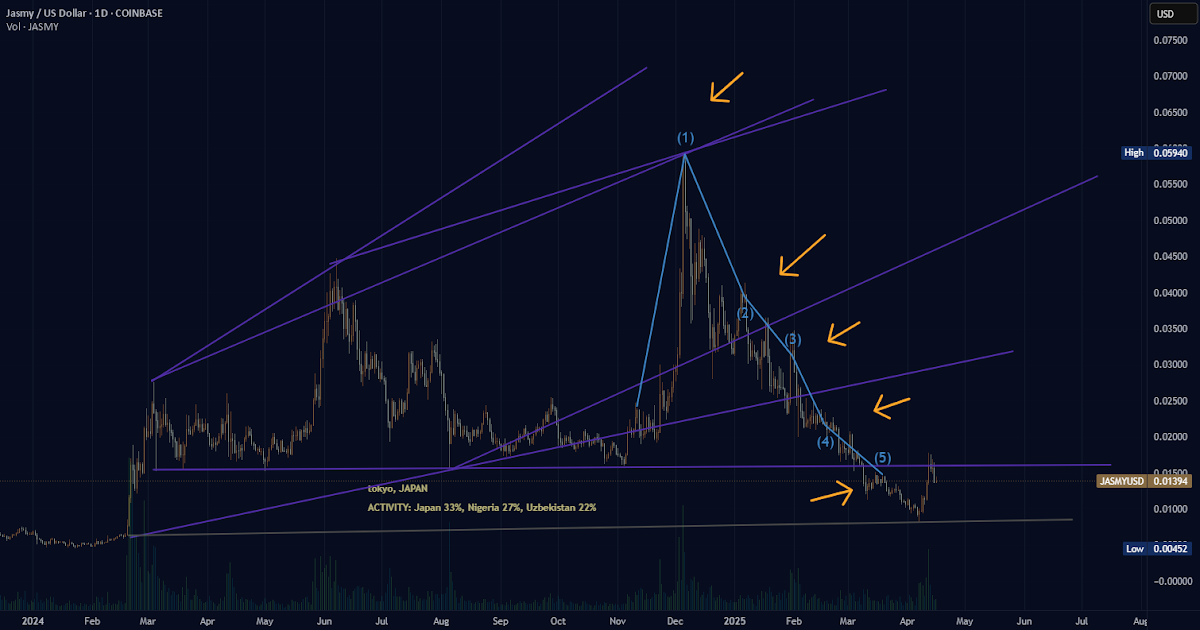
(JASMY) jasmy "sectioned macd - wave phase" http://dlvr.it/TKC8QX #Jasmy #MACD #Trading #Cryptocurrency #Investing
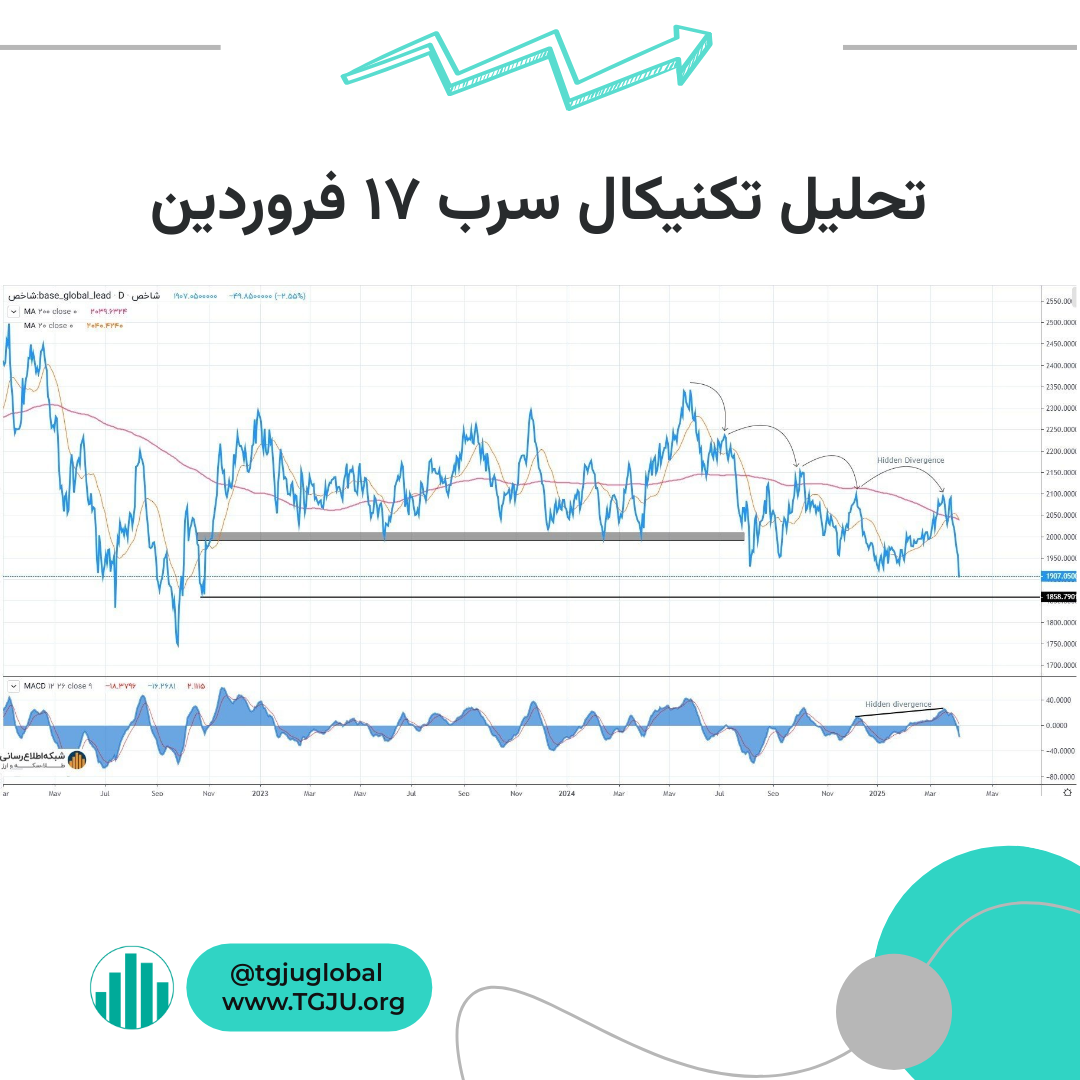
📉تحلیل تکنیکال سرب - 17 فروردین
بازار سرب پس از شکست MA 200 و فشار فروش شدید وارد فاز اصلاحی شده. واگرایی پنهان در MACD و شکست MA 20 نشان دهنده ادامه روند نزولی است. هدف بعدی سطح 1858 واحد.
لینک خبر:https://zurl.co/t2cli

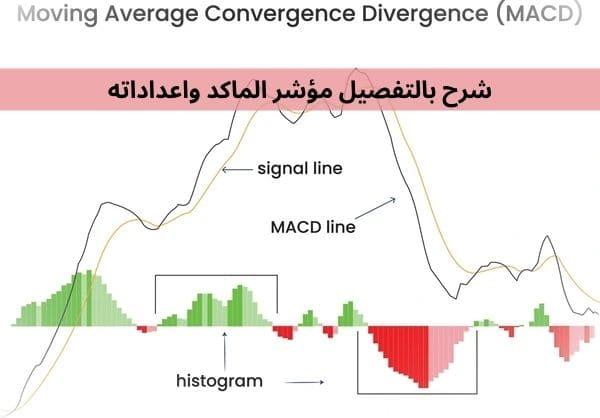
شرح بالتفصيل مؤشر الماكد واعداداته 2025
مؤشر #الماكد (#MACD) هو أداة تحليل فني تُستخدم لتقييم الاتجاهات في السوق. يرمز MACD إلى “#Moving #Average Convergence #Divergence ” (تقارب واختلاف المتوسطات المتحركة)
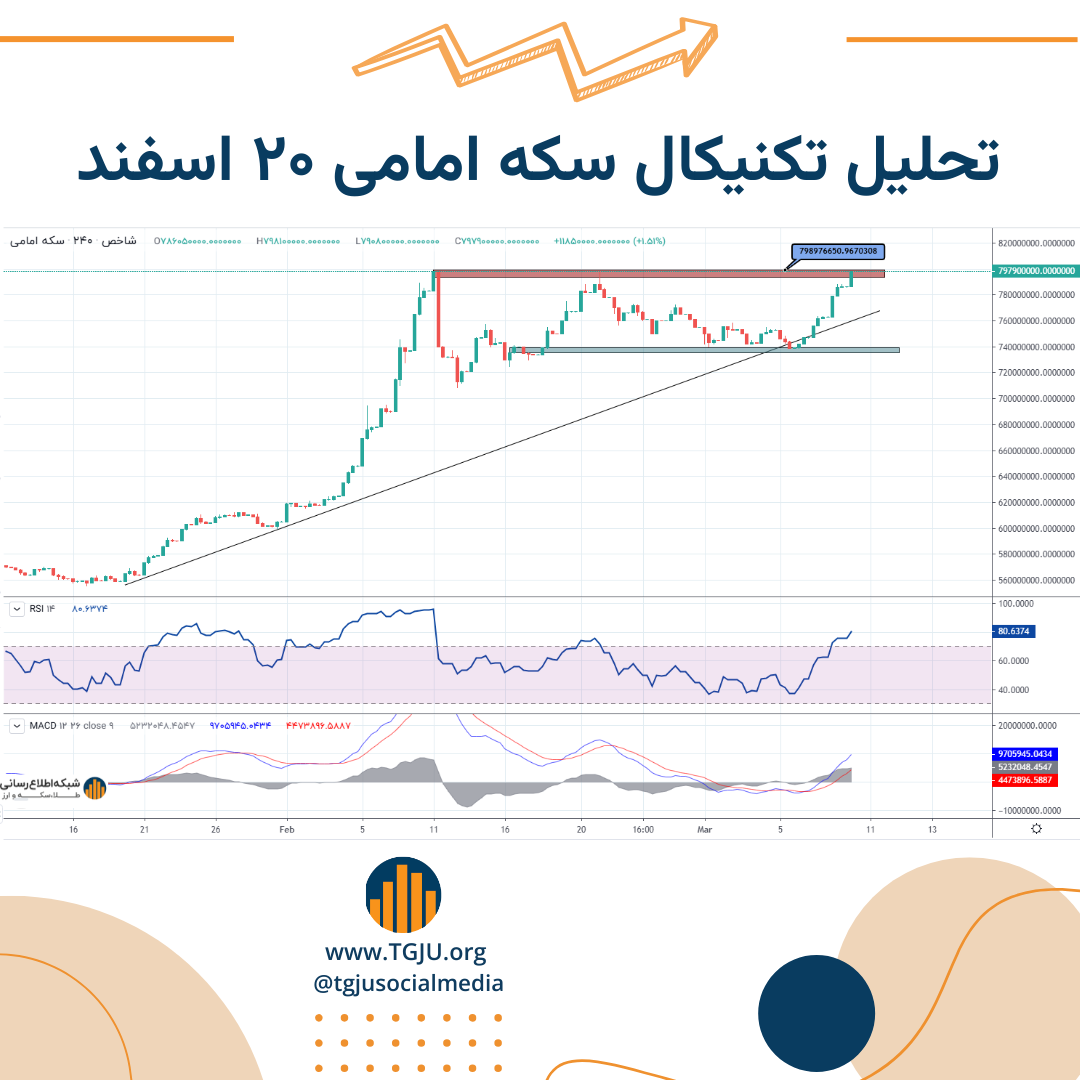
📈تحلیل تکنیکال سکه امامی - ۲۰ اسفند ۱۴۰۳💰
سکه امامی به ۷۸.۲۹ میلیون تومان رسید و پس از آن وارد اصلاح به حمایت ۷۰ میلیون تومان شد. RSI در سطح ۸۰ و سیگنالهای مثبت MACD روند صعودی را تقویت میکند.
لینک خبر:https://zurl.co/b3jIu

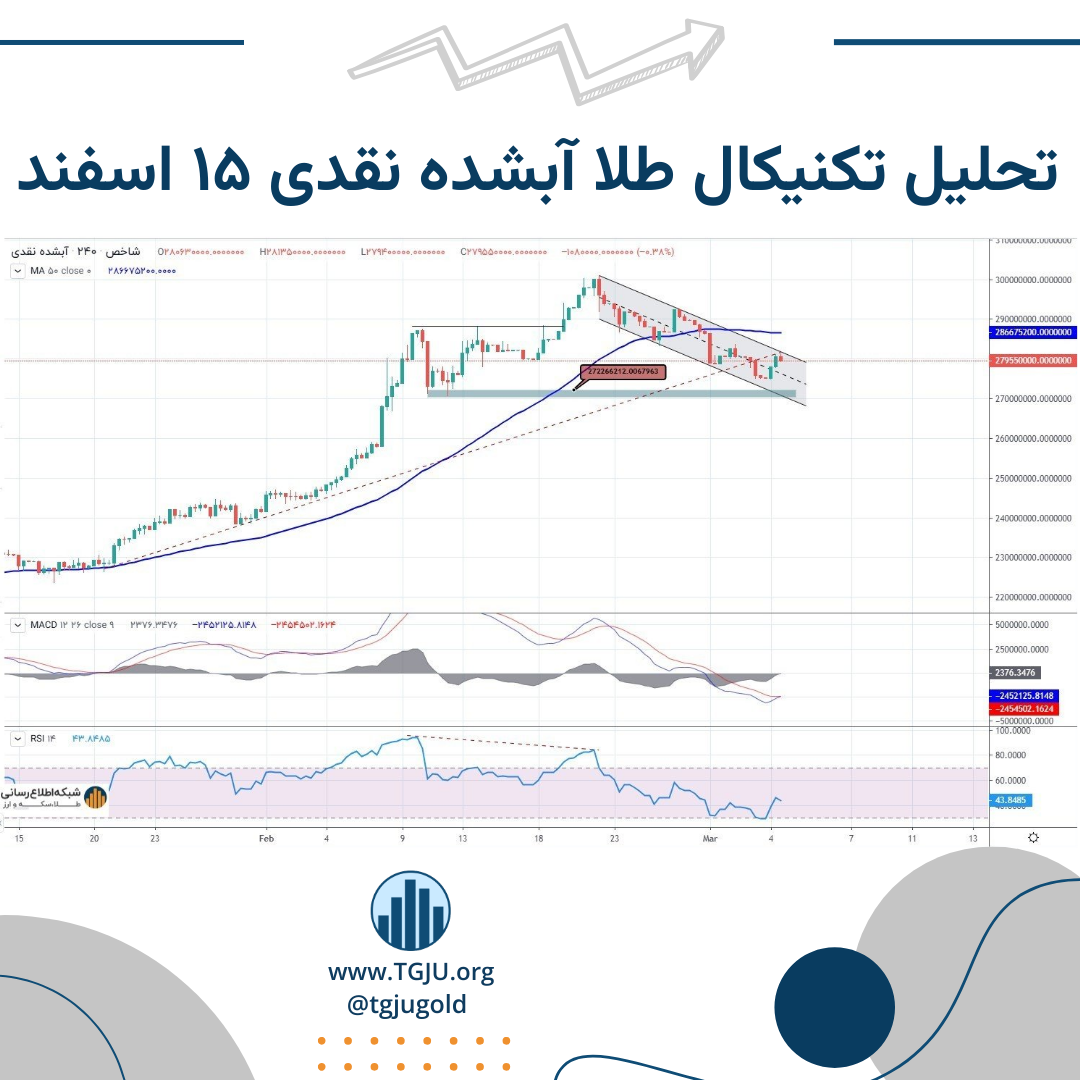
📉 قیمت آبشده نقدی پس از ثبت سقف ۳۰ میلیون تومان وارد اصلاح شده و در کانال نزولی نوسان دارد. شکست سقف کانال میتواند شروع موج صعودی باشد. حمایت ۲۷.۲ میلیون تومان نیز نقطه کلیدی برای برگشت است.
لینک خبر: https://zurl.co/qNxD0

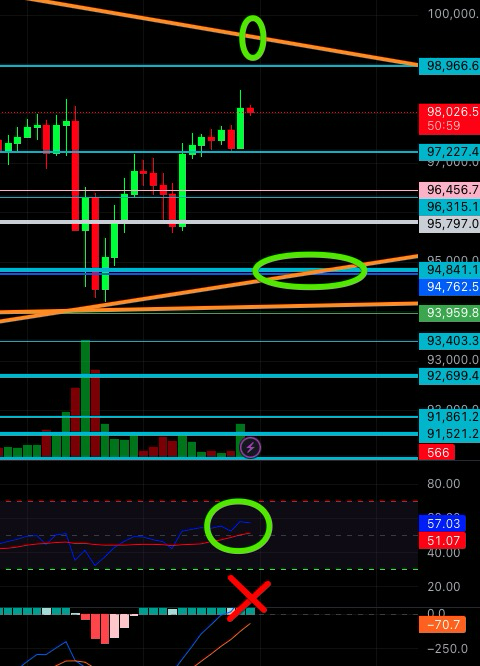
Yesterday, the lower boundary of the triangle wasn't breached. Today, we'll see if it breaks the upper boundary or attempts the lower one (green) again. The MACD configuration isn't very favorable for a bullish entry, although the RSI is normal. Personally, I'll wait for a breakout in either direction. #Bitcoin #TrianglePattern #MACD #RSI #MarketWatch
¿Es Adecuado Comprar #Bitcoin Ahora?.
Utiliza herramientas como gráficos de velas, medias móviles, y indicadores técnicos (RSI, #MACD, Bandas de Bollinger) para identificar patrones y tendencias.
https://www.colombiacripto.com/2024/11/es-buen-momento-para-comprar-bitcoin.html?m=1 #Colombia #ColombiaCripto #Cali

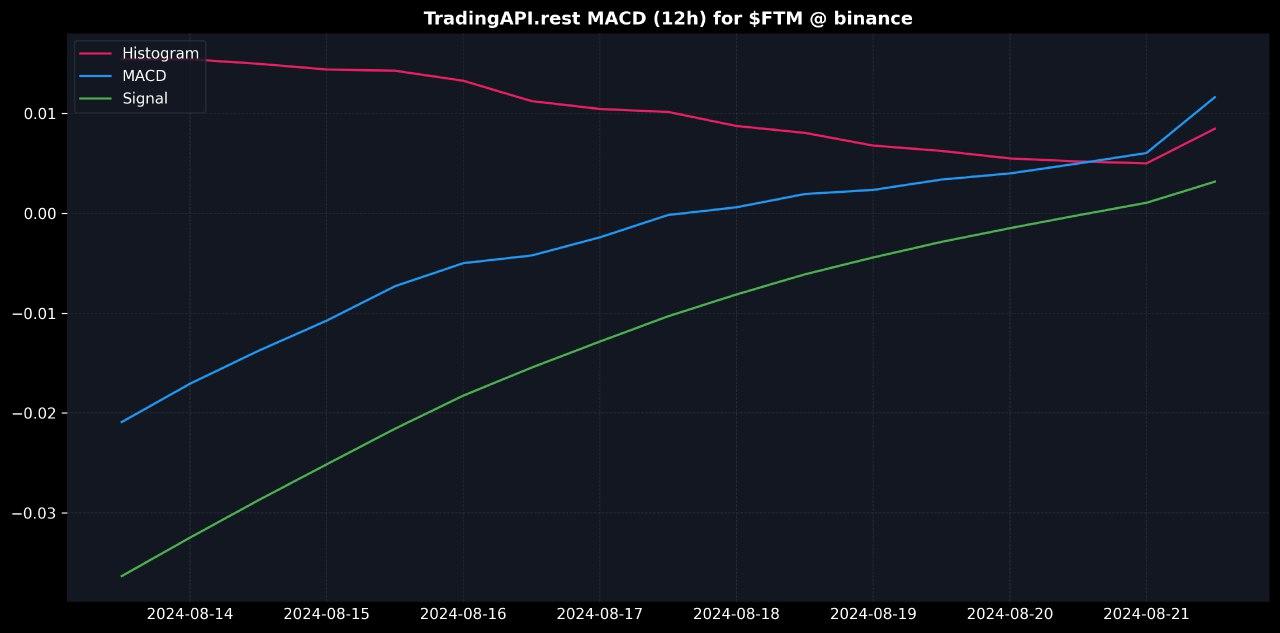
📈 #MACD (12h) for $FTM 📈
✳️ MACD: 0.01, Signal: 0.00, Histogram: 0.01. Bullish signal. Consider long positions. Histogram increasing indicates strengthening of current trend.
$FTM 🚀
$S will explode 💥
https://www.discovermagazine.com/technology/quantum-algorithm-solves-travelling-salesperson-problem-with-1-qubit
traveling salesman problem optimized with just 1 qubit and superpositioning on a bloch sphere - analogies drawn to grovers algo for searching db #shor #rsi #macd #quantum algorithms
Whether you're a seasoned trader looking to sharpen your technical analysis skills or an aspiring forex enthusiast taking your first steps, let us embark on this enthralling journey to unravel the difference between MACD and RSI, shedding light on their unique aspects and uncovering the potential they hold.
#macd #rsi #forexanalysis
https://www.geekyforex.com/difference-between-macd-and-rsi
Throughout this article, we will explore how to combine RSI readings with other indicators, including Moving Averages, Bollinger Bands, and Fibonacci retracements. Each of these indicators brings its own unique insights to the table, and when blended synergistically with RSI readings, can deliver a comprehensive analysis that helps traders navigate the complex Forex market.
#rsireading #movingaverages #macd
https://www.geekyforex.com/combine-rsi-readings-with-other-indicators
📈 MACD signals bullish momentum! 💹💪 Traders use MACD for entry/exit points in stocks & crypto. Calculate #MACD line by subtracting 26-day EMA from 12-day EMA. Consider Signal Line (9-day EMA of MACD) for smart trading decisions.
https://www.tronweekly.com/bitcoin-macd-indicator-signals-positive-market/
MACD là gì?
MACD (Moving Average Convergence Divergence) là một đường chỉ báo kỹ thuật trong chứng khoán do nhà phát minh Gerald Appel tạo ra vào năm 1979. Đây là một trong những chỉ báo kỹ thuật phổ biến và được sử dụng nhiều nhất trong phân tích đầu tư chứng khoán.
Đường chỉ báo MACD được xác định bằng độ chênh lệch giữa 2 trung bình trượt số mũ, thường là 2 trung bình trượt số mũ của hai chu kỳ là 12 ngày và 26 ngày.
#macd #hanghoa24
Xem chi tiết tại: https://hanghoa24.com/macd-la-gi
Le #MACD et le stochastique sont deux indicateurs de momentum très puissants. Nous vous montrons comment les utiliser 📊 #LDWS https://journalducoin.com/trading/macd-stochastique-indicateurs-momentum-puissants/
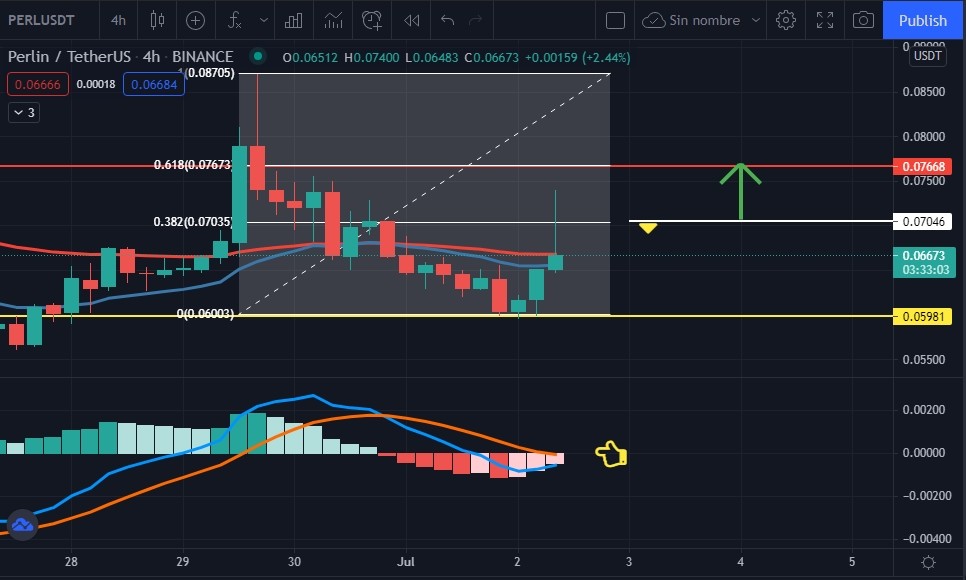
Señal alcista para el token #PERL en gráfico de cuatro horas para apalancar entre un rango de 3X a 10X solo para #Trader con experiencia en este tipo de operaciones. Estamos en reversión de la tendencia bajista de los 0,078 USDT. Colocar el Stop Loss según su criterio, como sugerencia por debajo del punto #Fibonacci 0,38. Destacar el posible cruce de las medias móviles del indicador #MACD.
⚠️Analice la información suministrada con sus conocimientos y experiencia en el #Trading antes de invertir.
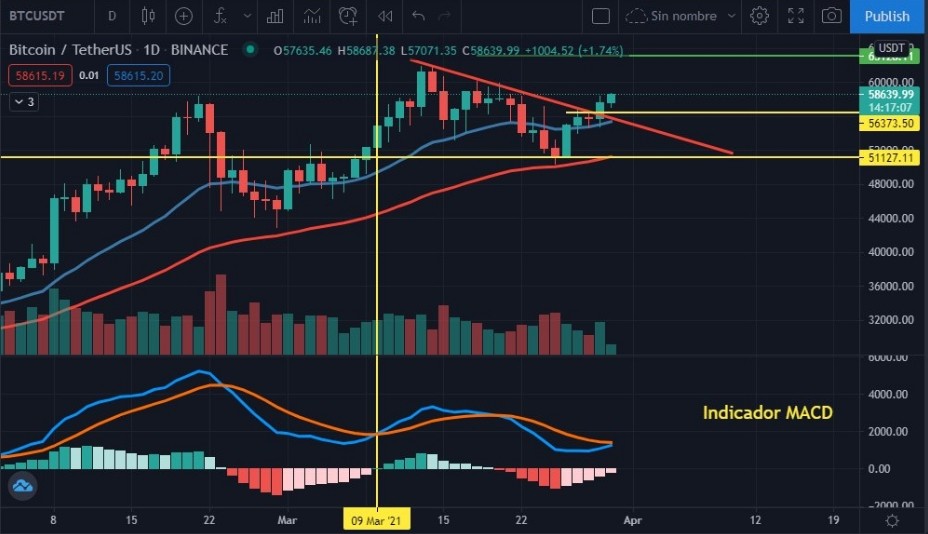
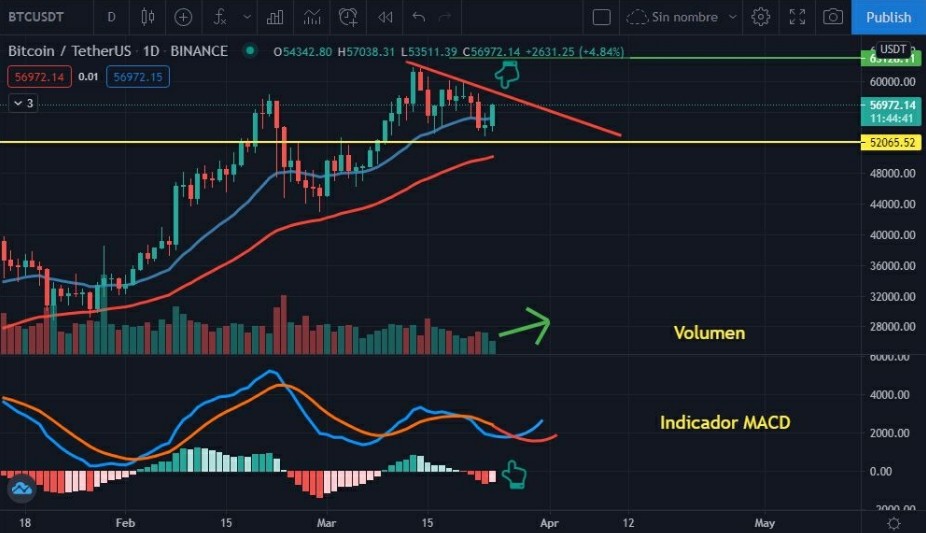
El #Bitcoin subiendo a los 59.000 USDT podría concretar el cruce de las medias móviles del indicador #MACD impulsando su precio aún más, como lo hizo el 9 de Marzo, la gran diferencia con ese momento es el bajo volumen que observó. Veremos si los toros de agua se despierta hoy en occidente.