
Excited to announce the release of version 0.0.2 of the `tskit_arg_visualizer` Python package on PyPI! This update brings functionality for handling larger ARGs, including major performance improvements (thanks to @yan) and a new Node View that shows local connections around a focal node, useful when your ARG is too large to display fully. Styling has also been overhauled, allowing for customizability in the colors and symbols used in your plots. Check it out at https://pypi.org/project/tskit-arg-visualizer/!
#tskit

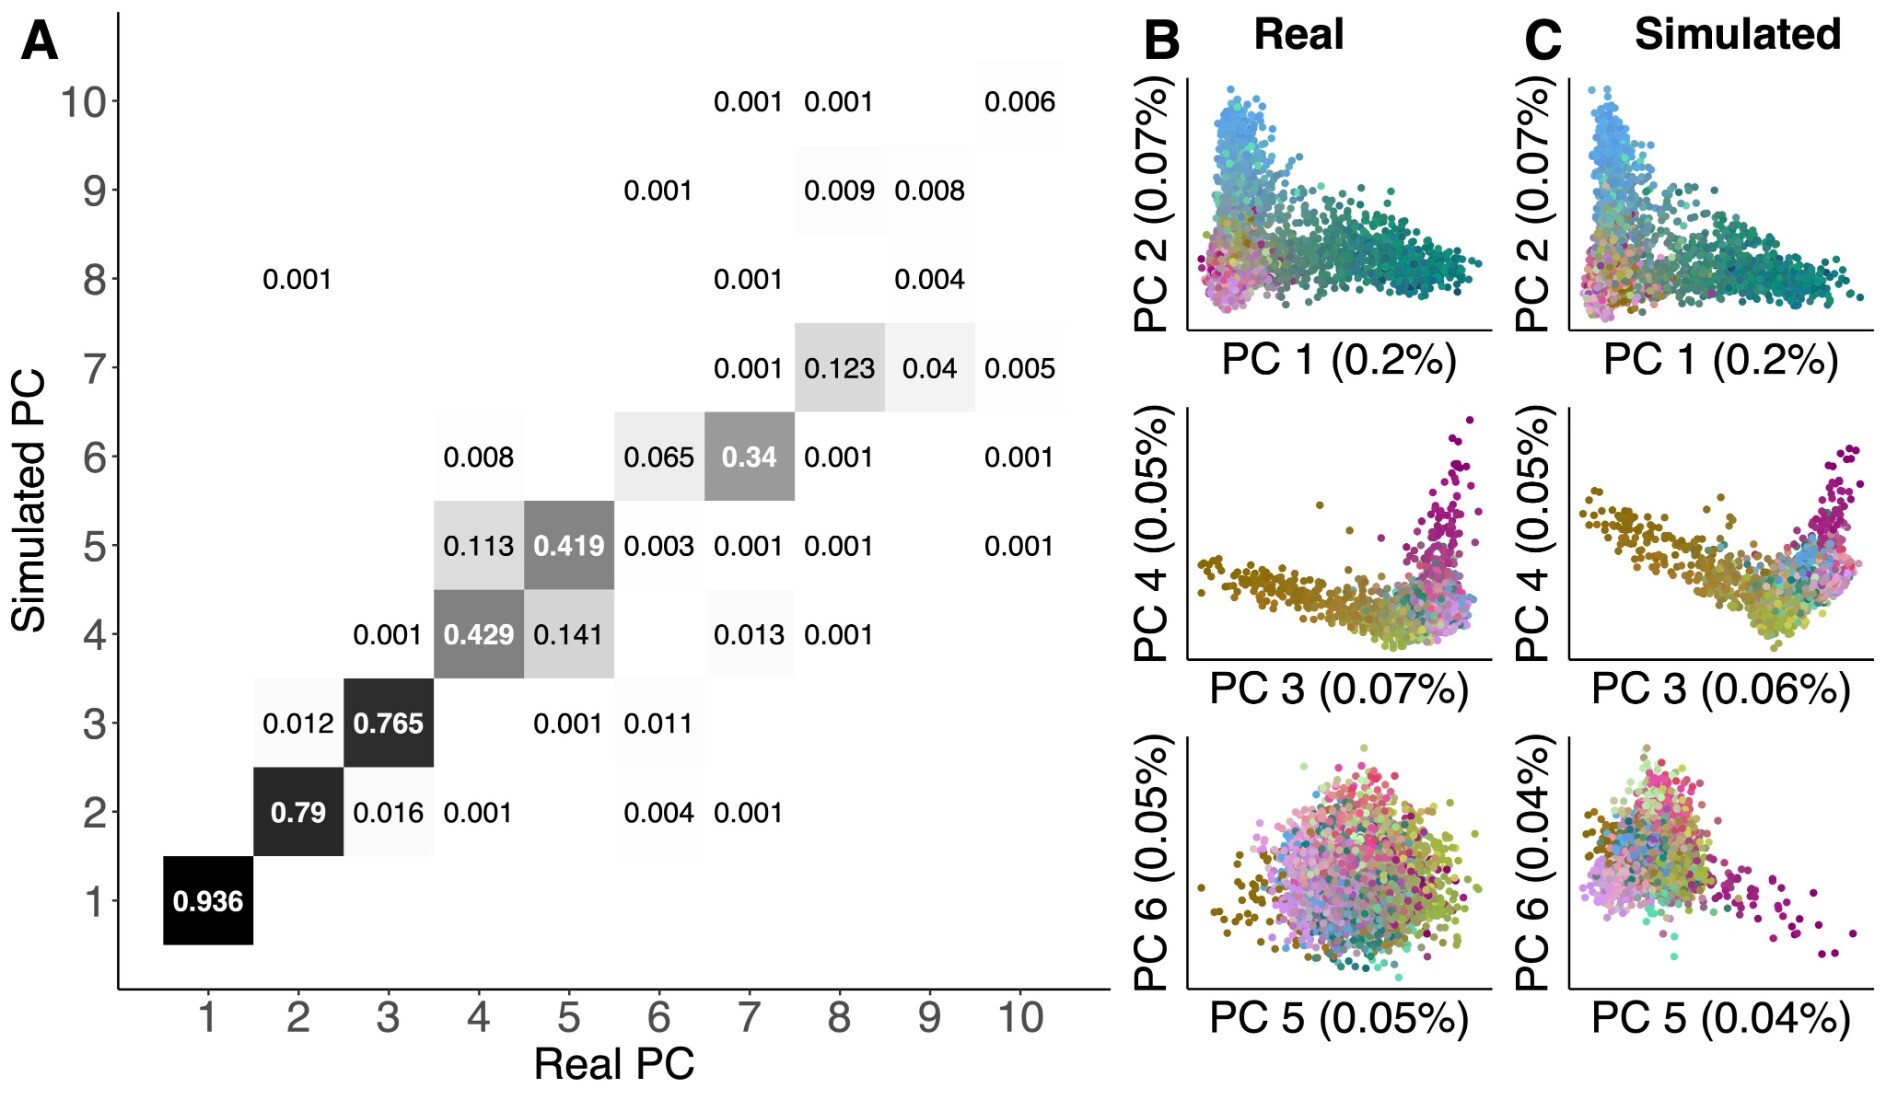
After solving the issue of non-independence mathematically, we developed an algorithm to quickly compute the quantities we need (using #tskit), allowing us to infer spatial histories from large ARGs.
3/n

@petrelharp I want a #tskit sticker 👋

Unfortunately, I've got to announce a bug in pyslim - if you've been using it, update and read on. #tskit
It's possibly a bad one: pyslim.recapitate( ) has been introducing a short bottleneck to size Ne=1 (!) in most cases.
EDIT: I accidentally pushed out the bugfix release without the fix to the bug.It is now fixed FOR REALS in 1.0.3, now on pip and soon on conda. :facepalm:
Heading off to #Evol2023! If you're looking for a postdoc, come talk to me! Or, if you want a #tskit sticker.

We can analyse these ARGs using the well-established and feature-rich #tskit library (and surrounding ecosystem). All of the analyses for the preprint were done using Jupyter notebooks, and most run in seconds on a standard laptop.
@kitchensjn does log time (as in #tskit) work as a nice intermediate between these two extremes (visibility vs info)?
It's been a little while since I last updated the #tskit ARG visualizer. Today, I added an optional scale bar to the left of the ARG that gives the timing of nodes. You can now also change the y-axis scaling from "rank" (default, equal spacing between nodes) to "time" (proportional to the true timing of the node). Scaling by time often leads to a jumbled mess, so it should probably only be useful with very simple ARGs in its current form. If you have ideas on how to improve that, let me know!
Ultra-realistic simulations of 1.4 million human genomes generated by using a detailed pedigree of French Canadians as input to #msprime! These simulations are hugely useful for large-scale genomics methods development, because they are freely available, easy to download (2.8G for chr1), and efficient to process using #tskit. I hope they will become a standard benchmark across all sorts of methods.
Added the ability to highlight trees within the #tskit ARG visualizer. If the optional parameter tree_highlighting is set to True (default), the visualizer now pairs the ARG with a "chromosome" along the bottom of the figure that is segmented according to the tree sequence breakpoints. You can highlight the individual trees by hovering over their respective segment of the chromosome.
Finished up with the different path types found in the #tskit ARG visualizer and added documentation about how I select an edge's path type. Here, the colors of the edges correspond with their path type (blue: stepAfter, red: stepBefore, green: step, black: mid). I also stylized the crossovers between edges with a small gap. The new path types do not solve crossover conflict (as seen on the left), but may help users better position the nodes.
Updated the ARG visualizer so that it no longer needs to write to a data file. Instead, it directly inserts the Python object as a string into a JavaScript template with the plotting code. This method requires that users install D3 within their notebooks, which is a short block of code but a drawback if the function were a part of a larger package. I don't yet know how to get around that. Added some #tskit styling to this one!
Here's the repo on GitHub for the ARG visualizer which plots a #tskit tree sequence using D3.js:
https://github.com/kitchensjn/tskit_arg_visualizer
You will need #jupyter, #msprime, and #numpy installed in Python to run the notebook. Let me know if you have any issues getting it running.
There are so many rules around node positions and paths between nodes. I'm slowly picking through a document of scenarios that break the current implementation. More updates to come!
@kitchensjn ooo, very nice! Can't wait to see it! #tskit
Client Info
Server: https://mastodon.social
Version: 2025.07
Repository: https://github.com/cyevgeniy/lmst