#zooms

3️⃣/ However, @carlipeters.bsky.social's #ZooMS work in 30°C Australian caves found 70,000-year-old collagen from extinct fauna. This challenges our models and suggests preservation mechanisms we don't fully understand. Environmental factors clearly matter more than temperature alone.

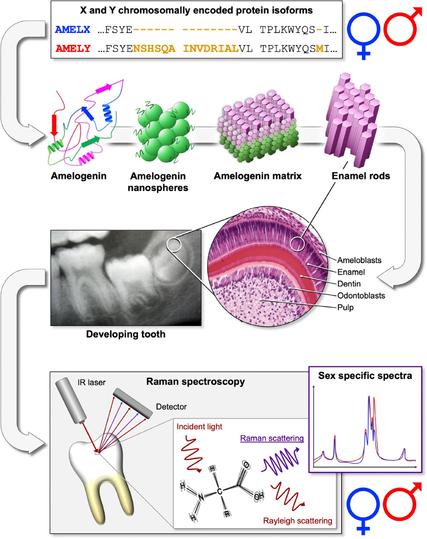
🧵 Thread: 1️⃣ Fascinating paper by Stewart et al. shows robust method for sex determination using peptides in tooth enamel. Great potential for #archaeology with fragmentary remains where DNA is degraded. #palaeoproteomics #ZooMS #teammasspec figshare.com/s/a861c0d74d...

Diagram illustrating sex determination using amelogenin proteins in tooth enamel. The top shows X and Y chromosomally encoded protein isoforms (AMELX in blue, AMELY in red) with their amino acid sequences highlighted. The middle section displays amelogenin's structural progression from protein to nanospheres to matrix to enamel rods, alongside images of developing tooth structure with labeled components (ameloblasts, enamel, dentin, odontoblasts, pulp). The bottom shows Raman spectroscopy setup with IR laser and detector analyzing a tooth, demonstrating how incident light produces both Rayleigh scattering and Raman scattering from molecular vibrations, resulting in sex-specific spectra shown in a graph (blue and red lines) with male and female symbols.
Biological sex determination is essential for analyzing human skeletal remains in archaeology, anthropology, and forensic science. This study investigates whether Raman spectroscopy of intact human dental enamel can be used as a non-destructive method for sex estimation. Orthogonal partial least squares discriminant analysis (OPLS-DA) and logistic regression identified sex-specific spectral characteristics in 88 human teeth from 47 modern individuals (26 females, 21 males). The OPLS-DA model showed excellent performance, with R2Y(cum) = 0.943 and Q2Y(cum) = 0.895. Raman shift wavenumbers at 373, 1182, and 1600 cm−1 were identified as the most reliable discriminators and included in a final logistic regression model. This model

2025 @nhsf.bsky.social 1st annual conference 10th July 2025 Call for Posters! Deadline 30th April 2025. Excellent opportunity for #palaeoproteomics, #ZooMS researchers. A diverse range of heritage science. Great for PhD students and ECRs. www.heritagescienceforum.org.uk/what-we-do/2...

Posters | National Heritage Sc...

3/4 The role involves: Managing thousands of parchment samples Operating liquid handling robots Performing #ZooMS analysis with MALDI-TOF MS Generating DNA libraries from ancient samples en.wikipedia.org/wiki/ZooMS

ZooMS - Wikipedia

🧵 Thread: 1️⃣ Excited to announce the next ICAZ Archaeozoology, Genetics, Proteomics & Morphometrics (AGPM) working group meeting in Copenhagen, Denmark, Oct 14-17, 2025! #palaeoproteomics #ZooMS #archaeology sites.google.com/palaeome.org...

ICAZ AGPM 2025

7/9 The curated CollagenDB database at the heart of the pipeline includes 614 species across multiple taxonomic groups, far broader than typical ZooMS approaches. A significant resource for the community. #ZooMS

🧵 Thread: 1/9 Important new paper! "Classification of Collagens via Peptide Ambiguation in a Paleoproteomic LC-MS/MS-Based Taxonomic Pipeline" by Ian Engels, @archaeoalex.bsky.social and team. Read it: pubs.acs.org/doi/10.1021/... #palaeoproteomics #ZooMS

Classification of Collagens vi...

4/5 🧠 Challenging peptide: COL1ɑ2 978-990 (peptide A) crucial for distinguishing reindeer from Bos/Bison. Study shows m/z 1192.6796 is critical for Bos/Bison ID, while m/z 1166.6276 indicates reindeer even when other markers absent. #ZooMS

Examples of peptide A (COL1ɑ2 978–990) m/z for two specimens analysed with HCl-MALDI-TOF MS. At the top, in blue, specimen PI-134 with peptide A shows 1150.6 and 1166.6 m/z peaks that are characteristic of reindeer. At the bottom, in orange, specimen PI-133 with peptide A shows 1192.7 and 1208.7 m/z peaks that are specific to Bos/Bison.

🧵 Thread: Comparing mass analyzers for ZooMS on poorly preserved collagen 1/5 Raymond et al. @palaeocdf.bsky.social @archaeoprotein.bsky.social test MALDI-TOF vs MALDI-FTICR for ZooMS analysis on Palaeolithic bone fragments (37-34 ka BP). Paper: doi.org/10.1002/rcm.... #ZooMS

Simplified workflow for the collagen extraction procedures and mass spectrometry techniques (MALDI-TOF and MALDI-FTICR) applied to a sample of indeterminate bone fragments from Le Piage, France. This figure illustrates the three collagen extraction protocols (AmBic, TFA and HCl) and the two mass spectrometry approaches (MALDI-TOF and MALDI-FTICR) used in the analysis. The lower left and right panels show Peptide Mass Fingerprinting (PMF) of peptide P1 (ɑ1 508, m/z 1105) for a single sample (PI-134-ICR) analysed with both mass spectrometers. The isotopic distributions are markedly different in these panels due to the separation by MALDI-FTICR of the two components of the first isotope. The spectrum shows a 13C and deamidated peptide peaks separated by 0.019 m/z.

🧵 Thread: 1️⃣ New paper by‪@jessiehendy.bsky.social‬ Blacka et al. presents breakthrough in rapid proteomic amelogenin sex estimation using Evosep-timsTOF MS. Slashes analysis time to under 20 mins per sample (including prep)! #palaeoproteomics #ZooMS doi.org/10.1002/rcm....

Rapid Proteomic Amelogenin Sex...

1️⃣ 🧵 Thread: GBE: "Phylogenetic Signal in Primate Tooth Enamel Proteins..." by Fong-Zazueta, @johannakrueger.bsky.social et al. Study on enamelome phylogenetic reliability. #palaeoproteomics #ZooMS doi.org/10.1093/gbe/...

Phylogenetic Signal in Primate...

🧬 "Bulk bone Shotgun Metagenomics" #BBSMG* reveals 8thC 🐟 trade across the Himalayas. Crushed bone fragments identified S Asian species (Rohu) at high-altitude Tibetan site interesting to compare #ZooMS vs #BBSMG doi.org/10.1016/j.ja... *aka Scrapheap Challenge www.nature.com/articles/sre...

A three-panel figure illustrating the location and methodology of the Kongsangqiao study:
(A) A topographic map of the Himalayas and Tibetan Plateau, showing elevation zones in grayscale from 174-5000+ meters. The Kongsangqiao site (orange triangle) is positioned between Kathmandu and Lhasa, with the Ganges and Brahmaputra rivers marked in blue. Seven other archaeological sites with fish remains are marked with yellow triangles across the plateau. An inset map shows the region's location in Asia.
(B) A stratigraphic profile showing three distinct layers: an orange phosphate deposits layer on top, a grey cultural layer containing bones and charcoal in the middle, and a yellow weathered deposits layer with pottery fragments at the bottom.
(C) A detailed laboratory workflow diagram showing five key steps:

Collection of bulk bone fragments from excavation
Grinding of fragments into bone powder
DNA extraction using solution in test tubes
Creation of multiple DNA libraries
Final DNA sequencing on modern sequencing equipment

Each step is illustrated with photographs or diagrams, connected by arrows showing the process flow from raw archaeological material to final genetic analysis.

🦆 2/5 The team found unexpected protein variations within the SAME species - like 15 different versions in mallard ducks alone! Paleoproteomics often tries to ID ancient species by matching protein sequences...🤔 Plus, variations in ALL 13 proteins they studied. Can see why #ZooMS uses collagen!

A panel of 13 violin plots comparing interspecies (green) and intraspecies (blue) sequence variation across different proteins found in waterfowl. Each plot shows the distribution of pairwise distances between sequences, with median values shown as black lines and means as black diamonds. Proteins include collagens (COL1a1, COL1a2), eggshell proteins (XCA1, XCA2, OC116), and various other proteins like Albumin, Clusterin, and Ovotransferrin. The plots reveal that some proteins like XCA1, OC116, and Clusterin show higher variability both within and between species, while others like the collagens show minimal variation. For most proteins, interspecies variation (green) is generally higher than intraspecies variation (blue), though there is often considerable overlap.

The HPB-MALDI team dropped an open database of 11,055 mass spec signatures from pathogenic bacteria. #ZooMS folks - could this be a useful roadmap for making our data truly open & accessible? Everything on #Zenodo - a useful template for a #ZooMS DB 💽. www.nature.com/articles/s41...

Pie charts illustrating database content by strains and species of selected genera containing highly pathogenic bacterial species: Bacillus, Brucella, Burkholderia, Francisella, and Yersinia. The size (area) of each pie chart is proportional to the number of strains of the given genus represented in the data base. Furthermore, each pie chart contains segments that provide further information. The size and color intensity of the individual segments are proportional, or inversely proportional, respectively, to the number of spectra recorded from the given species. The chart segments further contain information regarding the number of strains per species (numbers in the inner circles) and the number of spectra per species (outer circle). Names of highly pathogenic (BSL-3) microbial species or subspecies are plotted in pink framed text boxes. Bacillus cereus group sp.*: Members of the B. cereus group for which no species assignment is available.

2/5 Key techniques: #ZooMS: Fast species ID using collagen fingerprints SPIN: Enhanced taxonomic resolution via proteome analysis Dental enamel proteomics 🦷: Sex determination from AMELX/Y proteins (see the new paper by @palaeoprotpalesa.bsky.social!) Full proteome: Some phylogenetic insight

🏺 @suziebirch.bsky.social demonstrates that combining #ZooMS (88%) + morphology (76%) reveals hidden insights into ancient sheep/goat differences at Tepe Yahya, Iran Contradicts previous studies: 🐑 more often misidentified than 🐐 www.sciencedirect.com/science/arti... #teammassspec

Table showing species identification data across seven archaeological periods (VII to IVA) at Tepe Yahya. Data includes: total mandibles per period (ranging from 24-109), ZooMS success rates (57-100%), misidentification rates (6-33%), and sheep-to-goat ratios. Notable findings: Period V shows highest goat dominance (7.5 goats per sheep); later periods IVA-IVC show more balanced ratios (2.3-3.1 goats per sheep). Collagen preservation issues only affected earliest periods (VII, VI, V). Total sample: 405 mandibles, with goats consistently outnumbering sheep across all periods.

Help wanted. I have purchased a wallaby hide to make it into standards for #ZooMS. The selection of wallaby was to target a species that is not widely studied. It is veg-tanned leather, species unknown. What forms of standards should we prepare - gelatin, collagen shavings, leather, parchment?

Images of a wallaby skin, hair and flesh side with a 2 euro coin for scale, and an image of the skin being examined by a conservator looking at the skin on a table

3 year PostDoc Tuebingen (+Sam Brown) #ZooMS in Southern Africa Project. Deadline March 15th 2025

Three-year position for a rese...
Client Info

Server: https://mastodon.social
Version: 2025.04
Repository: https://github.com/cyevgeniy/lmst