Aditya Dahiya

Data Viz enthusiast. Study Health financing. Harvard, Fulbright and AIIMS alumnus. IAS.

Views are mine!

Aditya Dahiyaadityadahiya
2025-05-11

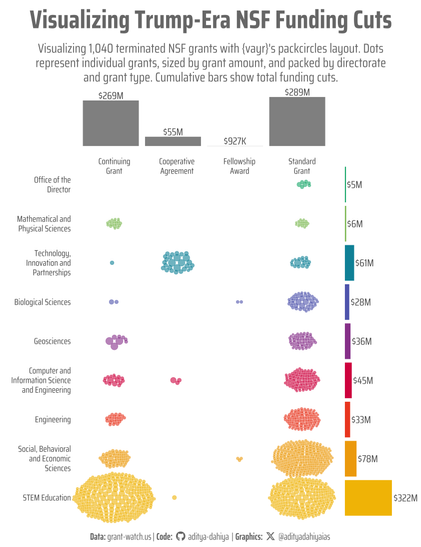
Visualizing terminated NSF grants with {vayr} and {packcircles} algorithmic layout! 📊STEM Education hit hardest.
Code đź”— tinyurl.com/tidy-nsf-grants
Data: grant-watch.us (@GrantWatch)
Tools by Alex Coppock at alexandercoppock.com/vayr/inde

This graphic visualizes approximately 1,040 terminated NSF grants under the Trump administration in 2025, using a packcircles layout. The Y-axis lists nine NSF directorates, while the X-axis categorizes grants into four types: continuous, standard, fellowship, and cooperative. Each dot represents a single grant, arranged via position_circlepack() from the {vayr} package. Cumulative bar plots along the axes display the total funding committed via USAspending.gov for each directorate and grant type. Key findings reveal that STEM Education faced the largest funding cuts, predominantly in continuing grants, while Technology and Innovation saw the most cooperative agreement terminations.
Aditya Dahiyaadityadahiya
2025-05-11

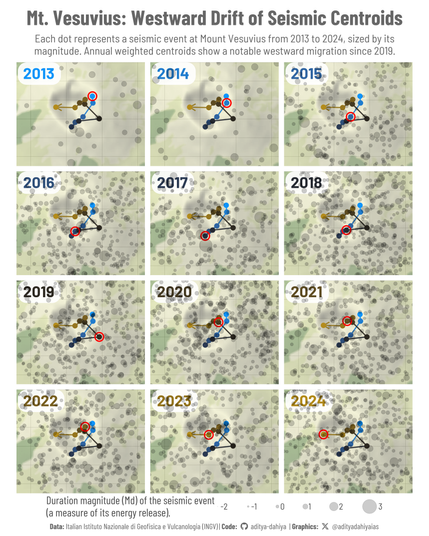
🗺️ Earthquakes at Mt. Vesuvius (2013–2024): Since 2019, they're shifting westward (annual weighted centroids).
Data: @INGV_press @libbyheeren.bsky.social
Full Code đź”— tinyurl.com/tidy-mt-vesuvius
Made with {ggplot2} {ggmap} {terra}

This graphic shows the geographic distribution of seismic events at Mount Vesuvius from 2013 to 2024, with each earthquake represented as a grey dot sized by its duration magnitude (Md). For each year, the red circle marks the weighted centroid of all events, calculated using Md as the weighting factor. Over the 12-year period, the centroids trace a clear westward shift beginning in 2019, suggesting a possible geographic migration of seismic activity within the region. This trend may warrant further investigation into evolving subsurface dynamics at the volcano.
Aditya Dahiyaadityadahiya
2025-05-05

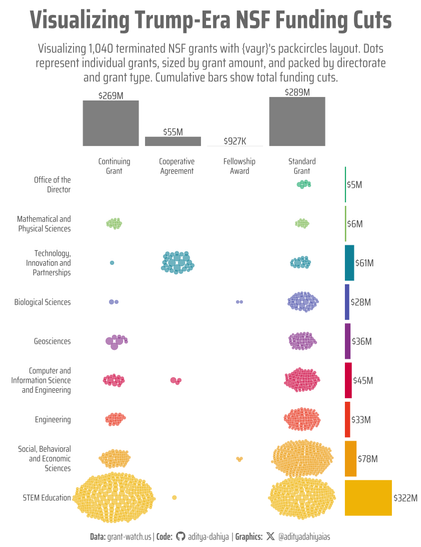
Visualizing terminated NSF grants with {vayr} and {packcircles} algorithmic layout! 📊STEM Education hit hardest.
Code đź”— tinyurl.com/tidy-nsf-grants
Data: grant-watch.us
Tools by @aecoppock.bsky.social at alexandercoppock.com/vayr/inde

This graphic visualizes approximately 1,040 terminated NSF grants under the Trump administration in 2025, using a packcircles layout. The Y-axis lists nine NSF directorates, while the X-axis categorizes grants into four types: continuous, standard, fellowship, and cooperative. Each dot represents a single grant, arranged via position_circlepack() from the {vayr} package. Cumulative bar plots along the axes display the total funding committed via USAspending.gov for each directorate and grant type. Key findings reveal that STEM Education faced the largest funding cuts, predominantly in continuing grants, while Technology and Innovation saw the most cooperative agreement terminations.
Aditya Dahiyaadityadahiya
2025-03-06

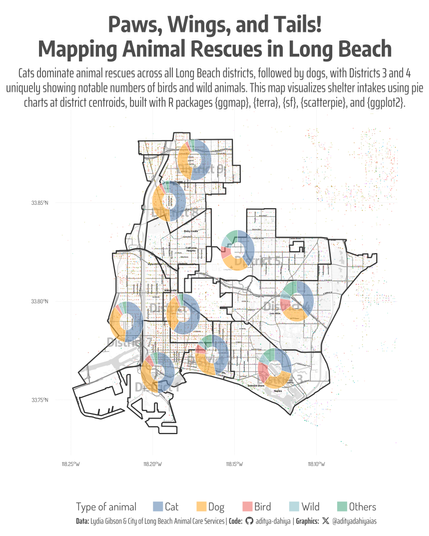
Mapping Long Beach animal rescues with pie charts at district centroids with base raster maps of {ggmap}, {terra}, {sf}, {scatterpie} & {tidyterra} by @dhernangomez
Data: City of Long Beach
Code đź”—tinyurl.com/tidy-longbeach

This graphic maps animal rescues across Long Beach districts, with pie charts at district centroids showing the prevalence of cats, dogs, birds, wild animals, and others, revealing cats as the most rescued in all areas and Districts 3 and 4 with notable bird and wild rescues. Created using R with {ggmap} (base map from Stadia Maps), {terra} (raster handling), {sf} (spatial data), {scatterpie} (pie charts), and {ggplot2} (plotting).
Aditya Dahiyaadityadahiya
2025-03-01

@steffilazerte Thanks. Surely, I will add them.

Aditya Dahiyaadityadahiya
2025-02-20

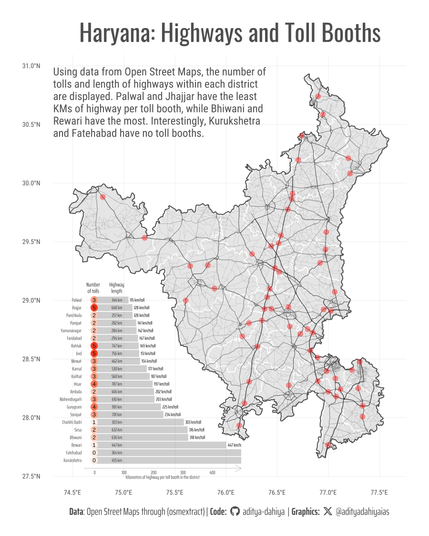
How to use geo-computation with , {sf} & {osmextract} to compute highway lengths and toll booths within geographic subdivisions. Then, plotting a composite plot with {patchwork}.
Data: @openstreetmap
Full Code đź”—tinyurl.com/hy-toll-hwy
Inspiration: by @robinlovelace & @nowosad

A map of the state of Haryana (India), with the highways overlaid on top (transparency and line-width scaled to the highway type). The borders of district are in white colour. The toll booths are marked as red dots, and the number of toll booths and highway length per district are computed, and displayed in the inset horizontal bar-chart. The kilometres of highway per toll booth for each district are computed and displayed as length of the bars in the inset chart (in ascending order).
Aditya Dahiyaadityadahiya
2025-02-19

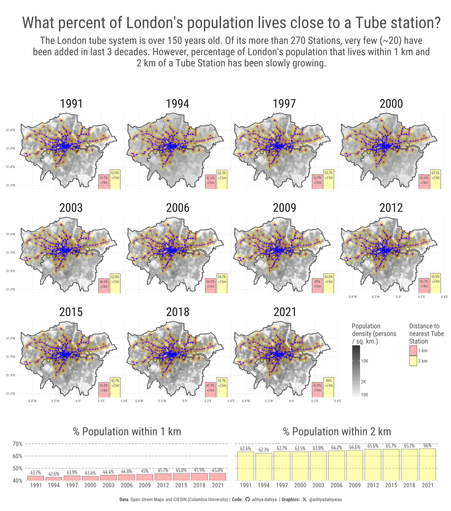
London’s Tube & Urban Density! 🇬🇧
🔹More Londoners now live near Tube stations—even with only few new stations in 30 years!
🔹Densification, not expansion, is driving increased access.
🔹 Unlike others, London’s Tube (150+ years old) shaped the city, not the other way around

This graphic illustrates the spatial relationship between London’s population and its Tube network. The blue lines represent different London Underground routes, while blue dots mark station locations. The shaded areas show 1 km (red) and 2 km (yellow) buffer zones around stations, indicating regions with easy access to public transport. Unlike newer metro systems, London’s Tube is over 150 years old, with only about 20 new stations added in the last three decades. Despite this, the percentage of Londoners living within 1 km and 2 km of a Tube station has been gradually increasing, reflecting urban densification around existing infrastructure.
Aditya Dahiyaadityadahiya
2025-02-19

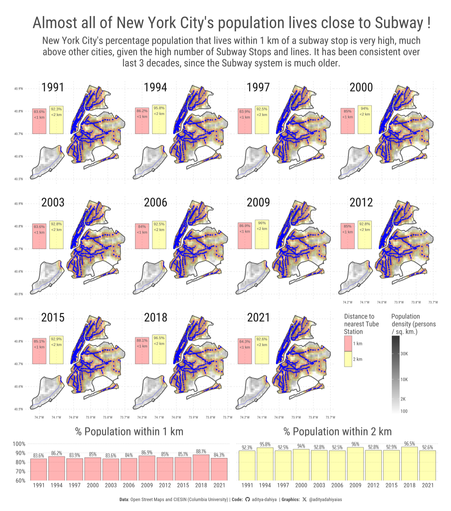
🚇 NYC’s Subway = Unmatched Coverage!
🔹85% of NYC’s population lives within 1 km of a subway stop.
🔹95% lives within 2 km!
Data: CIESIN @openstreetmap
Full codeđź”— tinyurl.com/nyc-pop-sbwy
Inspiration by @robinlovelace & @nowosad using

This graphic visualizes New York City’s extensive subway network and its relationship with population distribution. The dark blue lines represent subway routes, while the dark blue dots mark station locations. The shaded areas indicate regions within 1 km (red) and 2 km (yellow) of subway stops. The analysis reveals that around 85% of the city’s population lives within 1 km of a subway station, and nearly 95% within 2 km—a significantly higher proportion than most cities. This consistency over the past three decades highlights that New York’s subway was built early to lead to rise of dense neighborhoods, and is no longer driving new population movement, as it is already much higher concentration than other cities.
Aditya Dahiyaadityadahiya
2025-02-19

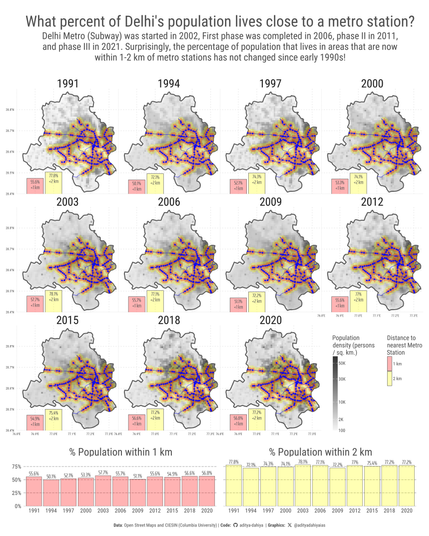
Did the Delhi Metro🚇lead to a rise in population density around stations? It connects already densely populated areas rather than driving new growth. 📊
Data: CIESIN @openstreetmap
Full Code: tinyurl.com/del-pop-metro
with ;

The graphic illustrates the proportion of Delhi’s population residing within 1 km and 2 km of a metro station across multiple years. Each facet represents a different year, showing how population distribution relative to metro accessibility has evolved over time. The bar heights indicate the percentage of the total population within the respective buffer zones, while the background map provides spatial context for metro stations, lines, and population density. An inset chart further summarizes the temporal trends for both buffer zones.
Aditya Dahiyaadityadahiya
2025-02-19

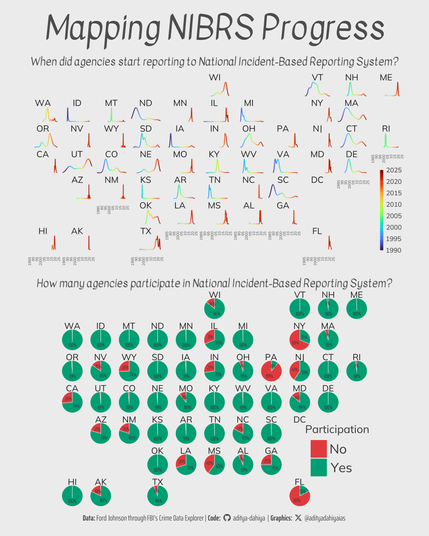
NIBRS adoption across the U.S.'s states. A creative hack to apply continuous color scales🎨 in geom_density(), and geographically arranged layouts using {geofacet}.

Full Codeđź”—tinyurl.com/tidy-fbi-nibrs
Tools: , ,

This graphic explores the adoption of the FBI’s National Incident-Based Reporting System (NIBRS) across the United States, combining geographic and temporal insights. The faceted map, arranged by state, highlights the percentage of law enforcement agencies participating in NIBRS, revealing regional trends in adoption. Paired with density plots, it also visualizes the yearly enrollment of agencies into NIBRS, showcasing when states saw the most significant shifts toward modernized crime reporting, offering a deeper understanding of its geographic spread and historical progression across the U.S. law enforcement landscape.
Aditya Dahiyaadityadahiya
2025-02-18

@nowosad Thank you for noticing. Much appreciated.

Aditya Dahiyaadityadahiya
2025-02-16

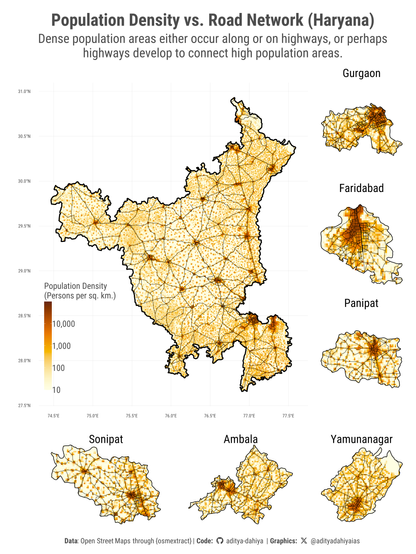
data and code for plotting Correlation between highways and densely-populated areas, globally. Example of Haryana (India).
Data: @openstreetmap @nasa

Full Codeđź”—tinyurl.com/hy-pop-roads

Tools: , , , by @rOpenSci

A raster map of population density for the state of Haryana (India), overlaid with the road network (displaying only highways) extracted from Open Street Maps using {osmextract}. The 7 side-maps show the focus on 7 different districts of Haryana., which show some element of transit-oriented development - i.e., high population density areas along the highways.
Aditya Dahiyaadityadahiya
2025-02-16

code to plot correlation between changes in population density (in last 3 decades) and road network, e.g. ()
Data: @openstreetmap @nasa

Full Codeđź”—tinyurl.com/delhi-pop-roads

Tools: by @rOpenSci

This graphic shows the population density of Delhi (India) compared from 1990 to 2020, on a transformed fill scale where darker colours represent more densely populated areas. Overlain on top are the major arterial roads of Delhi, taken from Open Street Maps data. An evident pattern is urban densification along major arterial roads, particularly towards north-west of Central Delhi, and especially along its Ring-Road.
Aditya Dahiyaadityadahiya
2025-02-16

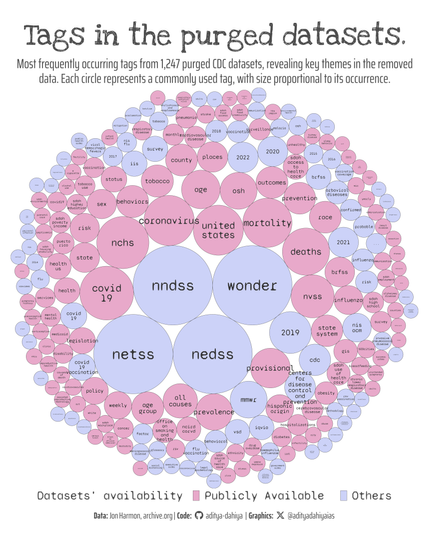
What themes were most common in the purged CDC datasets? A packed circles' visualization.
Data: @jonthegeek @internetarchive @waybackmachine

Code đź”— tinyurl.com/tidy-cdc

Tools: , , by @davidgohel

A packcircles visualization of the most frequent tags from 1,247 purged CDC datasets, sized by occurrence and colored by public access status. Created using R with {ggplot2} for plotting and {packcircles} for circle packing.
Aditya Dahiyaadityadahiya
2025-02-13

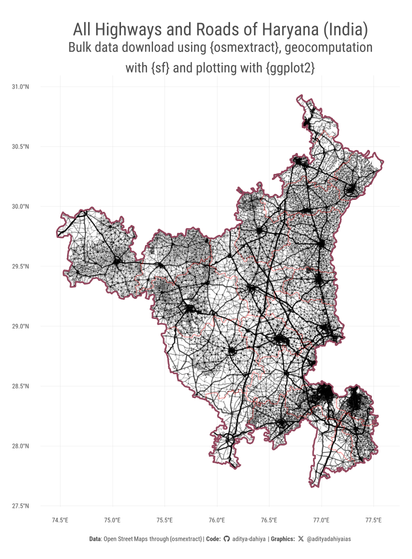
A basic use for {osmextract} - quickly and easily plotting complete road network of any place in the world - example from Haryana (India).
Data: @openstreetmap
Full Code đź”— tinyurl.com/osmextract-hy-roads
Tools: , by @rOpenSci,

A map of Haryana (borders in red), with administrative boundaries of districts (in translucent red) overlaid with all the major roads - larger roads and highways are wider and more opaque, lesser width roads are thinner and more translucent.
Aditya Dahiyaadityadahiya
2025-02-06

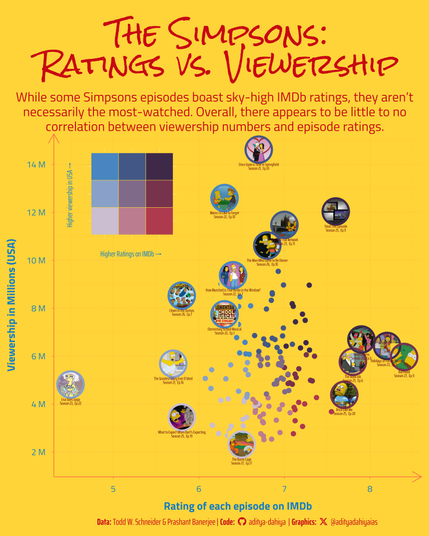
The ' episodes: Viewership vs. ratings as a scatter-plot with bivariate colour scale.
Data: @kaggle Todd Schneider
Code đź”— tinyurl.com/tidy-simpsons
Tools {biscale}

This graphic visualizes the relationship between IMDb ratings (X-axis) and U.S. viewership in millions (Y-axis) for 151 episodes of The Simpsons. Each episode is represented by its official image, placed according to its rating and viewership, with a bivariate color-coded circumference created using the {biscale} package. The colors reflect a 3Ă—3 tertile classification, blending blue, red, and violet to indicate different combinations of high, medium, and low ratings and viewership. Data was processed and visualized in R using {ggplot2}, {biscale}, and {ggimage} for image integration.
Aditya Dahiyaadityadahiya
2025-02-06

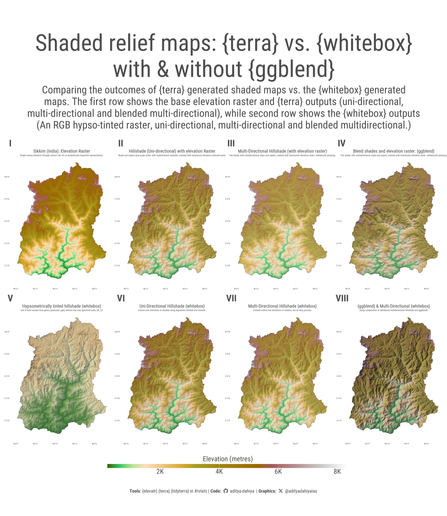
Comparing hill-shade maps in R using {terra} vs. {whitebox} - along with impressive effects of {ggblend}. Example code for Sikkim in .
Data: by US EPA
Full Codeđź”—tinyurl.com/maps-shaded
Tools: , , by @mjskay , by Qiusheng Wu

Comparing the outcomes of {terra} generated shaded maps vs. the {whitebox} generated maps. The first row shows the base elevation raster and {terra} outputs (uni-directional, multi-directional and blended multi-directional), while second row shows the {whitebox} outputs (An RGB hypso-tinted raster, uni-directional, multi-directional and blended multidirectional.
Aditya Dahiyaadityadahiya
2025-02-04

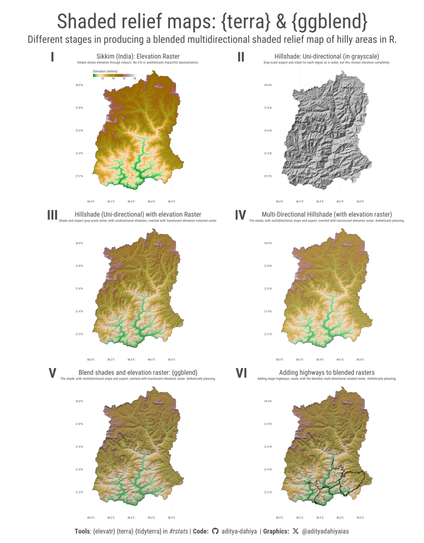
Code techniques to produce blended, shaded-relief maps with {terra}, {ggblend} and {tidyterra} in for state of Sikkim, India.
Data: {elevatr} by US EPA.
Full Codeđź”—tinyurl.com/terra-ggblend
Tools by @mjskay

A composite plot of the (I) the elevation raster of the height above sea level for the state of Sikkim (India). (II) A grey-scale hillshade graph showing the spect and slope, irrespective of the elevation. (III) The same map, but in a uni-directional shadow, now merged with translucent elevation raster. (IV) With a multi-drectional shade. (V) With a blended (using ggblend) colours from the grayscale shaded relief and coloured elevation raster. And, (VI) the blended raster with overlaid highways and roads.
Aditya Dahiyaadityadahiya
2025-02-03

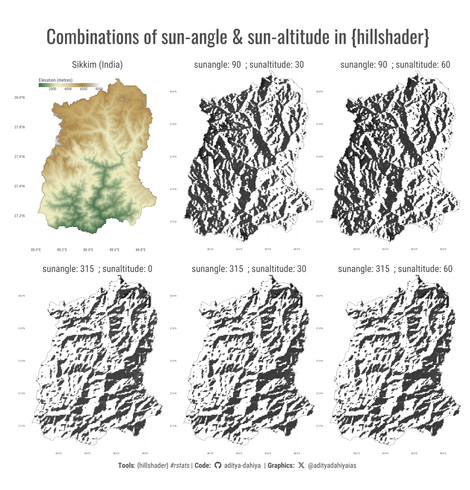
Code experimenting with package {hillshader} by @pierreroudier - a wrapper around - quick code to plot hilly regions in
Full Codeđź”—tinyurl.com/hill-sikkim
Tools: by @dhernangomez by USEPA

This visualization showcases the impact of varying sun angles and altitudes on hillshade maps of Sikkim, India, using the {hillshader} package. The top-left map represents the original elevation data, while the remaining five maps illustrate different shading effects based on changes in sunangle (direction of sunlight) and sunaltitude (height of the sun above the horizon). By adjusting these parameters, the perception of terrain depth and structure changes, highlighting how light sources influence the visualization of topography.
Aditya Dahiyaadityadahiya
2025-02-01

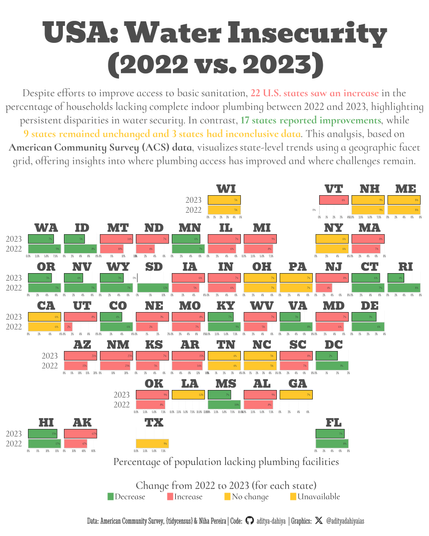
Displaying geographic patterns in facet graphs with {geofacet} - change in water insecurity in USA's states (2022 vs 2023).
Data: {tidycensus} @nnpereira.bsky.social
Full Codeđź”— tinyurl.com/tidy-plumbing
Tools by Ryan Hafen

This graphic presents a faceted comparison of indoor plumbing access across all 50 U.S. states, arranged in a grid that mirrors their geographic locations. Each facet contains two horizontal bar charts, where the x-axis represents the percentage of households lacking plumbing, and the y-axis differentiates between 2022 (lower bar) and 2023 (upper bar). This layout allows for a clear state-by-state comparison of changes in plumbing access over time, illustrating where conditions have improved, worsened, or remained unchanged.

Client Info

Server: https://mastodon.social
Version: 2025.04
Repository: https://github.com/cyevgeniy/lmst