A visualisation of the wine regions of New Zealand three ways.
#rayshader adventures, an #rstats tale
A visualisation of the wine regions of New Zealand three ways.
#rayshader adventures, an #rstats tale
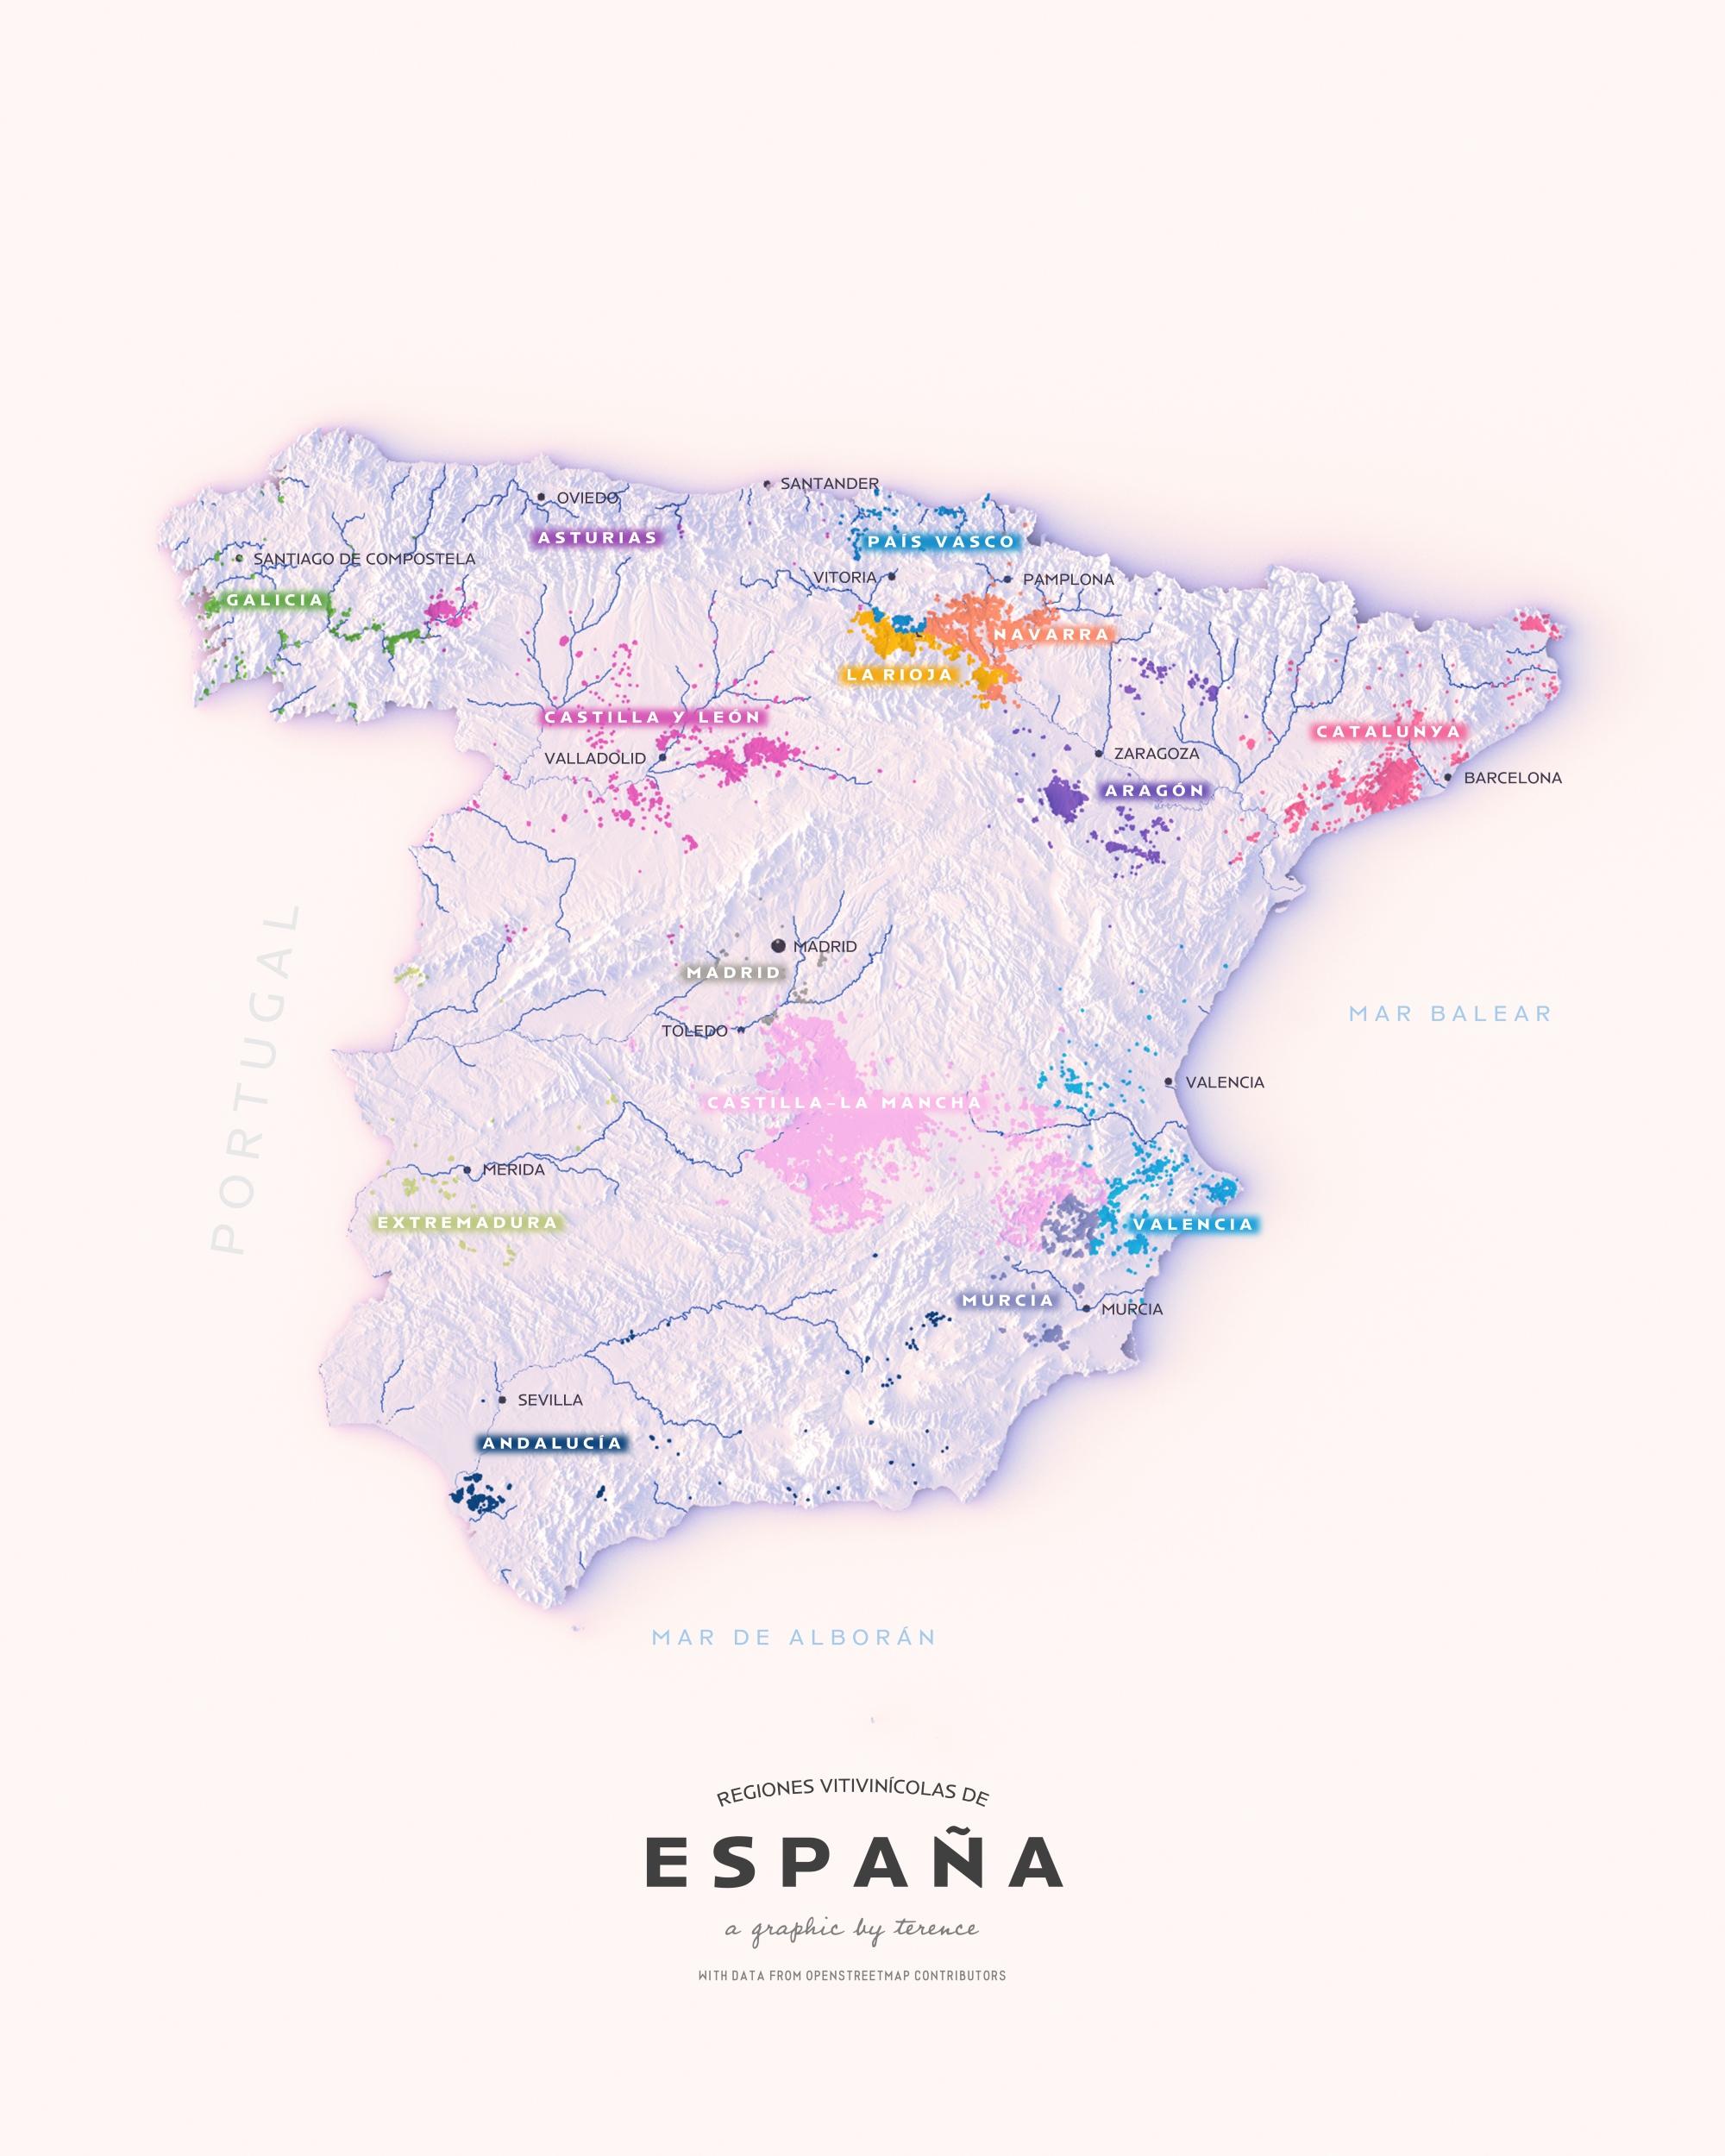
A visualisation of the wine regions of Spain.
#rayshader adventures, an #rstats tale
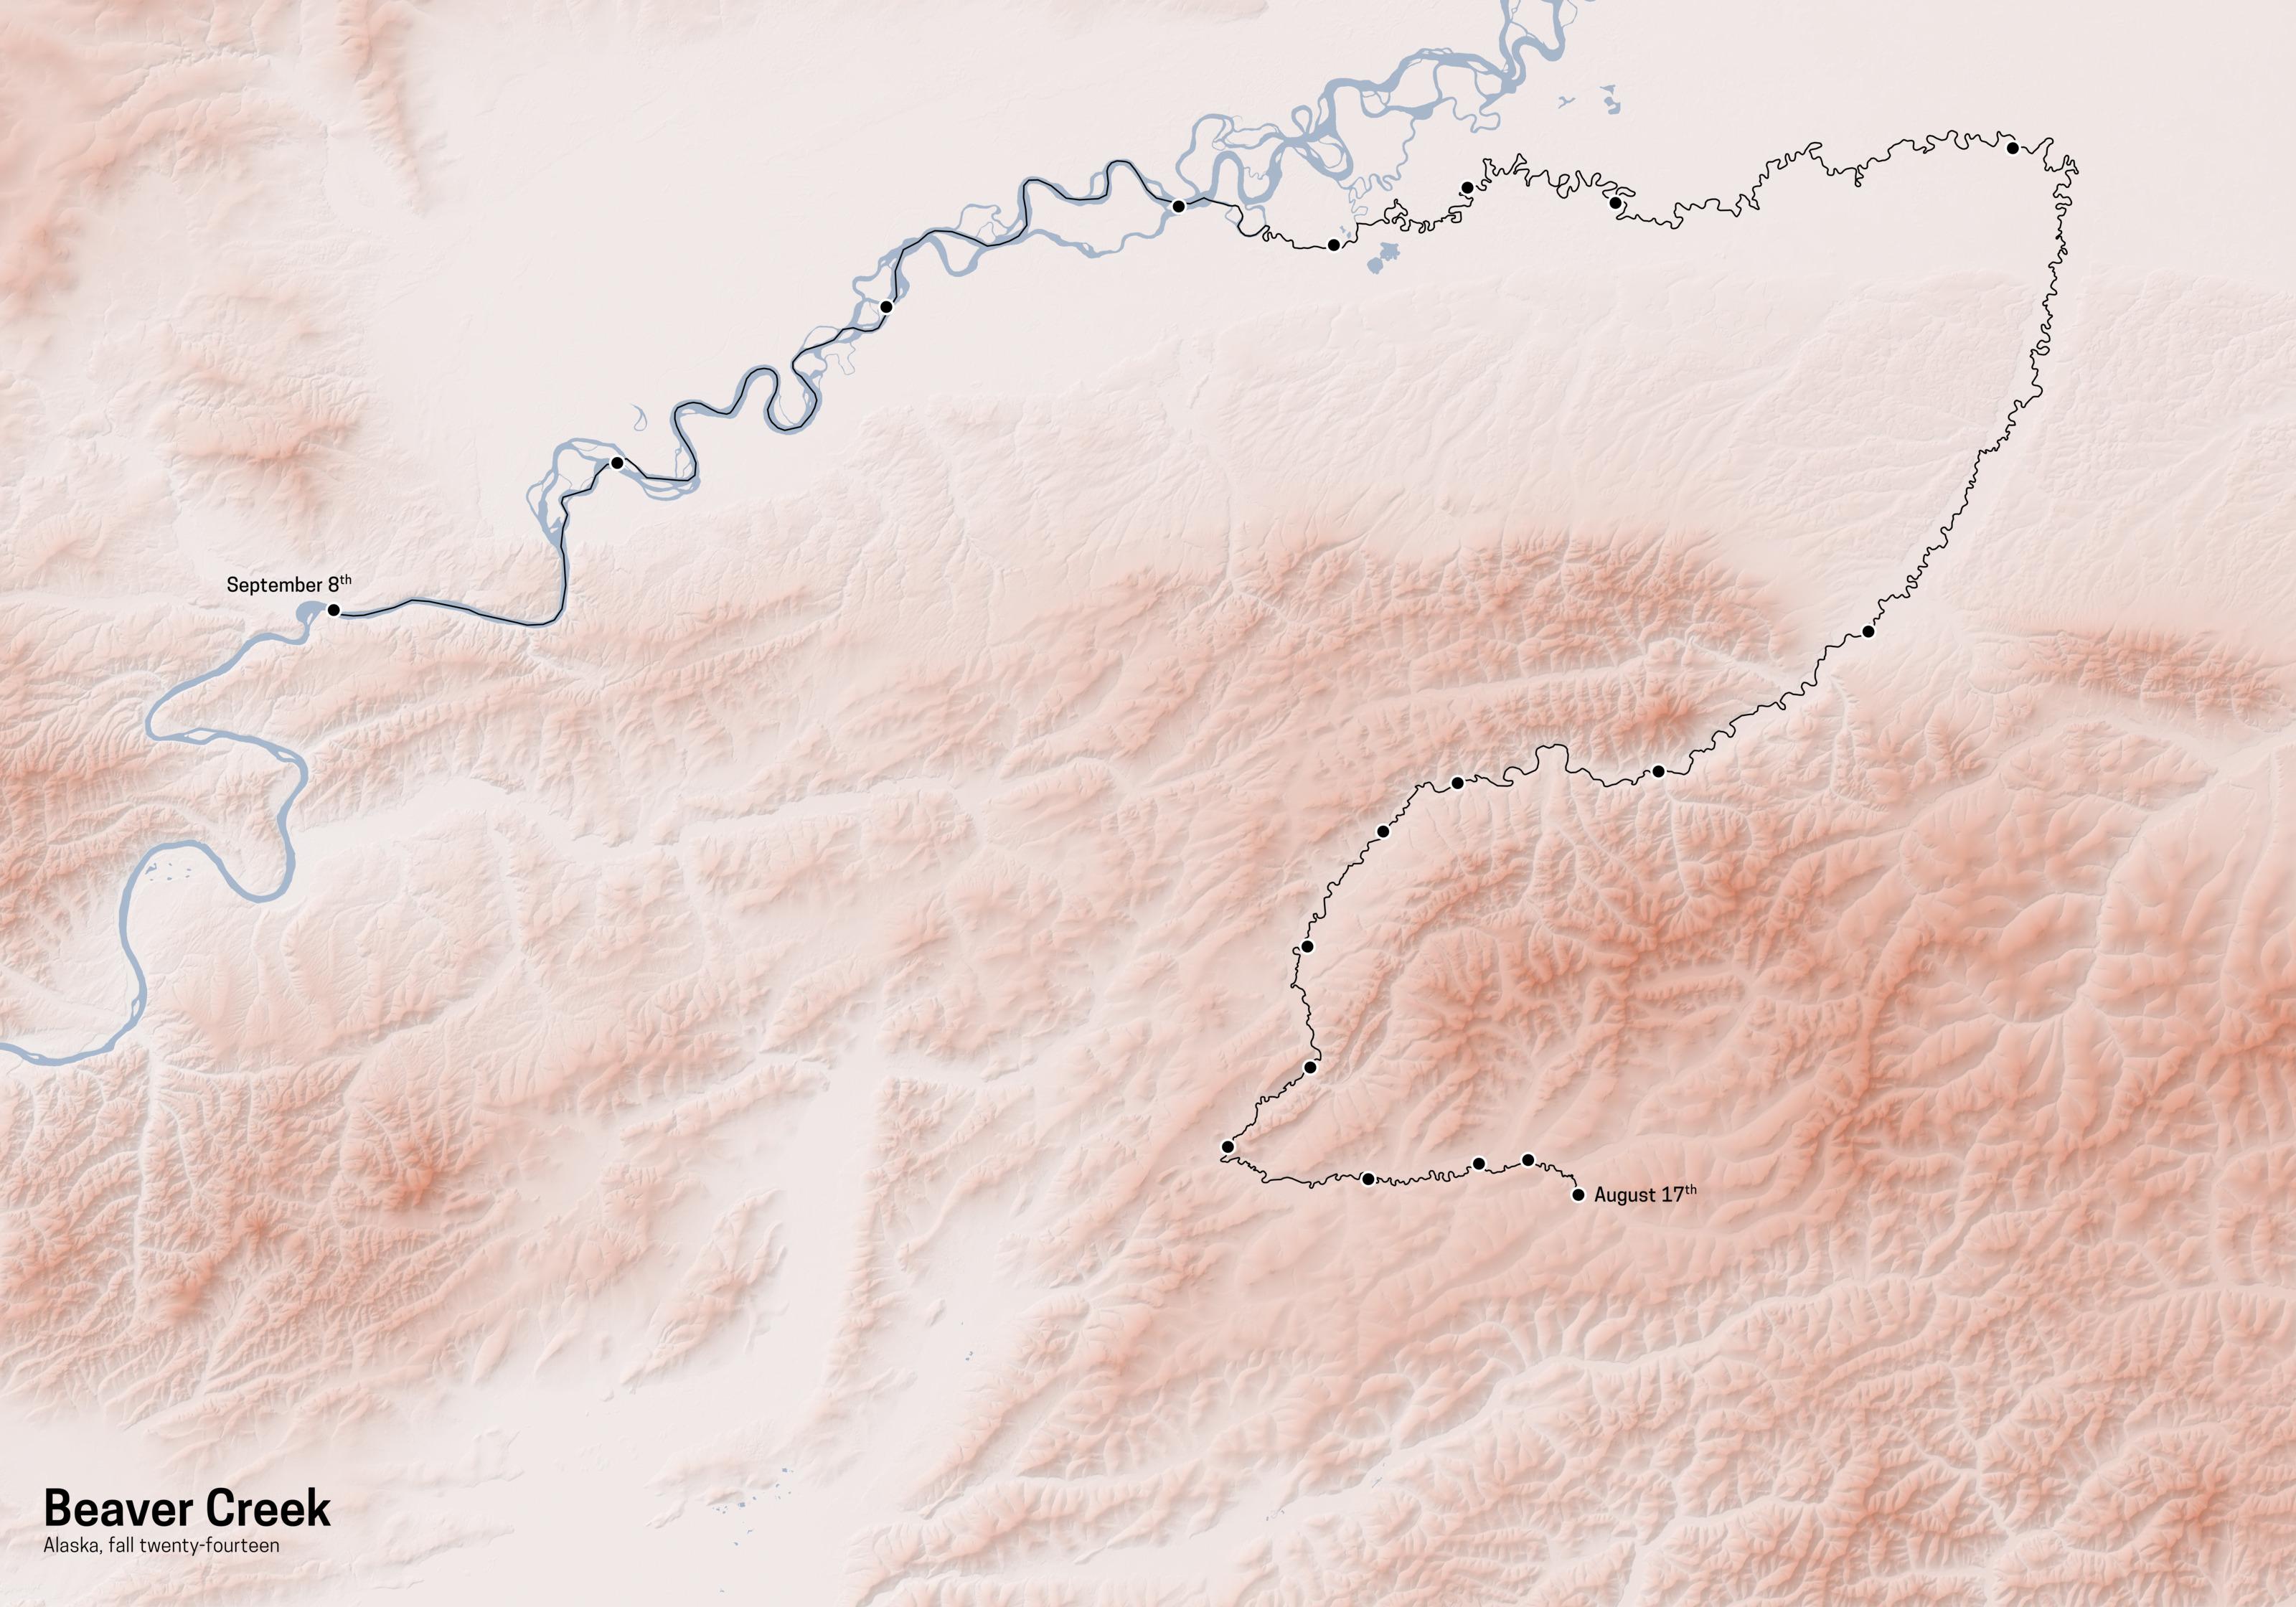
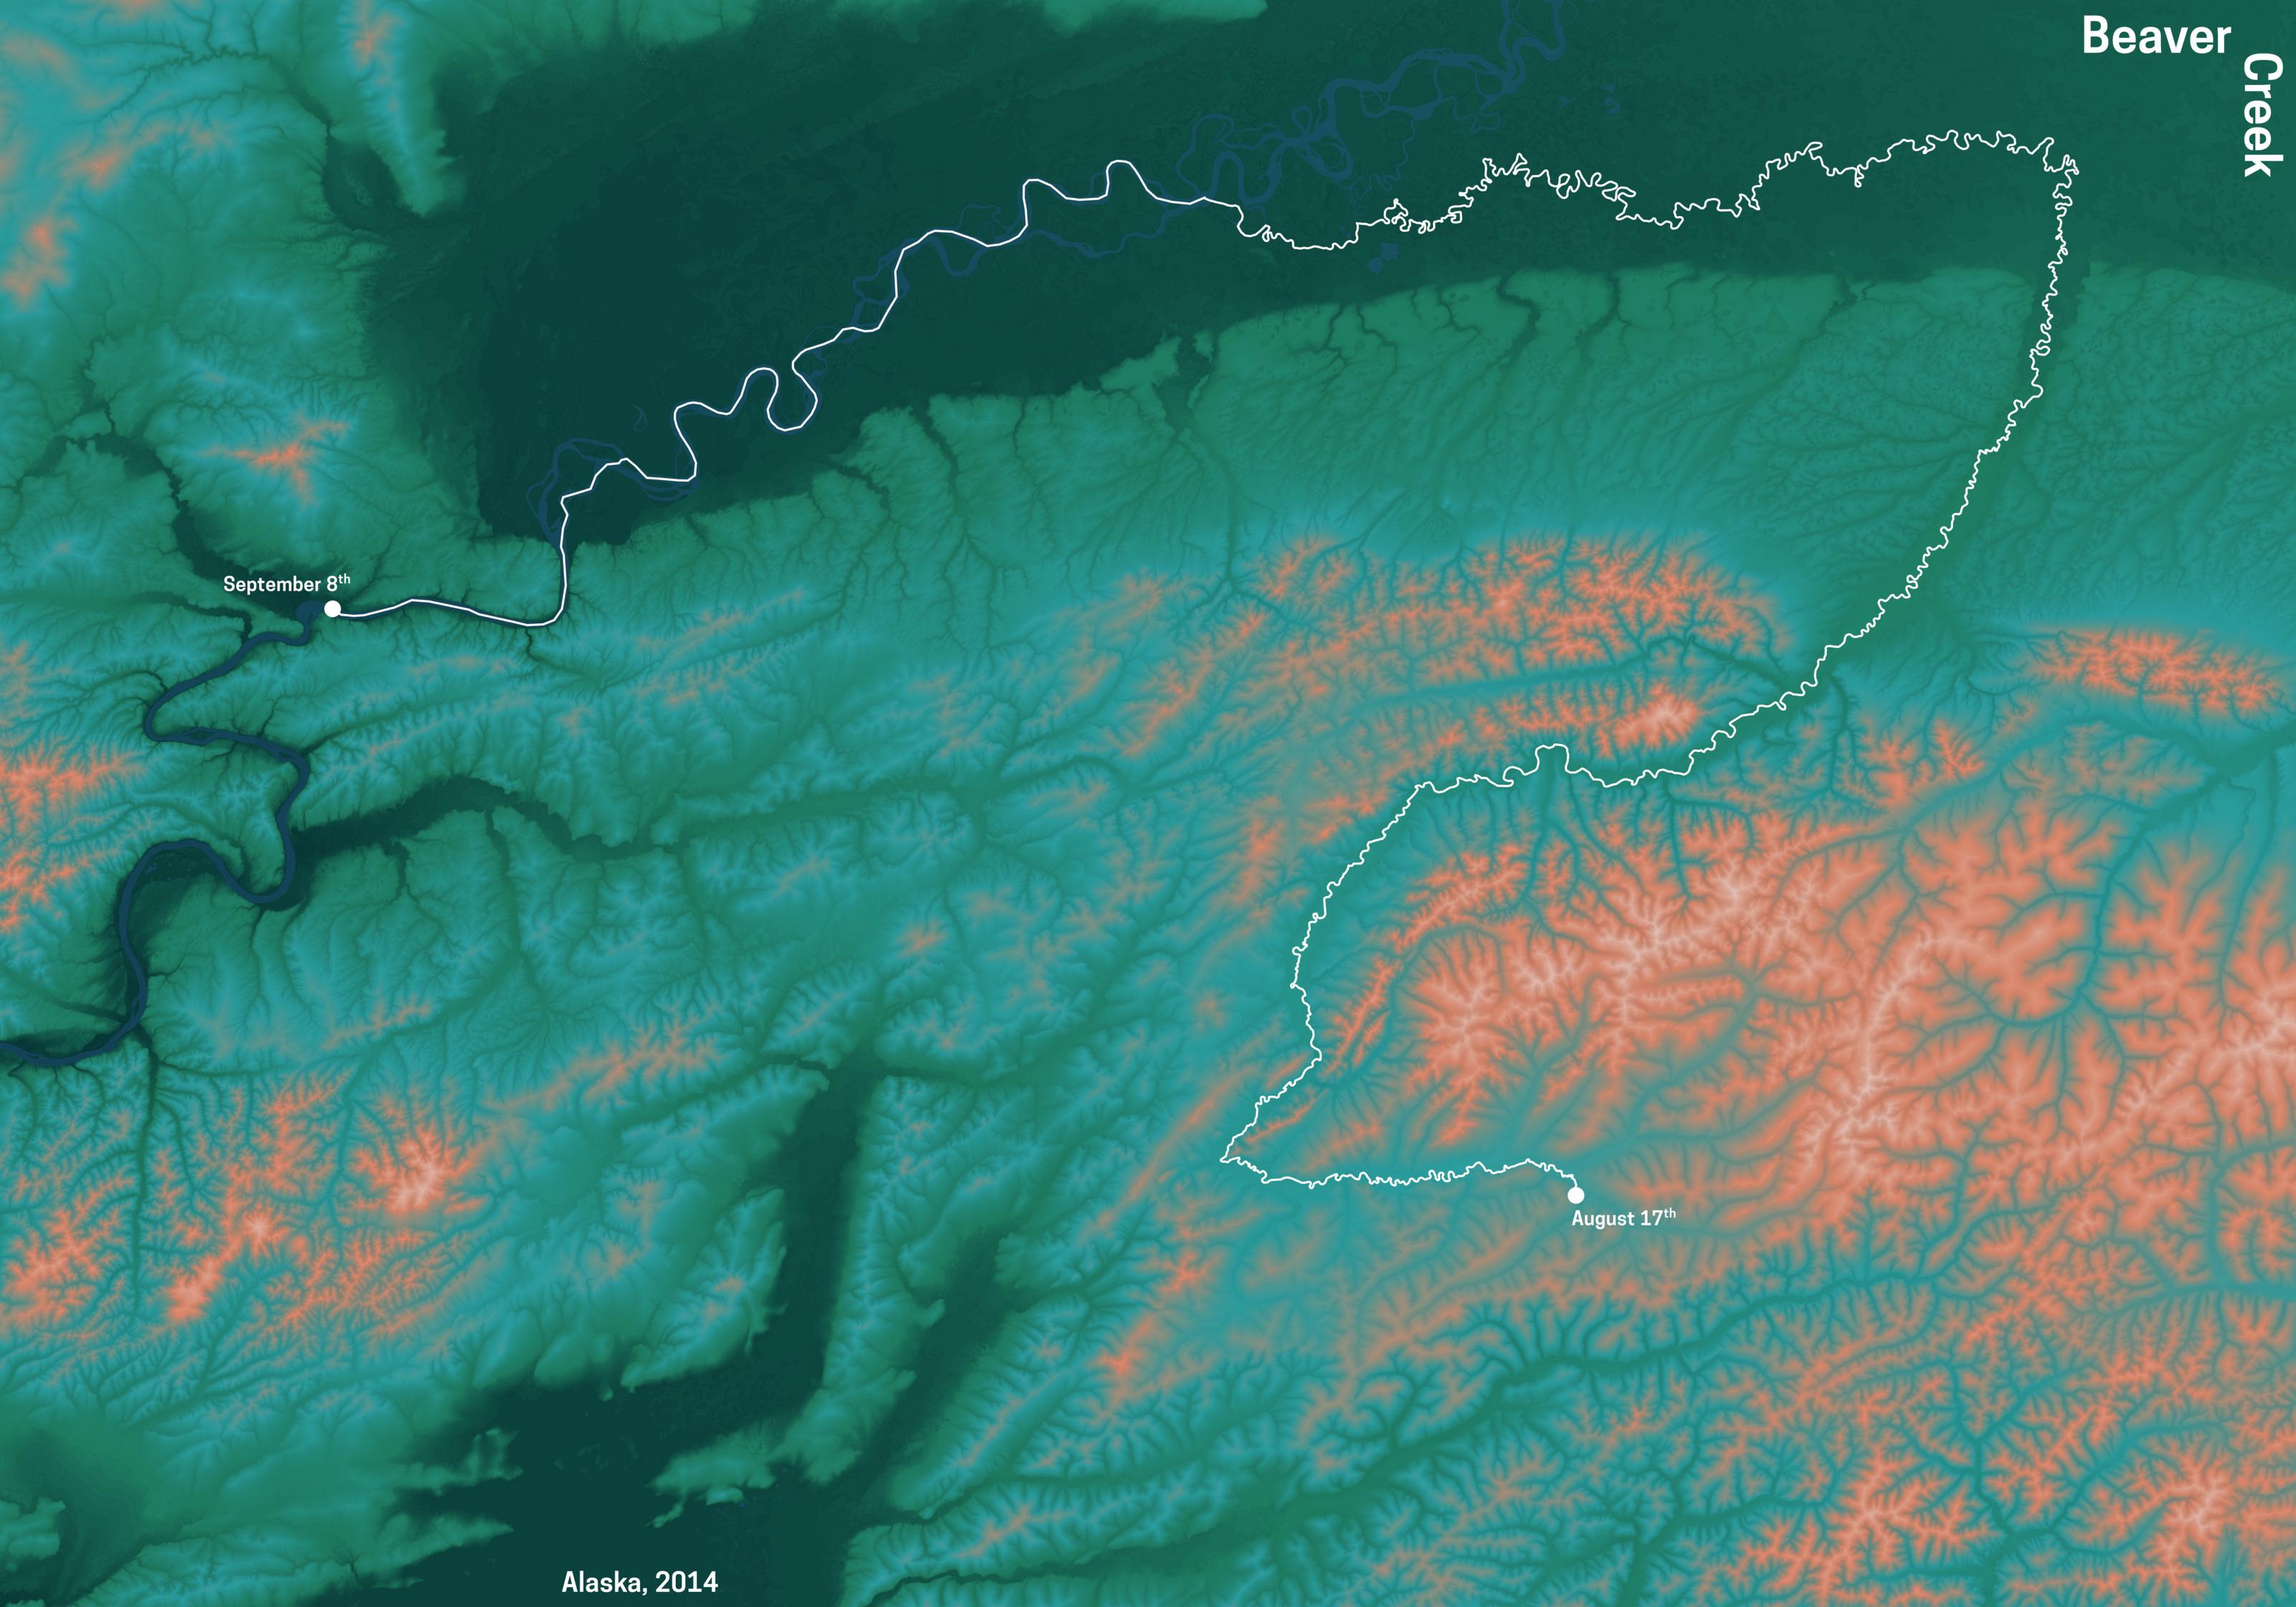
By the way, with your help to get me started, this is how my #rayshader #maps of a canoe tour I did with a friend 10 years ago turned out in the end @SK53 @defuneste
Thanks again!
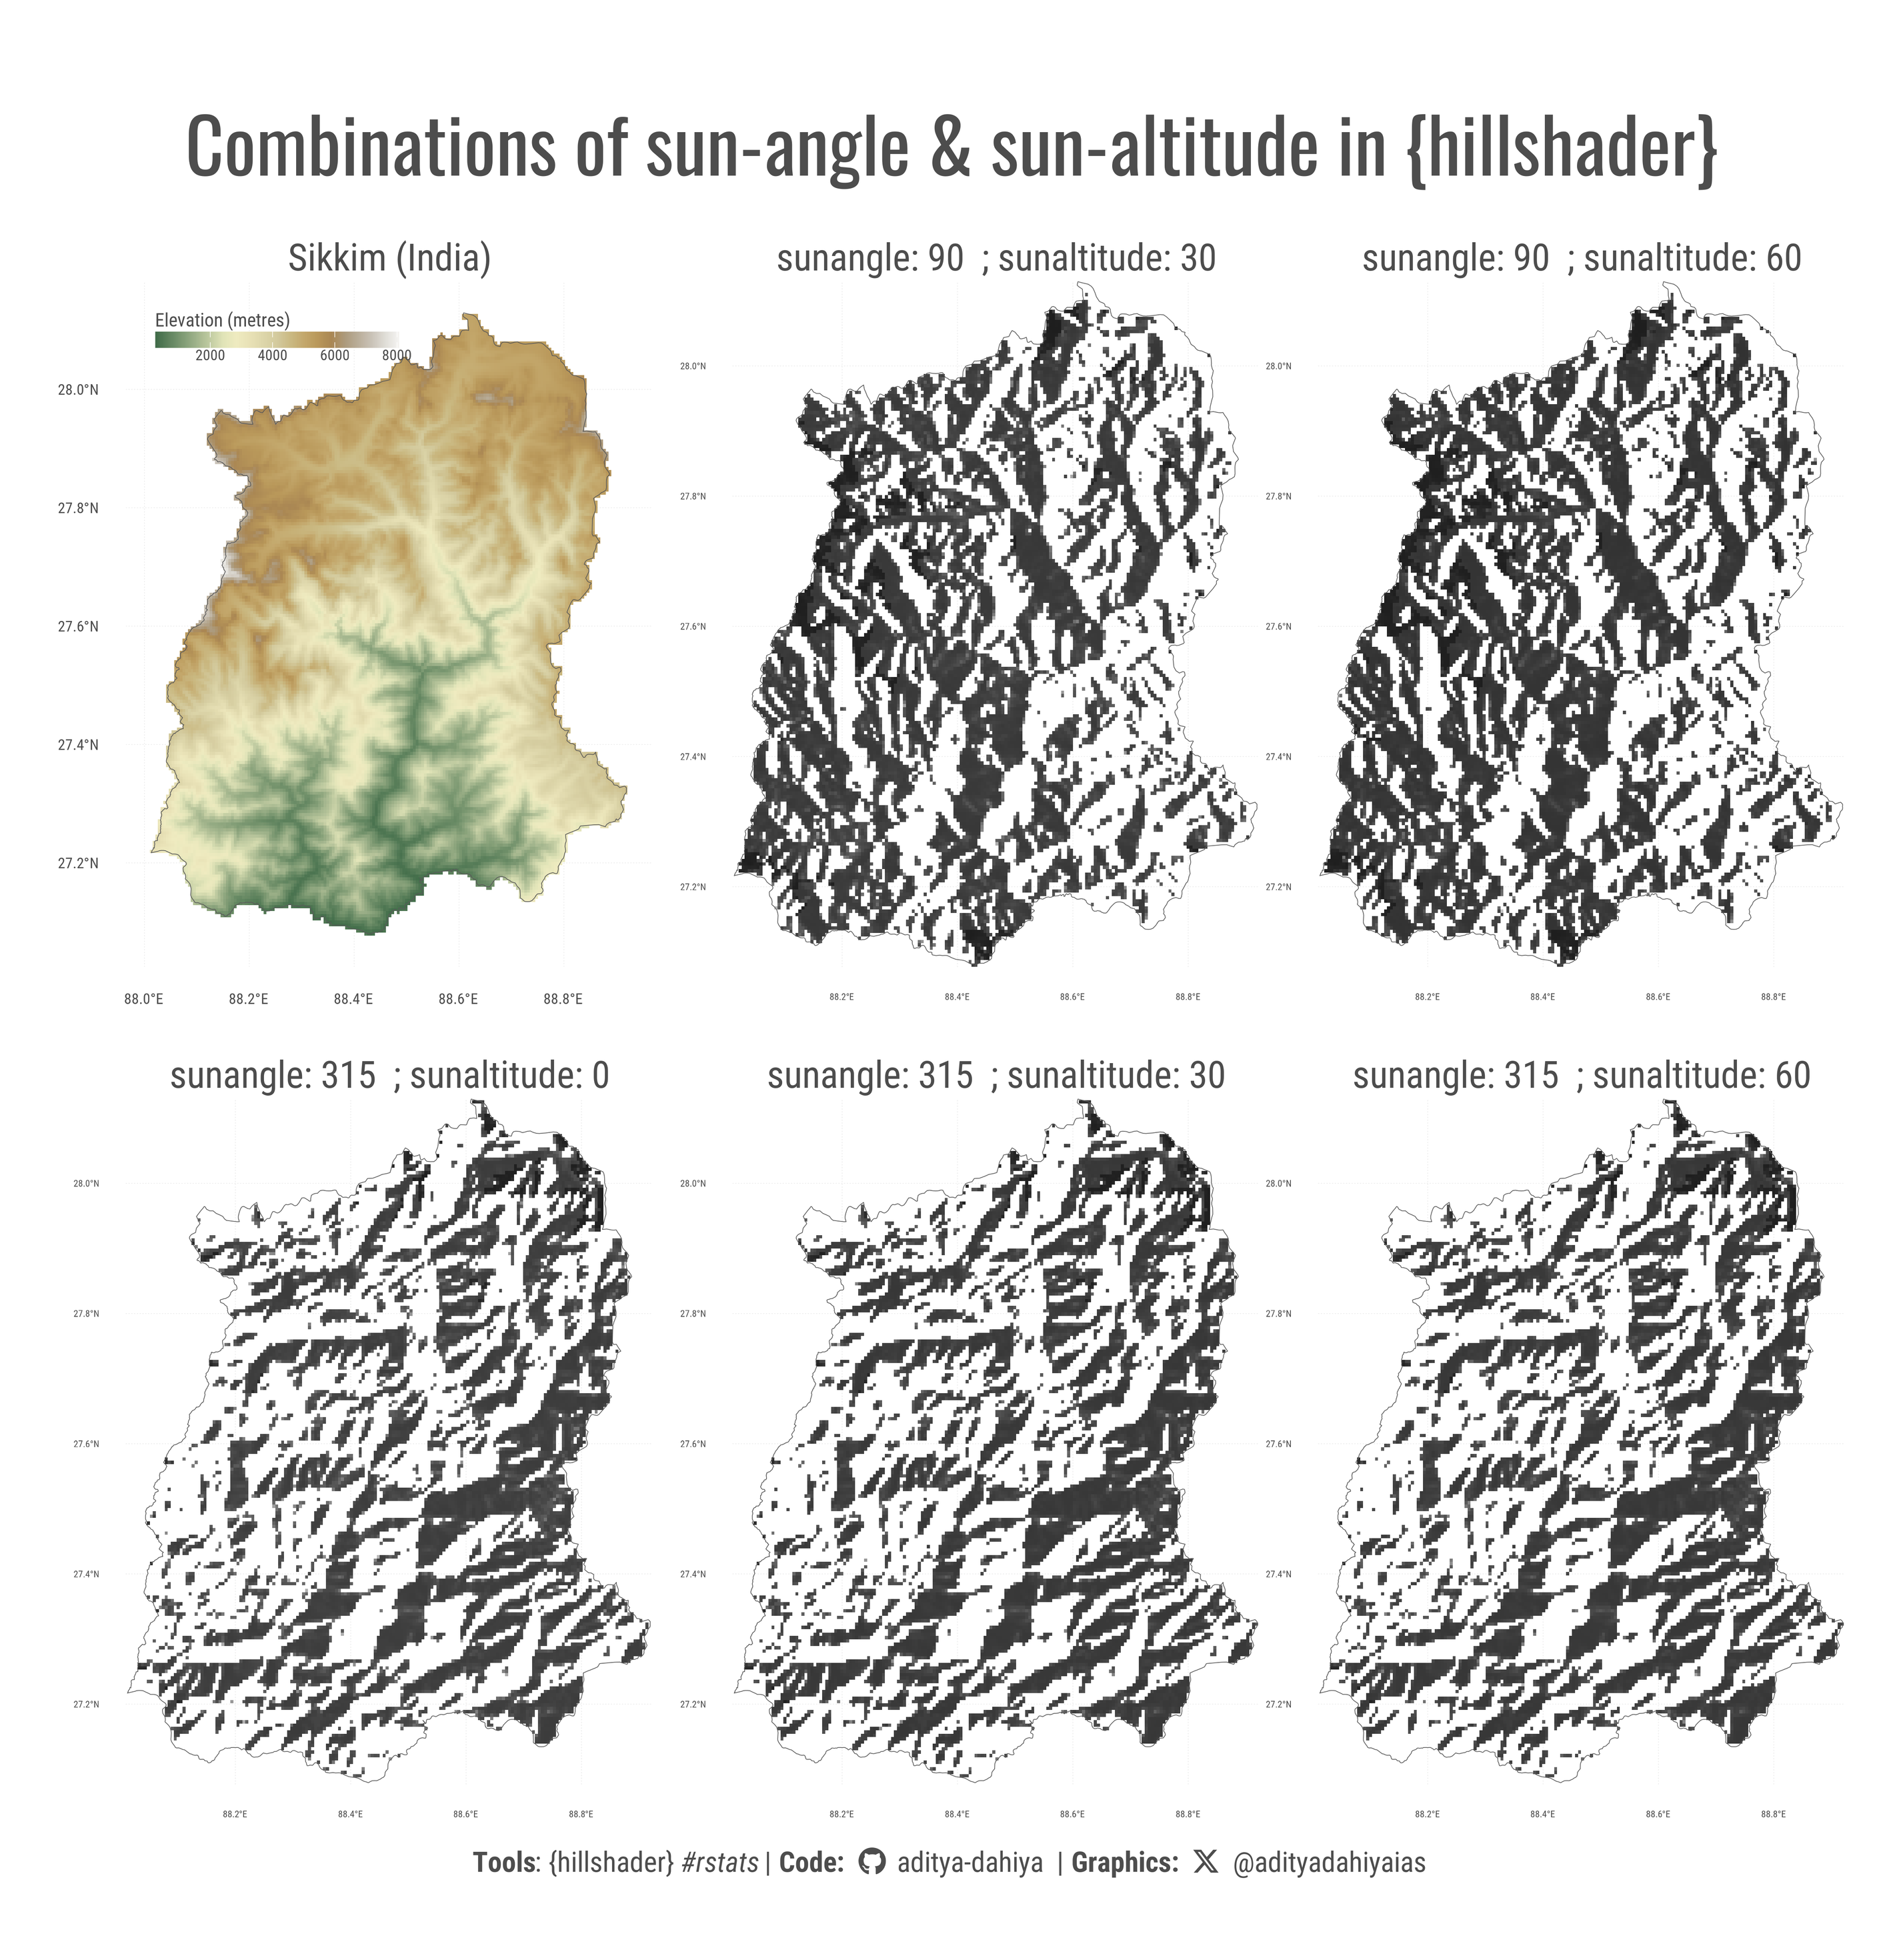
#dataviz #maps Code experimenting with package {hillshader} by @pierreroudier - a wrapper around #rayshader - quick code to plot hilly regions in #rstats
Full Code🔗https://tinyurl.com/hill-sikkim
Tools: #ggplot2 #terra #tidyterra by @dhernangomez #elevatr by USEPA
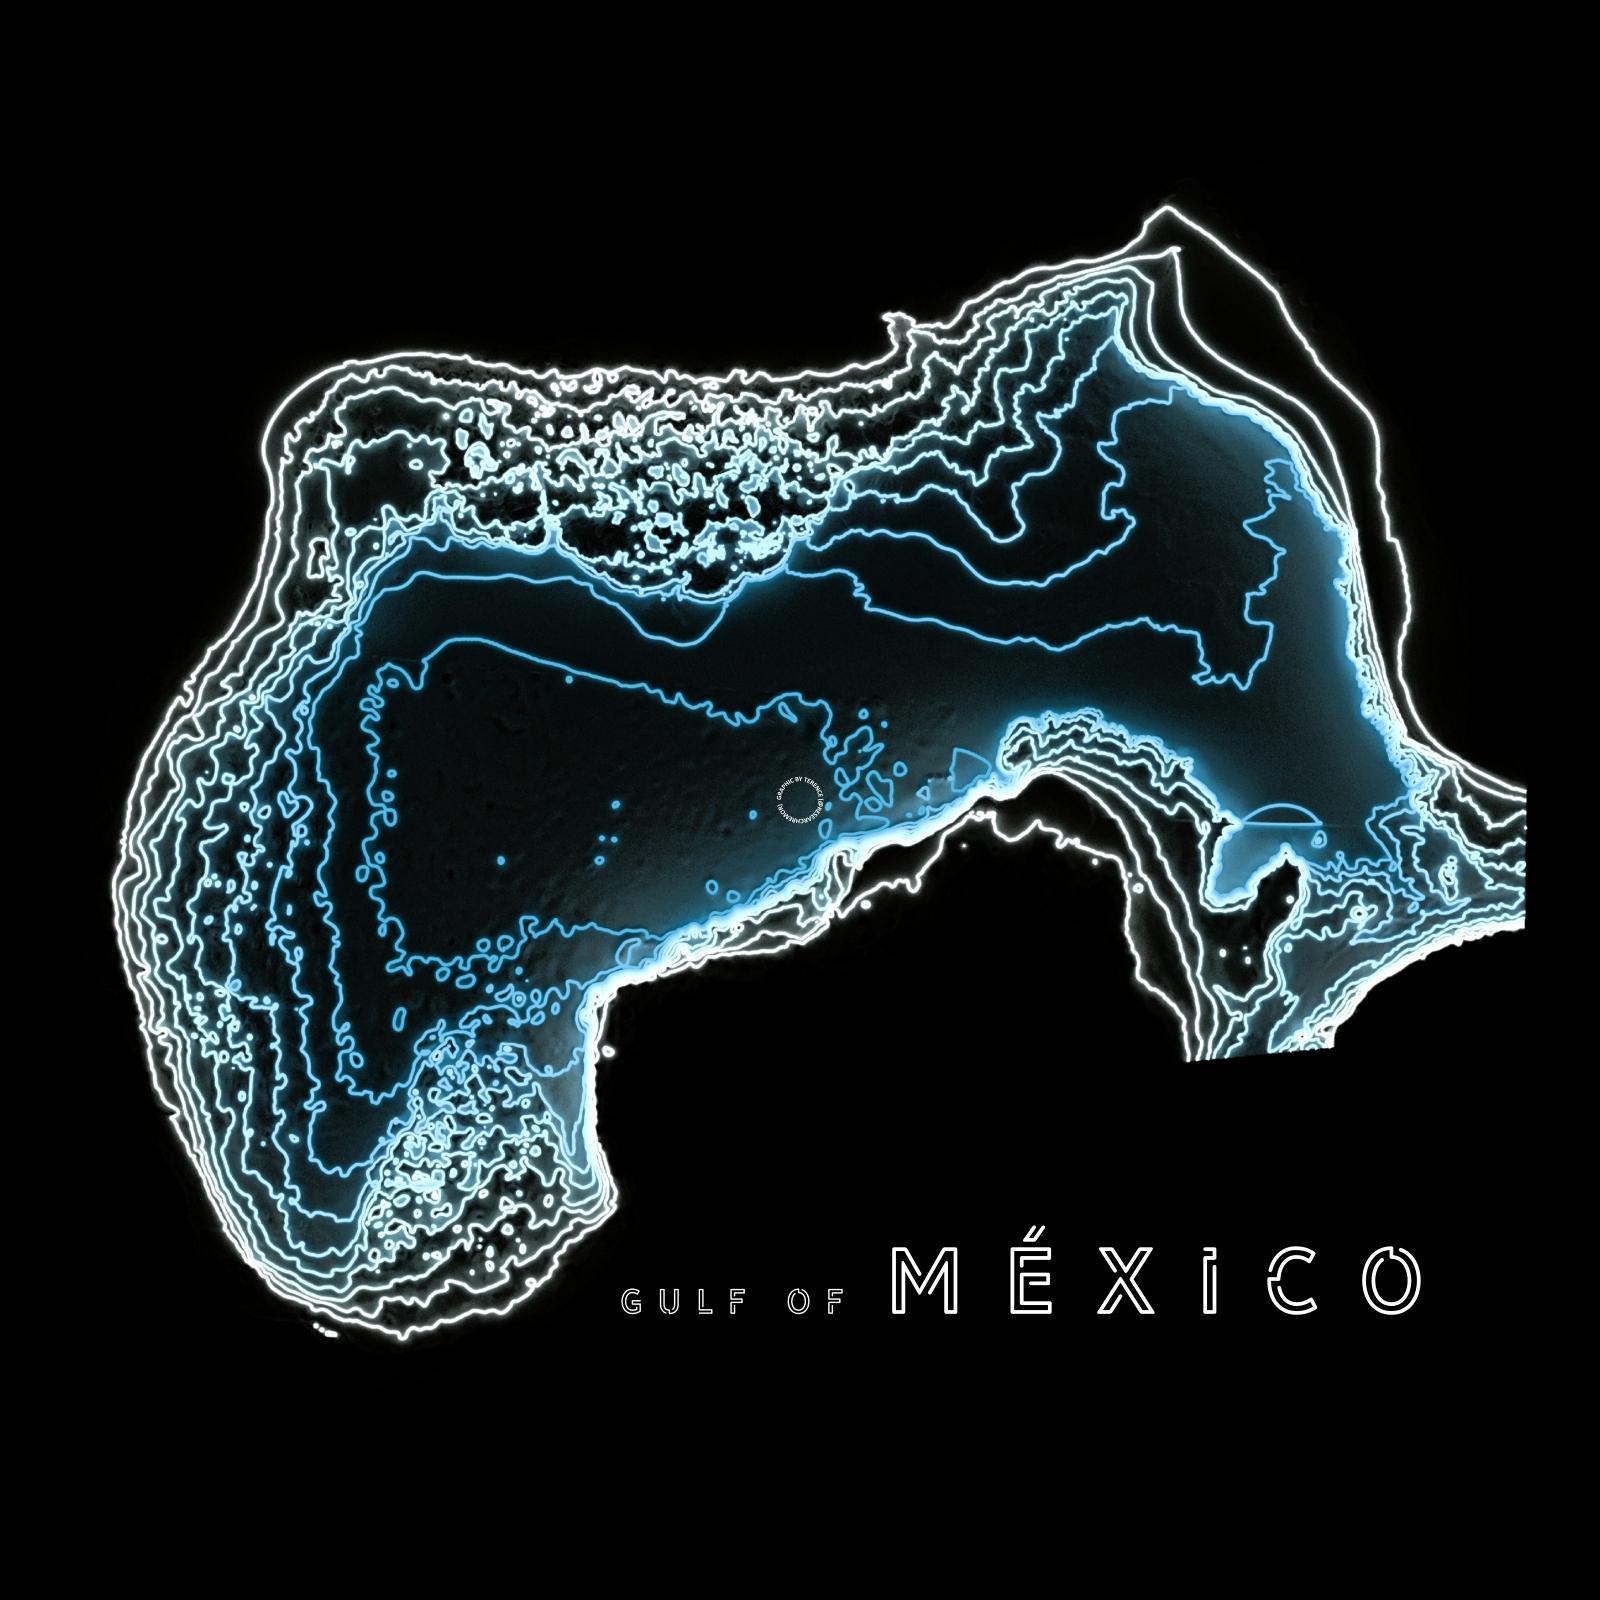
Illuminated contours of the Gulf of México.
#rayshader adventures, an #rstats tale
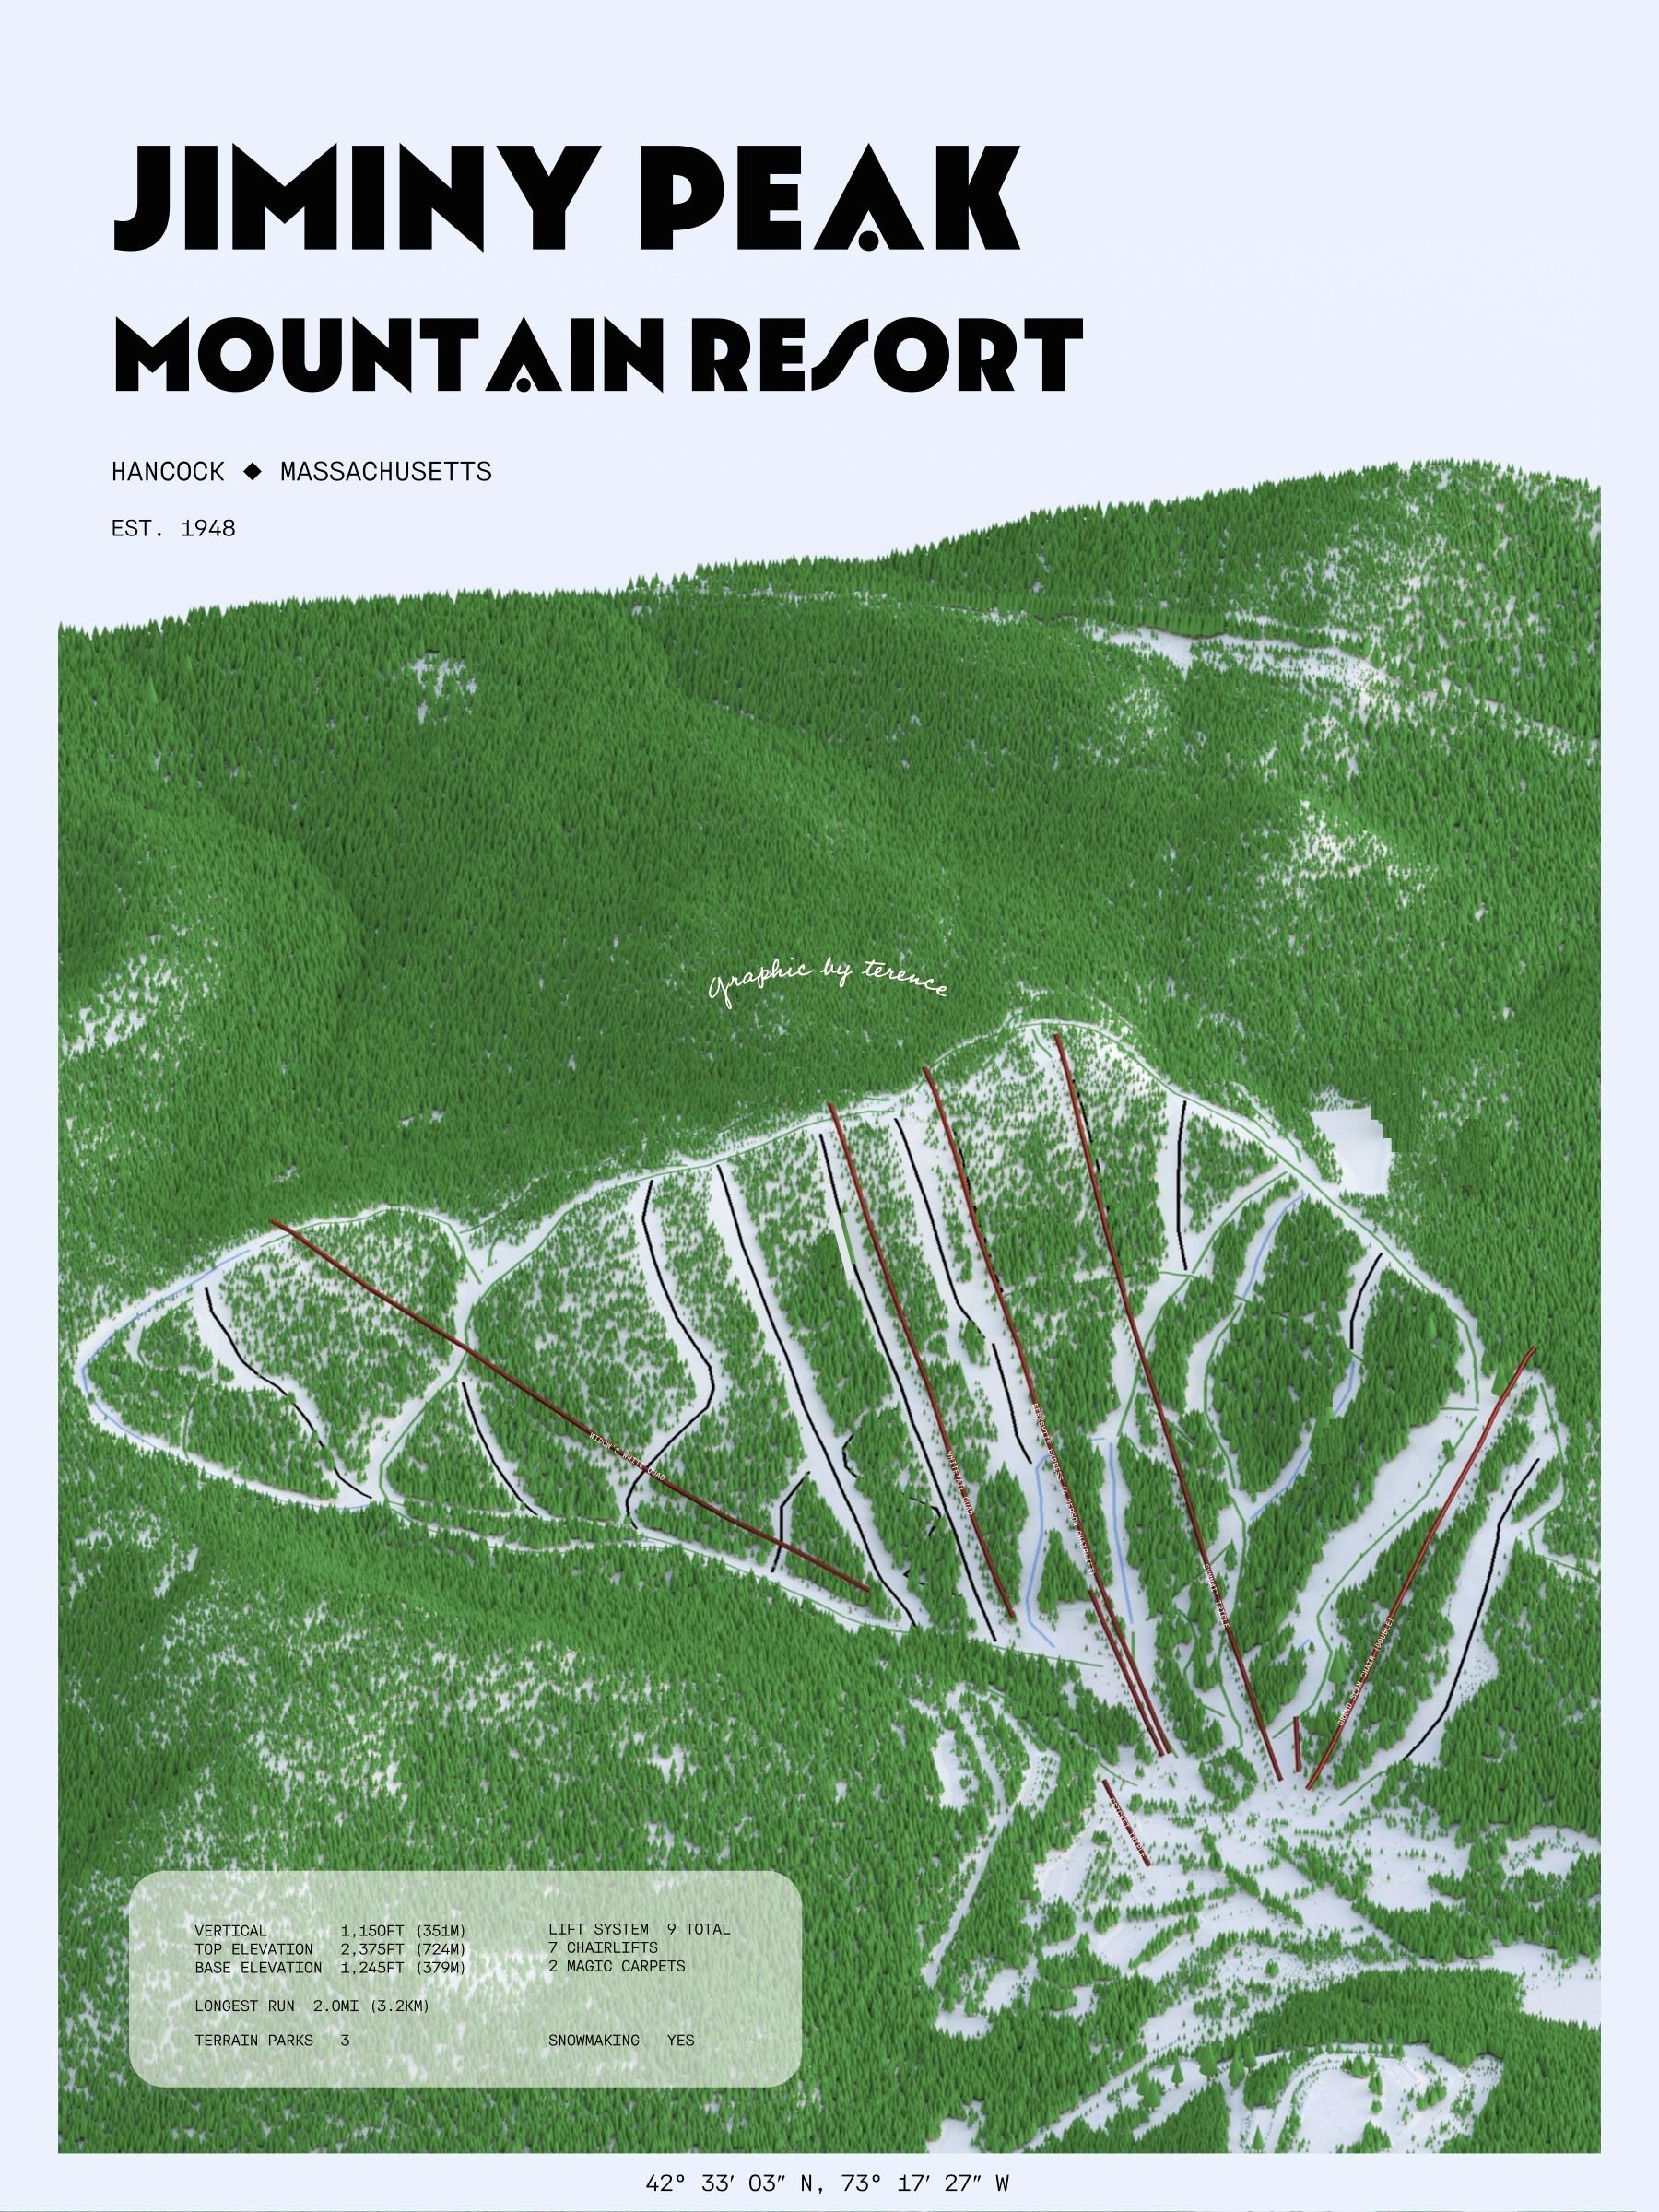
Okay, this is it for the evening. Will keep working on it but I need to think of something else to do to keep myself motivated. Here's Jiminy Peak Resort, Hancock, Massachusetts.
Thoughts/suggestions welcome!
#rayshader adventures, an #rstats tale
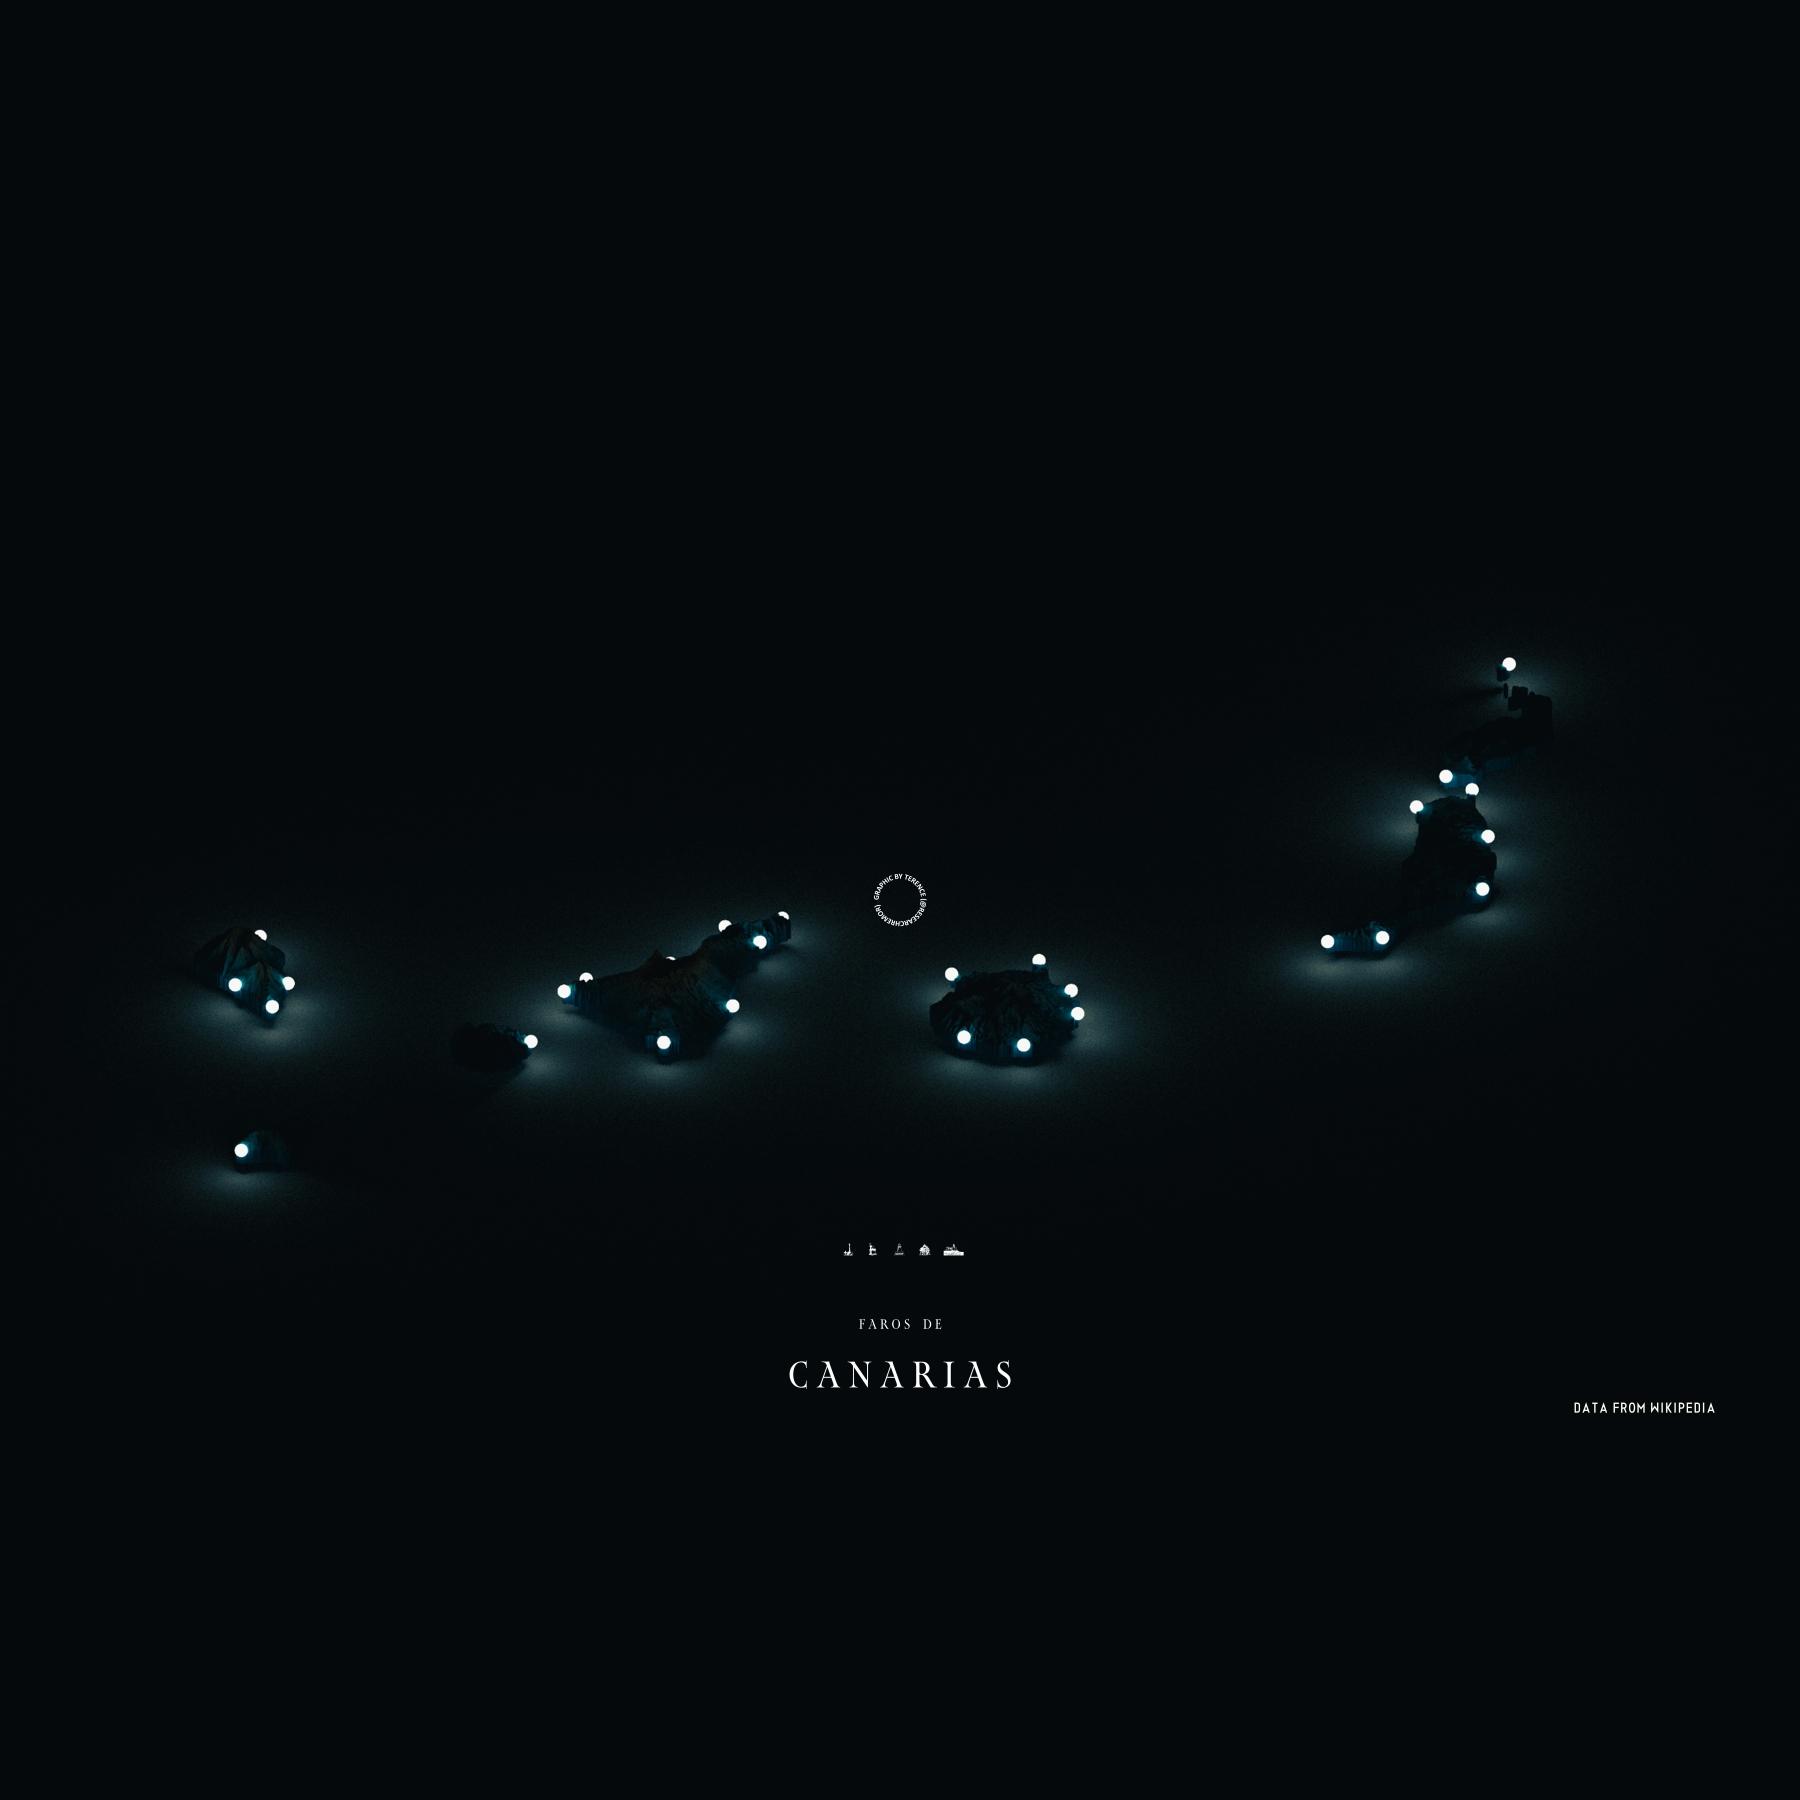
Also, back to playing with lighthouses with one of Crete.
#rayshader adventures, an #rstats tale

Trying something different.
#rayshader adventures, an #rstats tale
I found a great excuse to make a bunch of fun ggplots. As if I needed one.
#30DayMapChallenge, Day 30, The Final Map. Konbini of Toyto.
#rayshader adventures, an #rstats tale
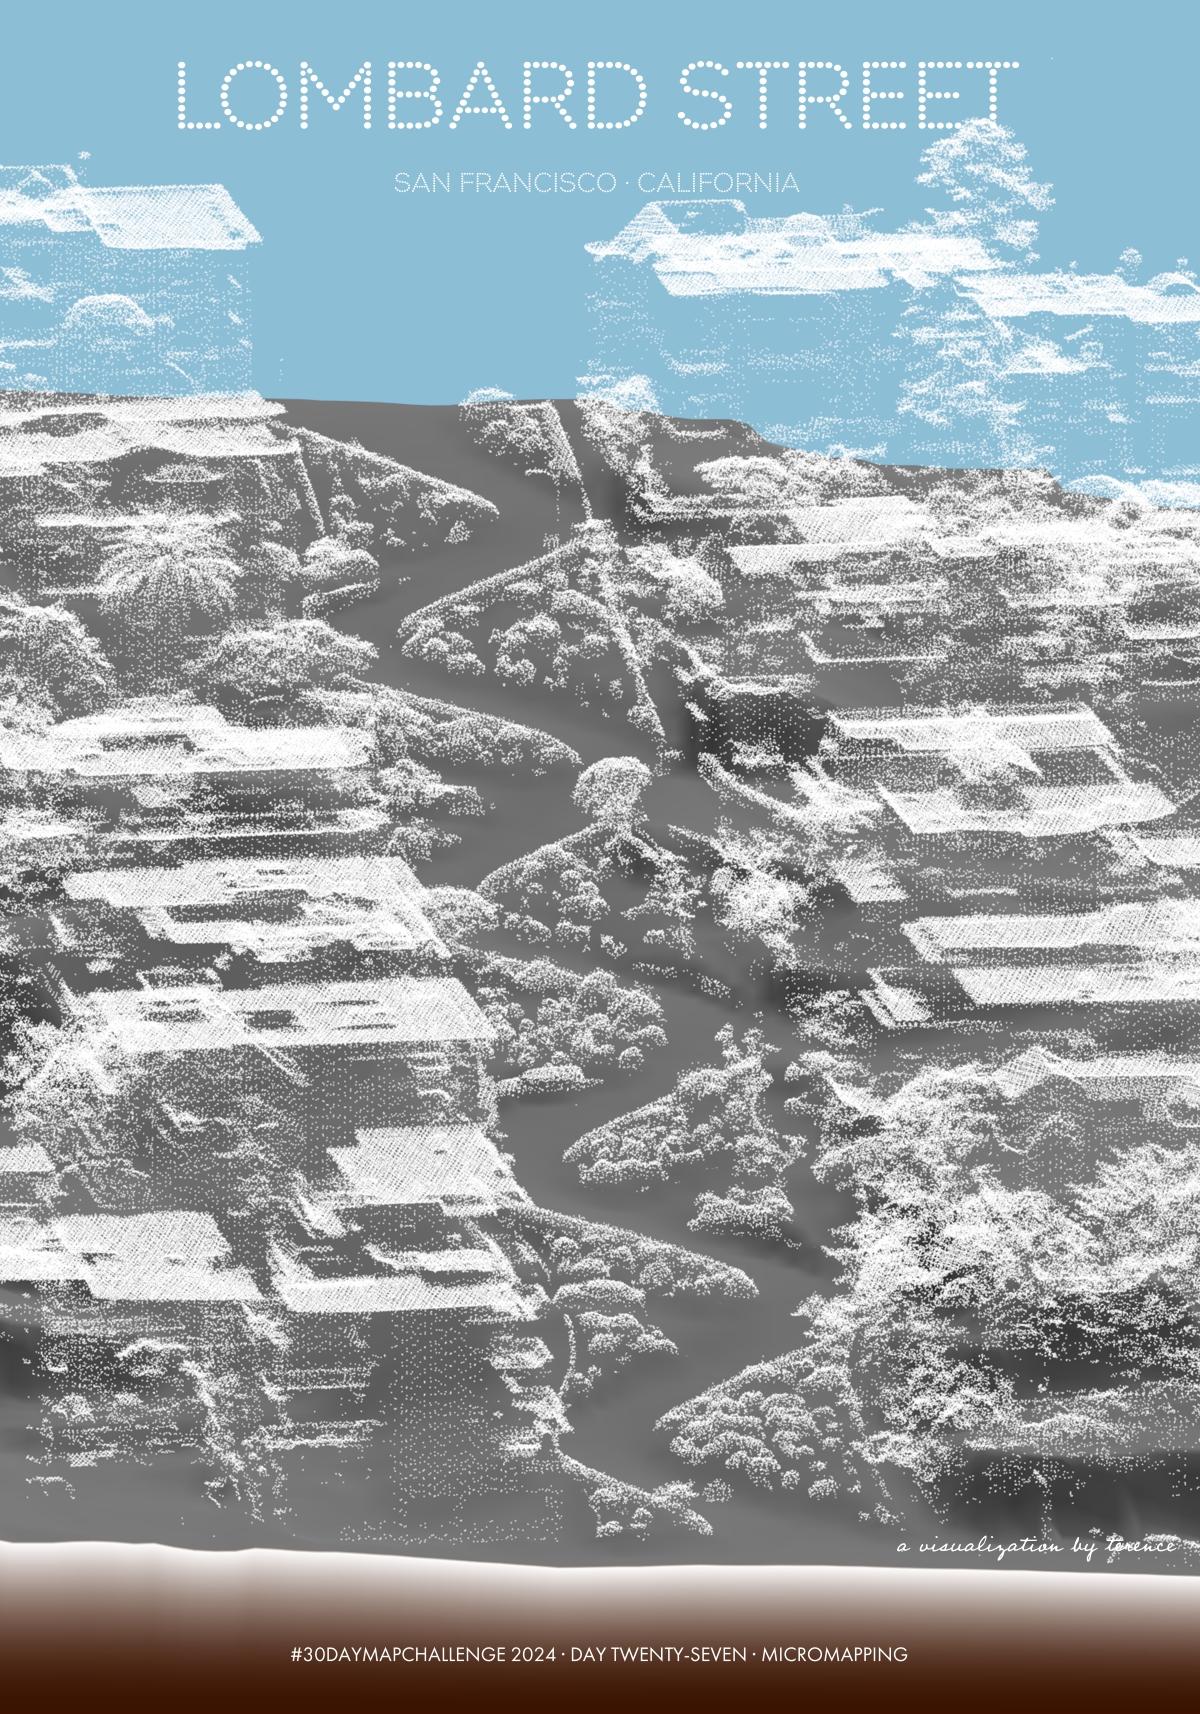
#30DayMapChallenge · Day 27 · Micromapping. Almost there...this is Lombard Street, San Francisco.
#rayshader adventures, an #rstats tale
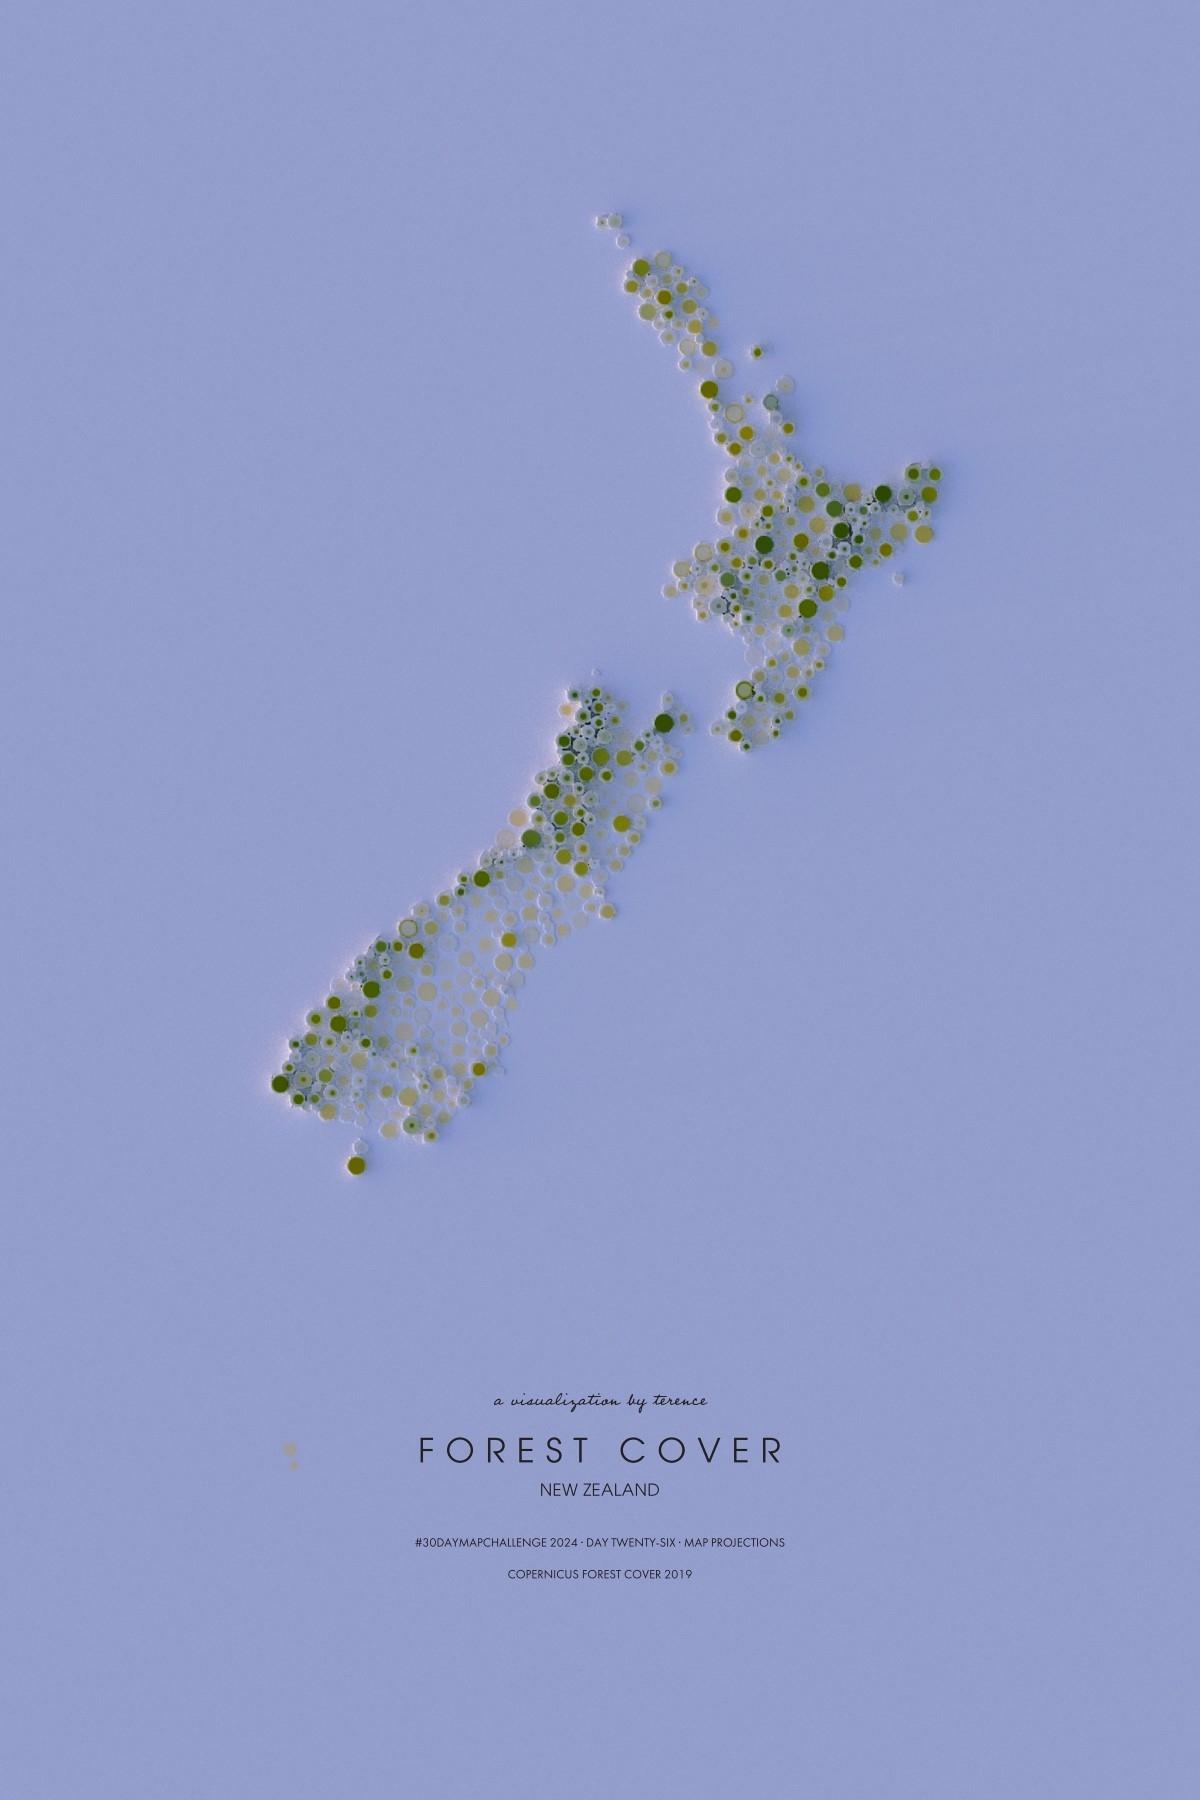
#30DayMapChallenge · Day 26 · Map projections. Another one. New Zealand often gets left out of maps. In fact, the code I used to turn the global forest cover map into circles left out NZ! I felt bad so here's a forest cover map of NZ.
#rayshader adventures, an #rstats tale
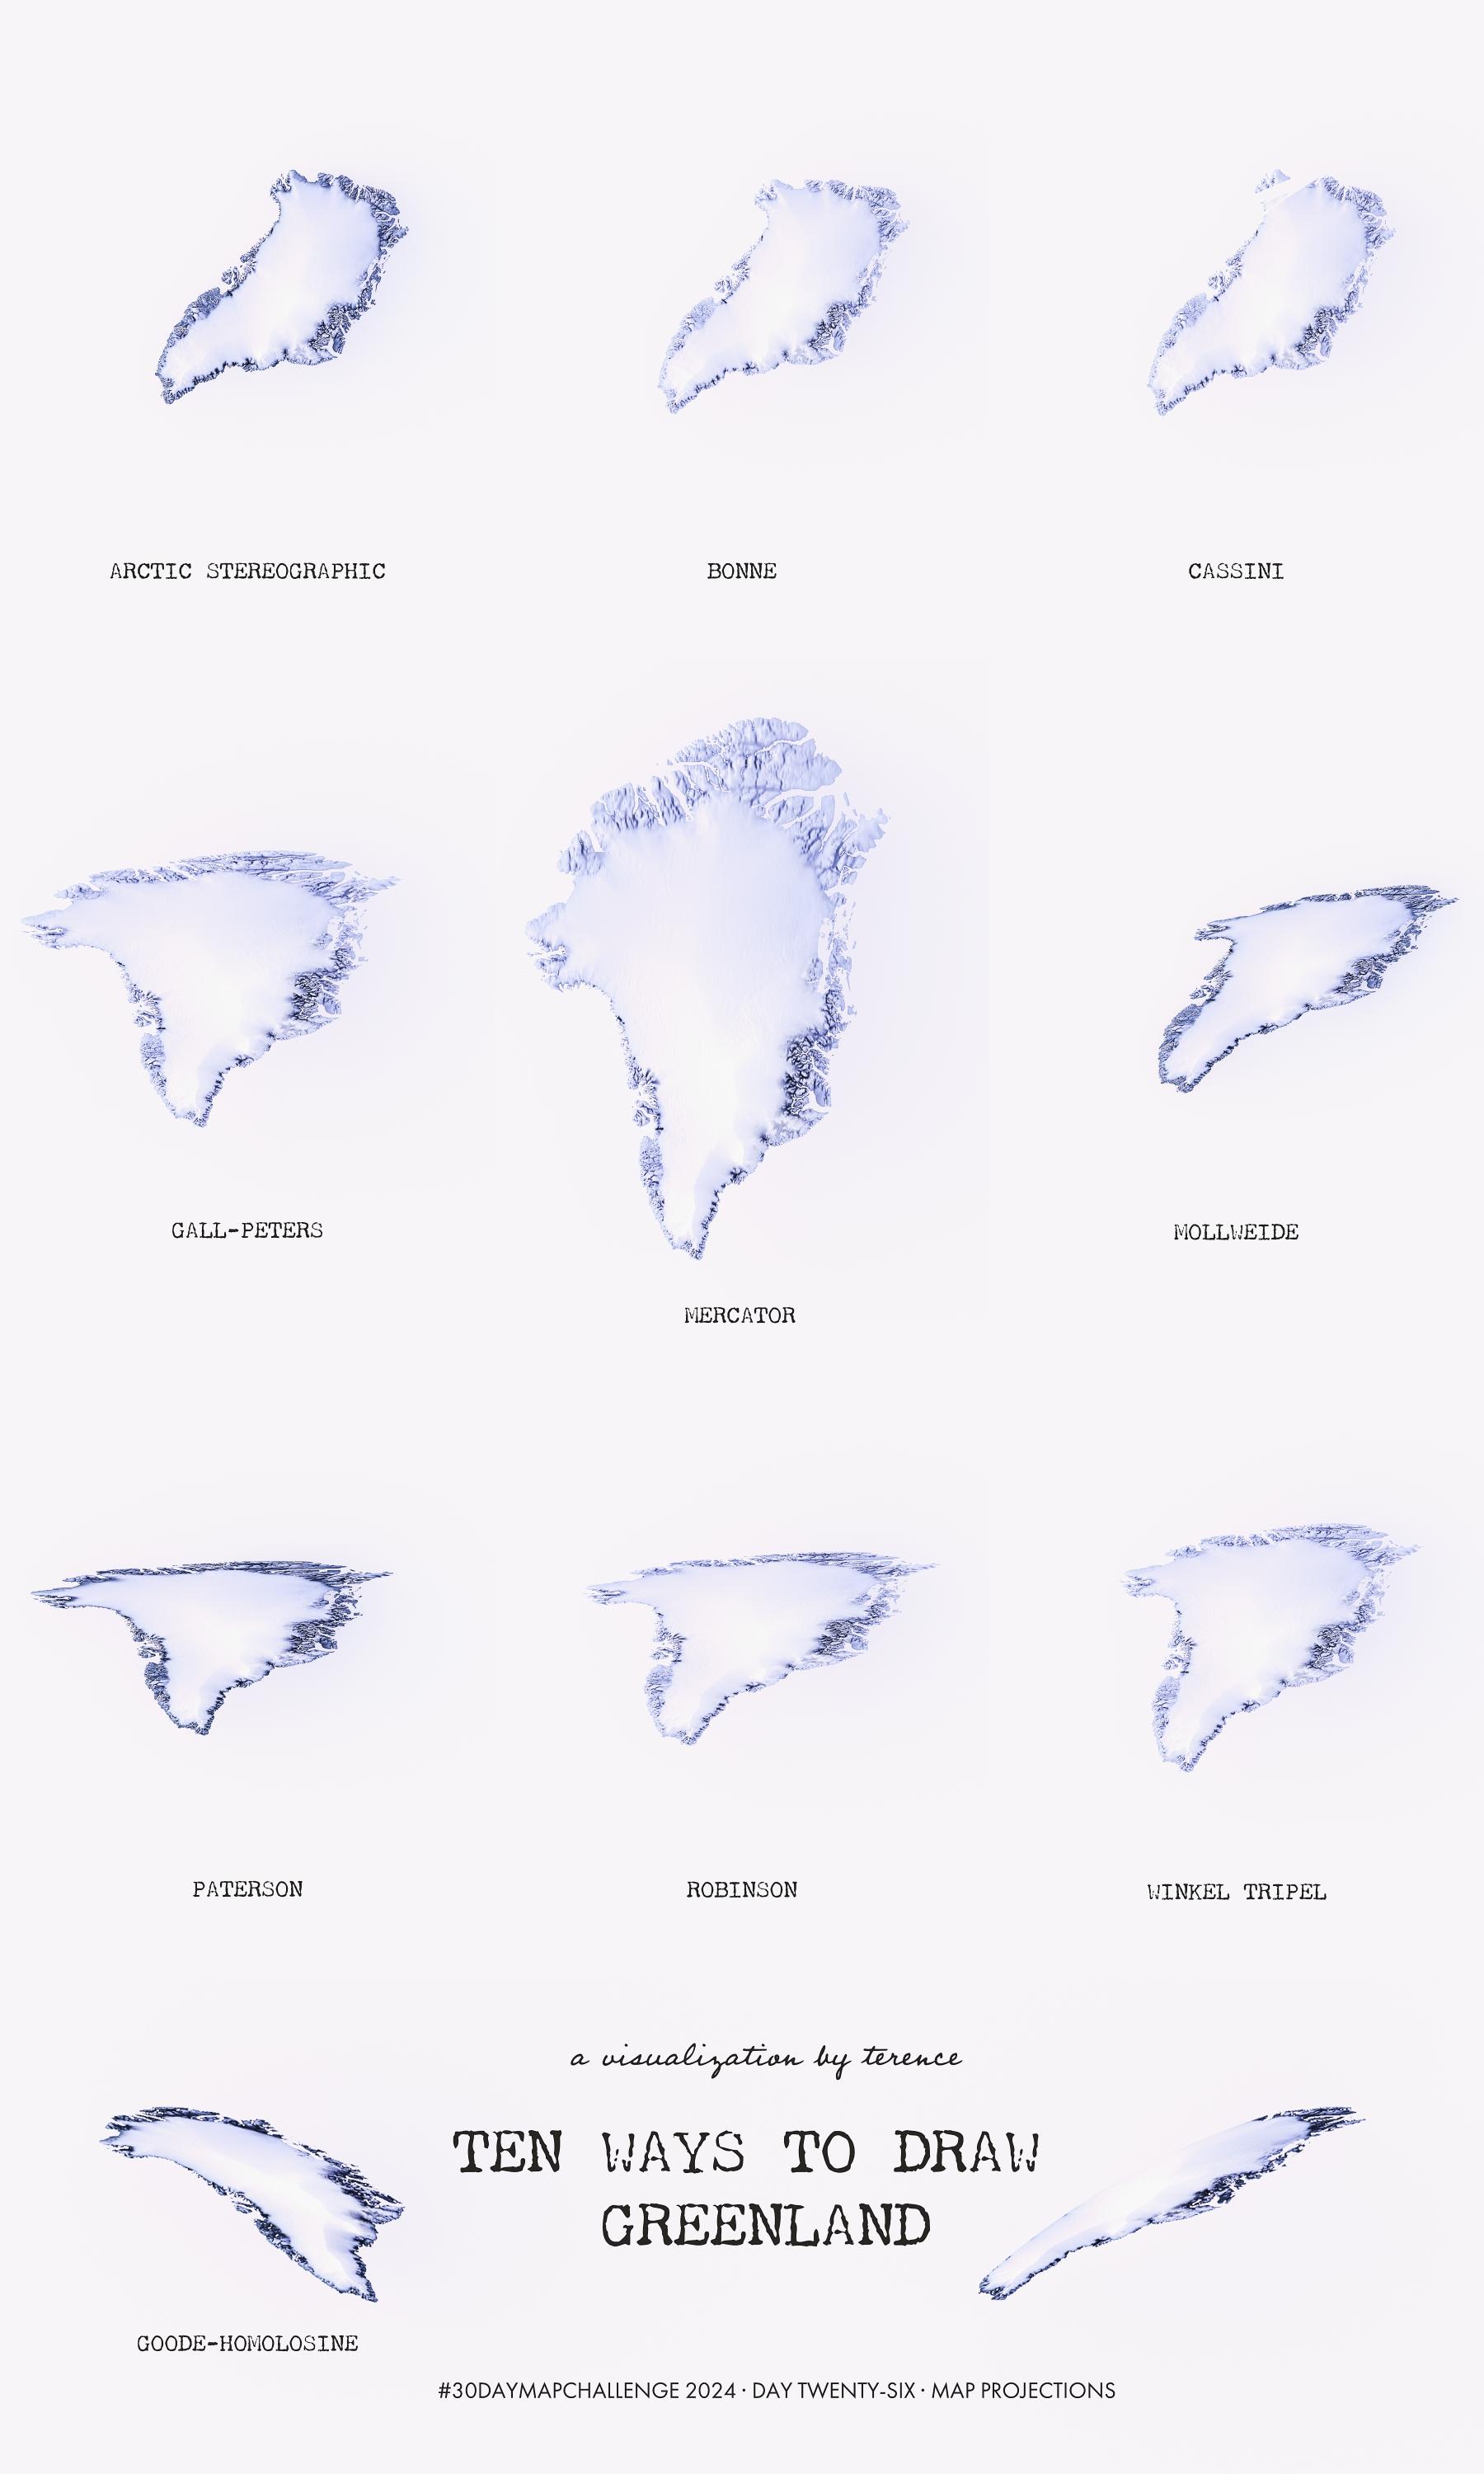
#30DayMapChallenge · Day 26 · Map projections. Thought this was a new idea but had a nagging suspicion I saw it before. And indeed I have! It was created by the amazing @pokateo! Here's my attempt: Ten ways to draw Greenland.
#rayshader adventures, an #rstats tale
#30DayMapChallenge · Day 25 · Heat. Considered calling it quits because I'm spent. But here I am again with a visualisation of average monthly universal thermal climate index in 2023. This index measures human thermal stress and discomfort in outdoor conditions.
#rayshader adventures, an #rstats tale
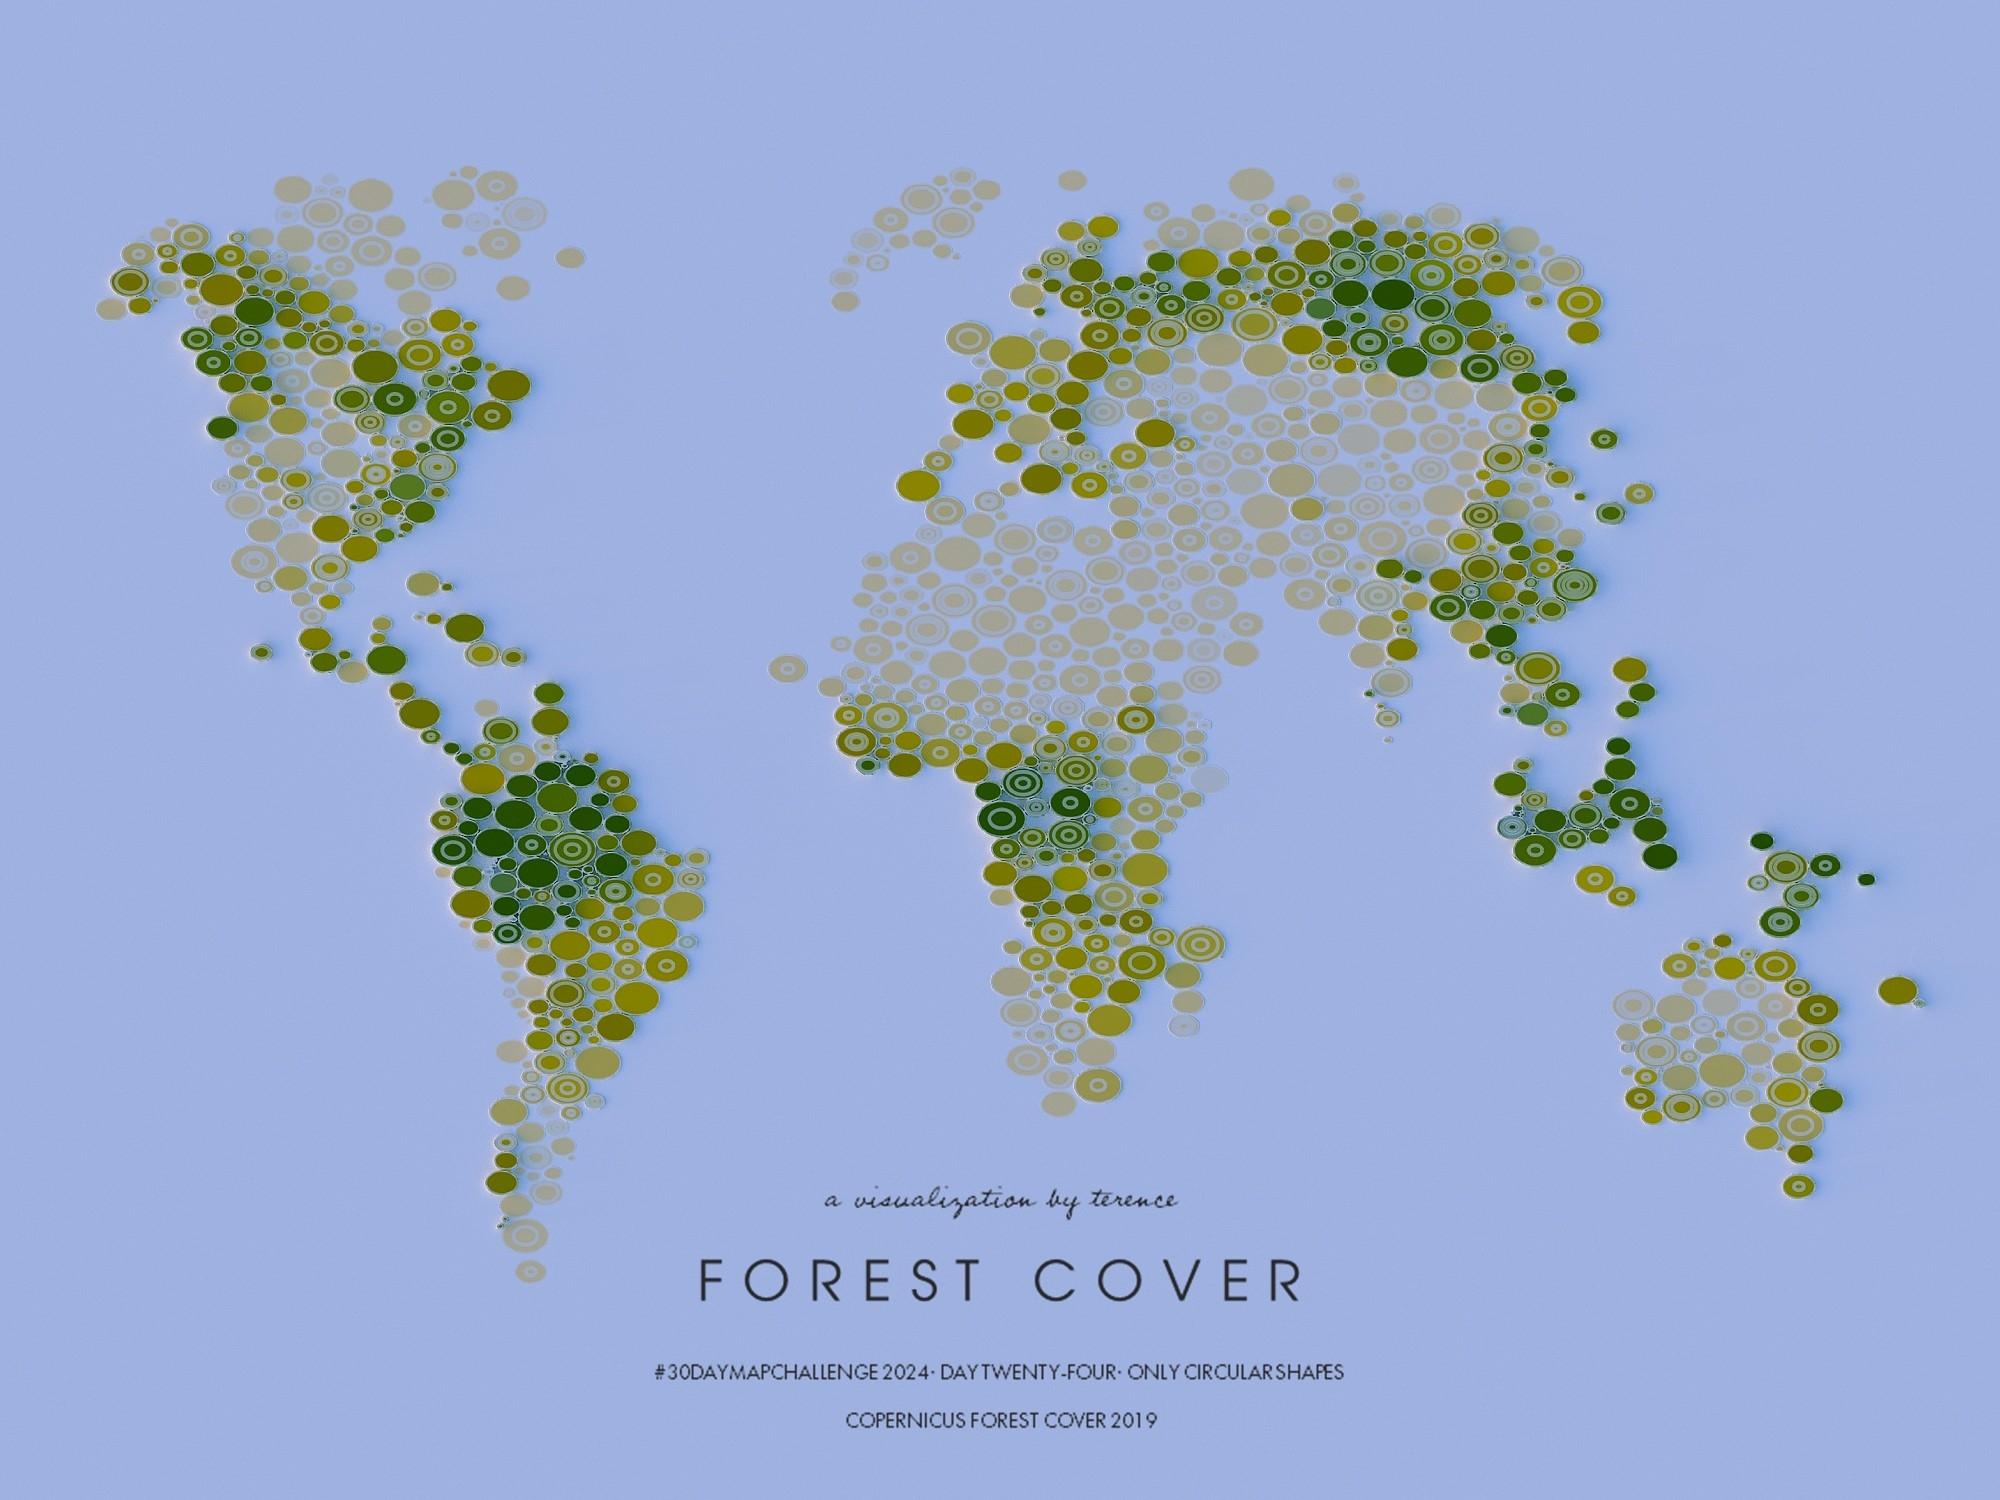
#30DayMapChallenge · Day 24 · Only circular shapes. World forest cover in circles.
#rayshader adventures, an #rstats tale