Amid very unhealthy air quality in Wisconsin, N95 respirators protect against particulate pollution, letter campaign to reduce air pollution from cars due July 5 #AirQuality #CleanAir #N95 #MaskUp
https://precaution.substack.com/p/respirators-wildfire-smoke-and-environmental
Kaitlin Sundling
Pathologist and physician-scientist
Kaitlin Sundling boosted:
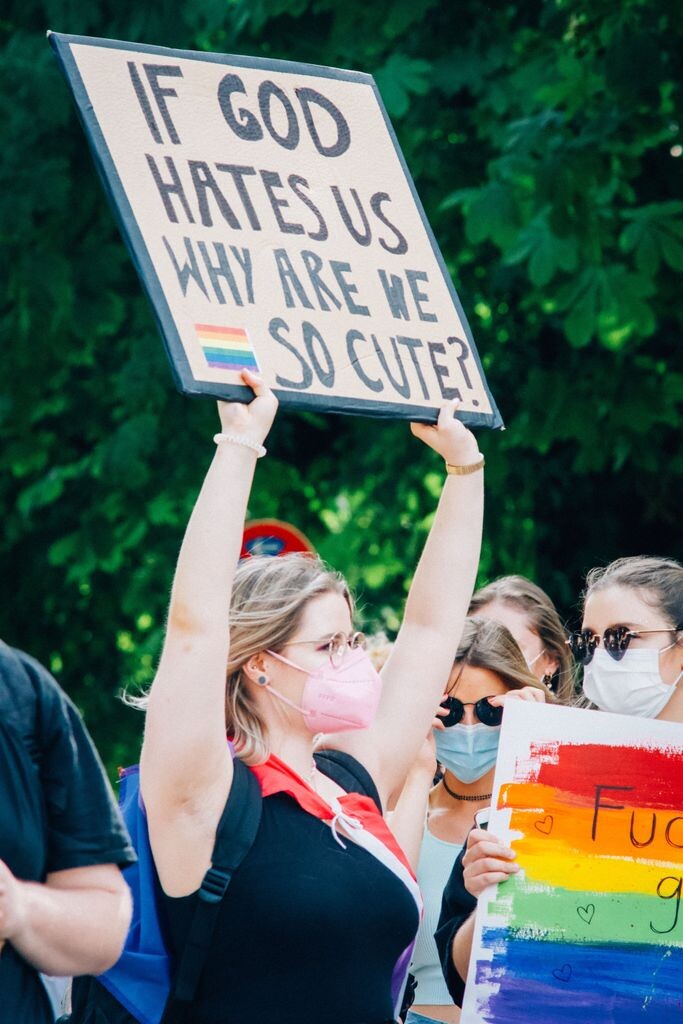
A simple question for all those protestors that waste their time turning up to pride parades 🥰
Kaitlin Sundling boosted:
Due to the smoke
my city’s public health department
advises that if we go outside
we should really “wear
a high quality mask
like an N95 or KN95”
and perhaps more people
would have such masks available
if that department
hadn’t spent months saying
such masks are no longer needed.
Kaitlin Sundling boosted:
This study shows that wearing an N95 respirator reduces exposure to wildfire smoke particles by over 14 times, and reduces hospitalizations by up to 39%. Please wear an N95 respirator mask!
https://agupubs.onlinelibrary.wiley.com/doi/full/10.1029/2021GH000482
Kaitlin Sundling boosted:
Twitter Is a Far-Right Social Network https://www.theatlantic.com/technology/archive/2023/05/elon-musk-ron-desantis-2024-twitter/674149/?utm_source=feed
Kaitlin Sundling boosted:
The People's CDC Weather Report for the week of May 15th is out:
https://peoplescdc.org/2023/05/15/peoples-cdc-covid-19-weather-report-45/
Read for details on how the state heightens its double-standard callousness towards migrants/ asylum seekers, and more!
Kaitlin Sundling boosted:
With the end of the Public Health Emergency, the CDC has removed the #COVID transmission map from their website.
This is how you manufacture the disappearance of a pandemic.
Kaitlin Sundling boosted:
Here's what you get when you go to http://COVIDtransmissionmap.com
This was a shortcut set up to go straight to the CDC's #COVID transmission map (which was already buried on their website to prioritize the misleading Community Levels map).
The case data is now gone.
Kaitlin Sundling boosted:
With the end of the public health emergency, the CDC removed their COVID transmission and community levels maps, and found a way to make their main COVID map even more green: https://covid.cdc.gov/covid-data-tracker/#cases_new-admissions-rate-county
Kaitlin Sundling boosted:
Please, before the week is over,
take a moment
to order more test kits
as of May 11
(when the emergency ends)
Medicare and private insurers
will no longer cover the costs
of those test kits
so take a moment to order more
for the emergency may be ending
but the pandemic endures.
Kaitlin Sundling boosted:
It's unacceptable that some hospitals are now telling patients that they cannot ask staff members to wear a mask. What happened to "do no harm"?
Kaitlin Sundling boosted:
Hey all! This is the @PeoplesCDC weekly update for May 1st! As always, the Weather Report from the People’s CDC sheds light on the COVID situation in the US.
Please be sure to check out the full written report, which includes even more information, clickable links to sources, and translation to Spanish -
https://peoplescdc.org/2023/05/01/peoples-cdc-covid-19-weather-report-43/
1 of 8
#peoplescdc #COVID #COVID19 #COVID19WeatherReport
#longcovid #Pandemic #PandemicIsNotOver
![[Image description 1: Image shows background with shades of light blue and blue colors. White square is centered with text that reads, “5/1/23 Weather Report." Top text reads, "About 78% of US counties experience moderate or higher transmission levels as of April 27."
Text below reads, "This data comes from the CDC's own Transmission Levels map -
which is increasingly unreliable as funding for free PCR tests ends. We recommend you continue to wear a well-fitting N95 mask or equivalent indoors and to fight for Free Access to Tests, Treatments, Vaccines and Data-Collection and Reporting."
Map shows COVID transmission levels/intensity by US county as of April 27, 2023 based on COVID cases per 100,000 population and percent positivity in past 7 days. Low transmission is blue, Moderate is yellow, Substantial is orange, High is red. Transmission is mixed with yellow throughout the country, scattered blue, and Arizona and New Mexico predominantly Red or Orange."
There’s a teal “People’s CDC” icon at the bottom with a teal arrow pointing to the right.]](https://files.mastodon.social/cache/media_attachments/files/110/299/958/140/862/355/original/18d4ac965a38e91c.png)
Reinstate universal masking at UW Health in Wisconsin and Illinois. UW Health dropped masking without notice yesterday, leaving patients scrambling to try to find safer ways to access care. Please join me in urging UW Health to reinstate universal masking. #KeepMasksInHealthCare https://actionnetwork.org/petitions/keep-healthcare-masking-at-uw-health-in-wisconsin-and-illinois
Kaitlin Sundling boosted:
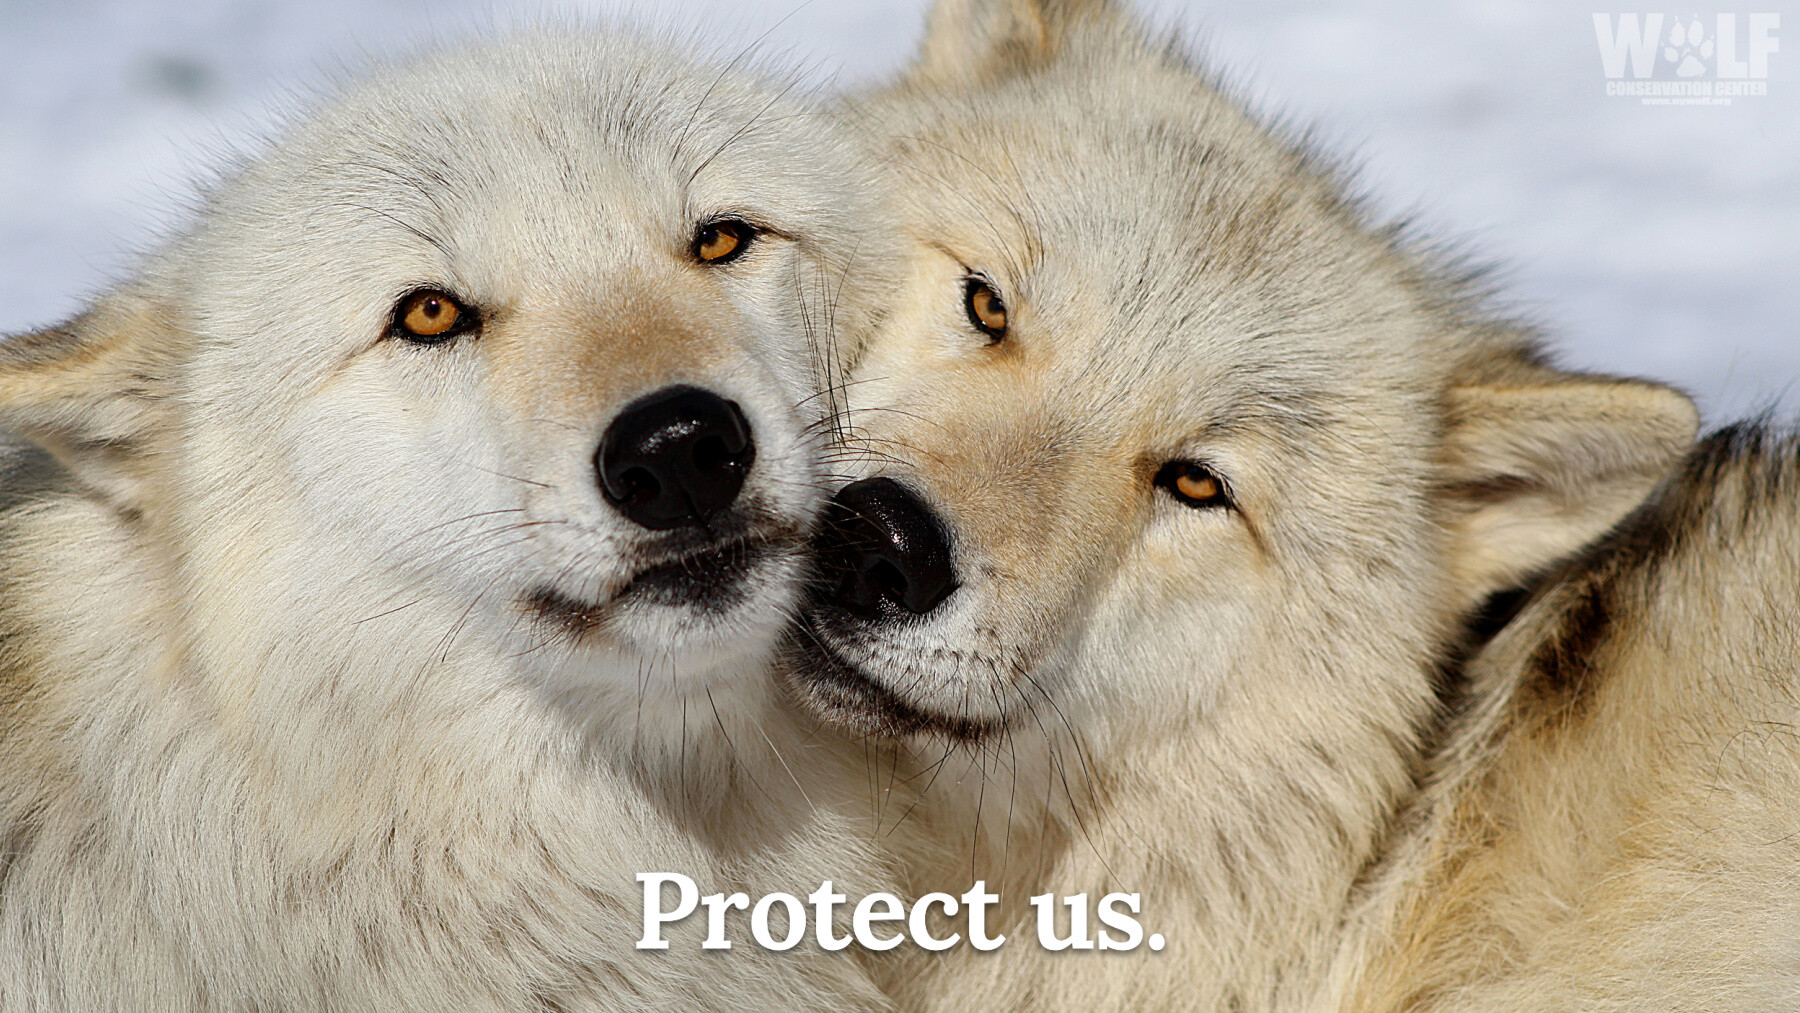
The death toll in Montana's controversial wolf hunt has increased to 254.
It's a sad reality that wolves in Montana face traps, bullets, and snares when they should be focused on the spring arrival of their pups.
Call on the U.S. Department of Interior to prioritize conservation over bloodsport.
Please TAKE ACTION to urge them to enact an emergency listing to protect wolves in the Northern Rockies → https://bit.ly/3XmkAwz
#KeepMasksInHealthcare #KeepMasksInHealthcareWI
As a physician, I support universal masking in healthcare now and in the future. Healthcare settings are particularly risky during the airborne COVID pandemic, and masking is a simple measure to protect vulnerable patients and workers in these settings.
People’s CDC substack post with more information including letter template: https://peoplescdc.substack.com/p/keep-masks-in-healthcare
Kaitlin Sundling boosted:
After so many years in the US and working in a hospital I can confidently say: I don't understand the system
Kaitlin Sundling boosted:
If you cannot
smell the flowers
they have given to you
or taste the chocolates
from the big red box
it is probably wise
for you
to cancel your dinner reservation.
Kaitlin Sundling boosted:
People’s CDC COVID-19 Weather Report https://peoplescdc.org/2023/02/13/peoples-cdc-covid-19-weather-report-34/
University of Wisconsin's ASM Student Council passed COVID legislation supporting improved COVID protections on campus. The proposed measures would improve the situation on campus significantly. Thanks to the ASM student representatives for their leadership! https://badgerherald.com/news/2023/02/10/asm-passes-covid-19-legislation-discusses-masking-requirements/ #CovidIsNotOver #vaxplus #COVIDisAirborne
Please send letters and share this campaign to tell your elected officials to maintain our public health emergencies and provide basic COVID protections. https://peoplescdc.substack.com/p/tell-elected-reps-maintain-the-state #CovidIsNotOver @PeoplesCDC
Client Info
Server: https://mastodon.social
Version: 2025.04
Repository: https://github.com/cyevgeniy/lmst