Das ist doch mal ein guter Start in den heutigen Tag …
#ElectricityMaps #goodnews #Energiewende
#Electricitymaps
Discover real-time electricity insights with the #ElectricityMaps app!
Live 24/7 CO₂ emissions of electricity consumption
https://app.electricitymaps.com/zone/DE/72h/2025-04-26T14:00:00.000Z#bar_breakdown_chart
> Electricity Maps is a live 24/7 visualization of where your electricity comes from and how much CO2 was emitted to produce it.
Release v1.235.0
#ElectricityMaps
Nice!
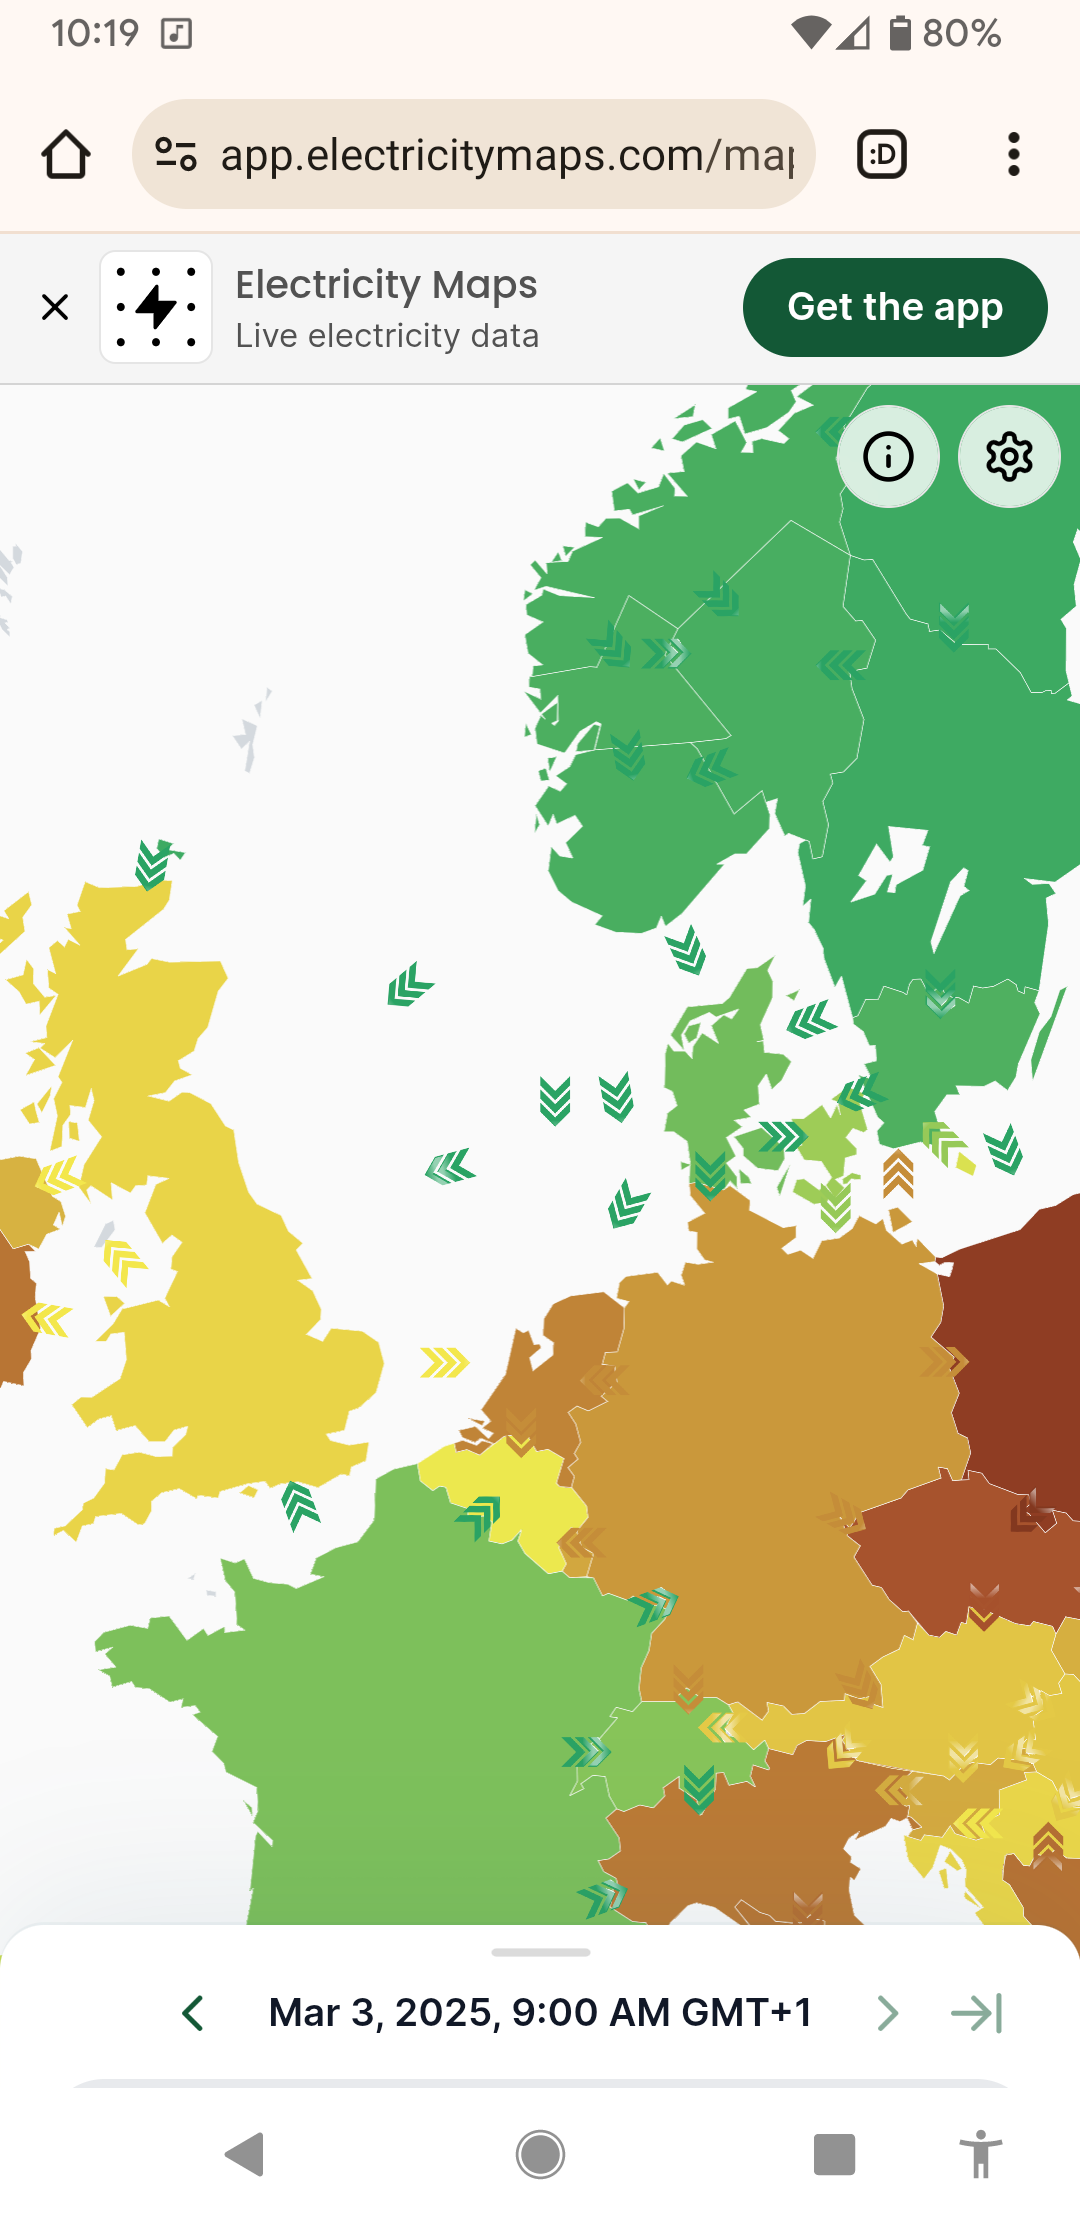
How renewable is the electricity where you are? At this very moment?
https://app.electricitymaps.com/map/72h/hourly
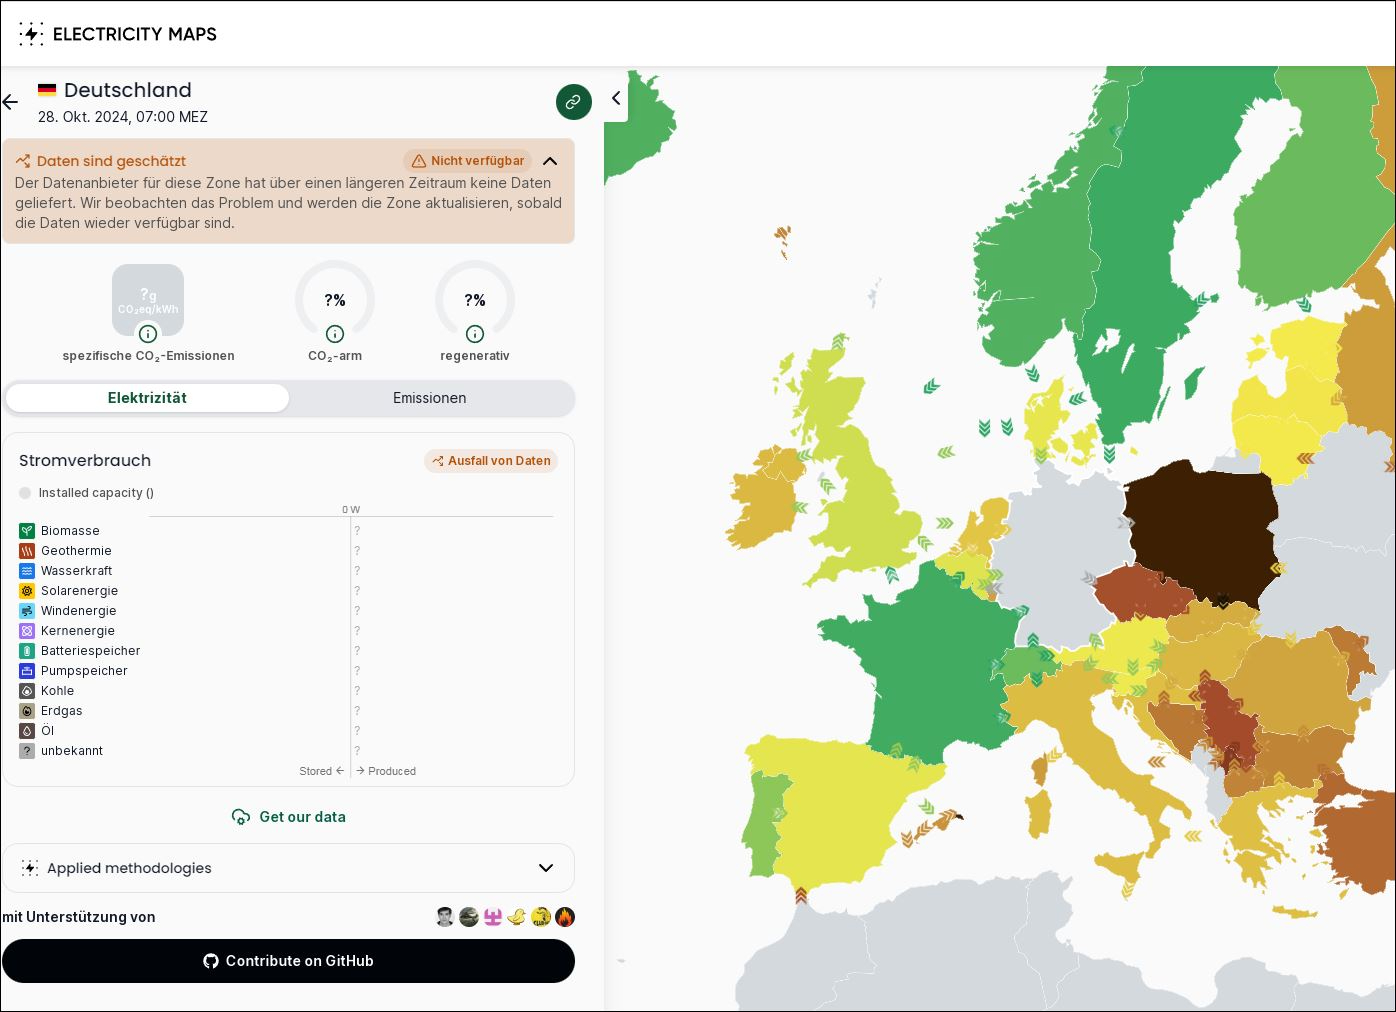
Meine täglichen Berichte über die (EE)-Stromerzeugung setze ich vorübergehend aus, da die von mir verwendeten Datenquellen zur Zeit offenbar selbst Schwierigkeiten haben, aktuelle Daten zu bekommen. Sowohl #ElectricityMaps (siehe unten)... 1/2
Kannte ich noch nicht. Super informative Visualisierung der Stromflüsse. z.B. für Europa
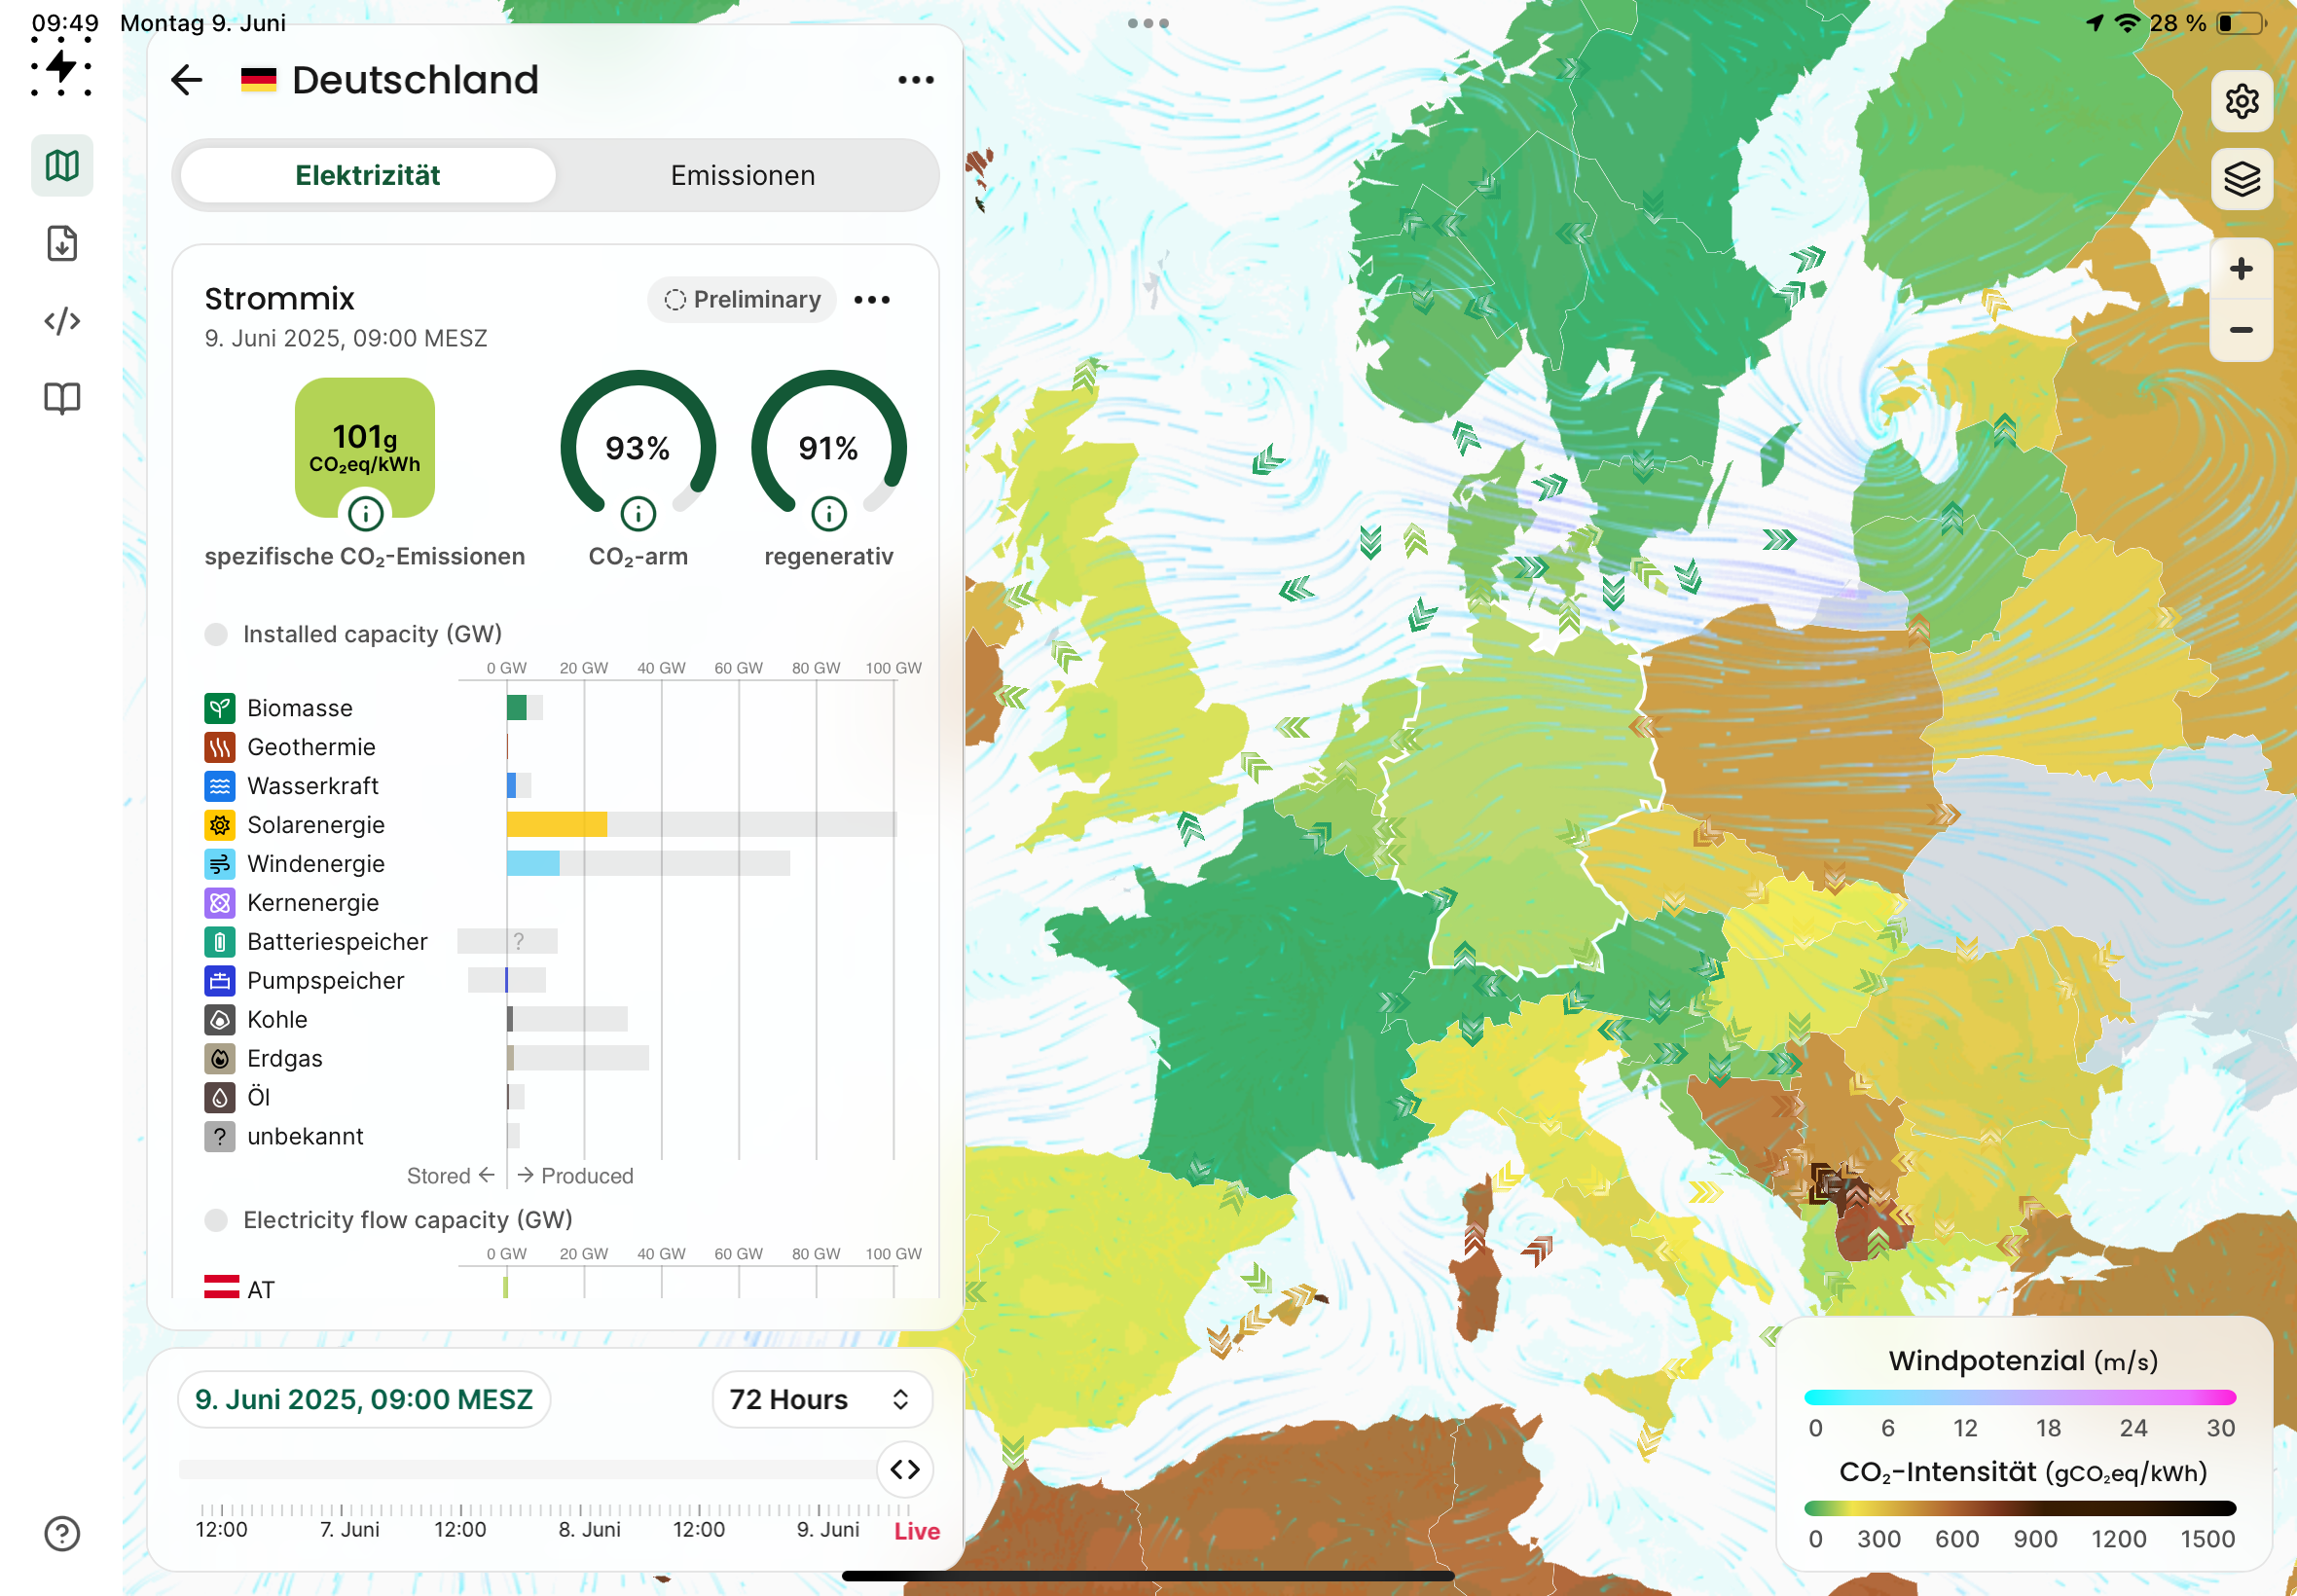
@DieFurie Stromerzeugung Deutschland vor paar Stunden: 86% regenerativ. #ElectricityMaps
@daswarkeinhuhn Das ist auch mit den Zahlen von #electricitymaps. Beachten: Atomstrom wird hierbei wohl etwas schöngefärbt berechnet...
@Gehtso @prefec2 @SoliSolar @balkonsolar
Hier eine Erläuterung, warum die Zahlen von #ElectricityMaps etwas atom-gefärbt sein könnten:
@Gehtso @prefec2 @SoliSolar @balkonsolar
#electricitymaps rechnet mit fehlerbehafteten Zahlen. THG-Emissionen von Atomstrom werden z.B. mit 5g/kWh bewertet, egal wo das Kraftwerk steht.
Bei Kohle und Gas wird je nach Land unterschiedlich gerechnet.
Die Initiatoren sind aus Frankreich…
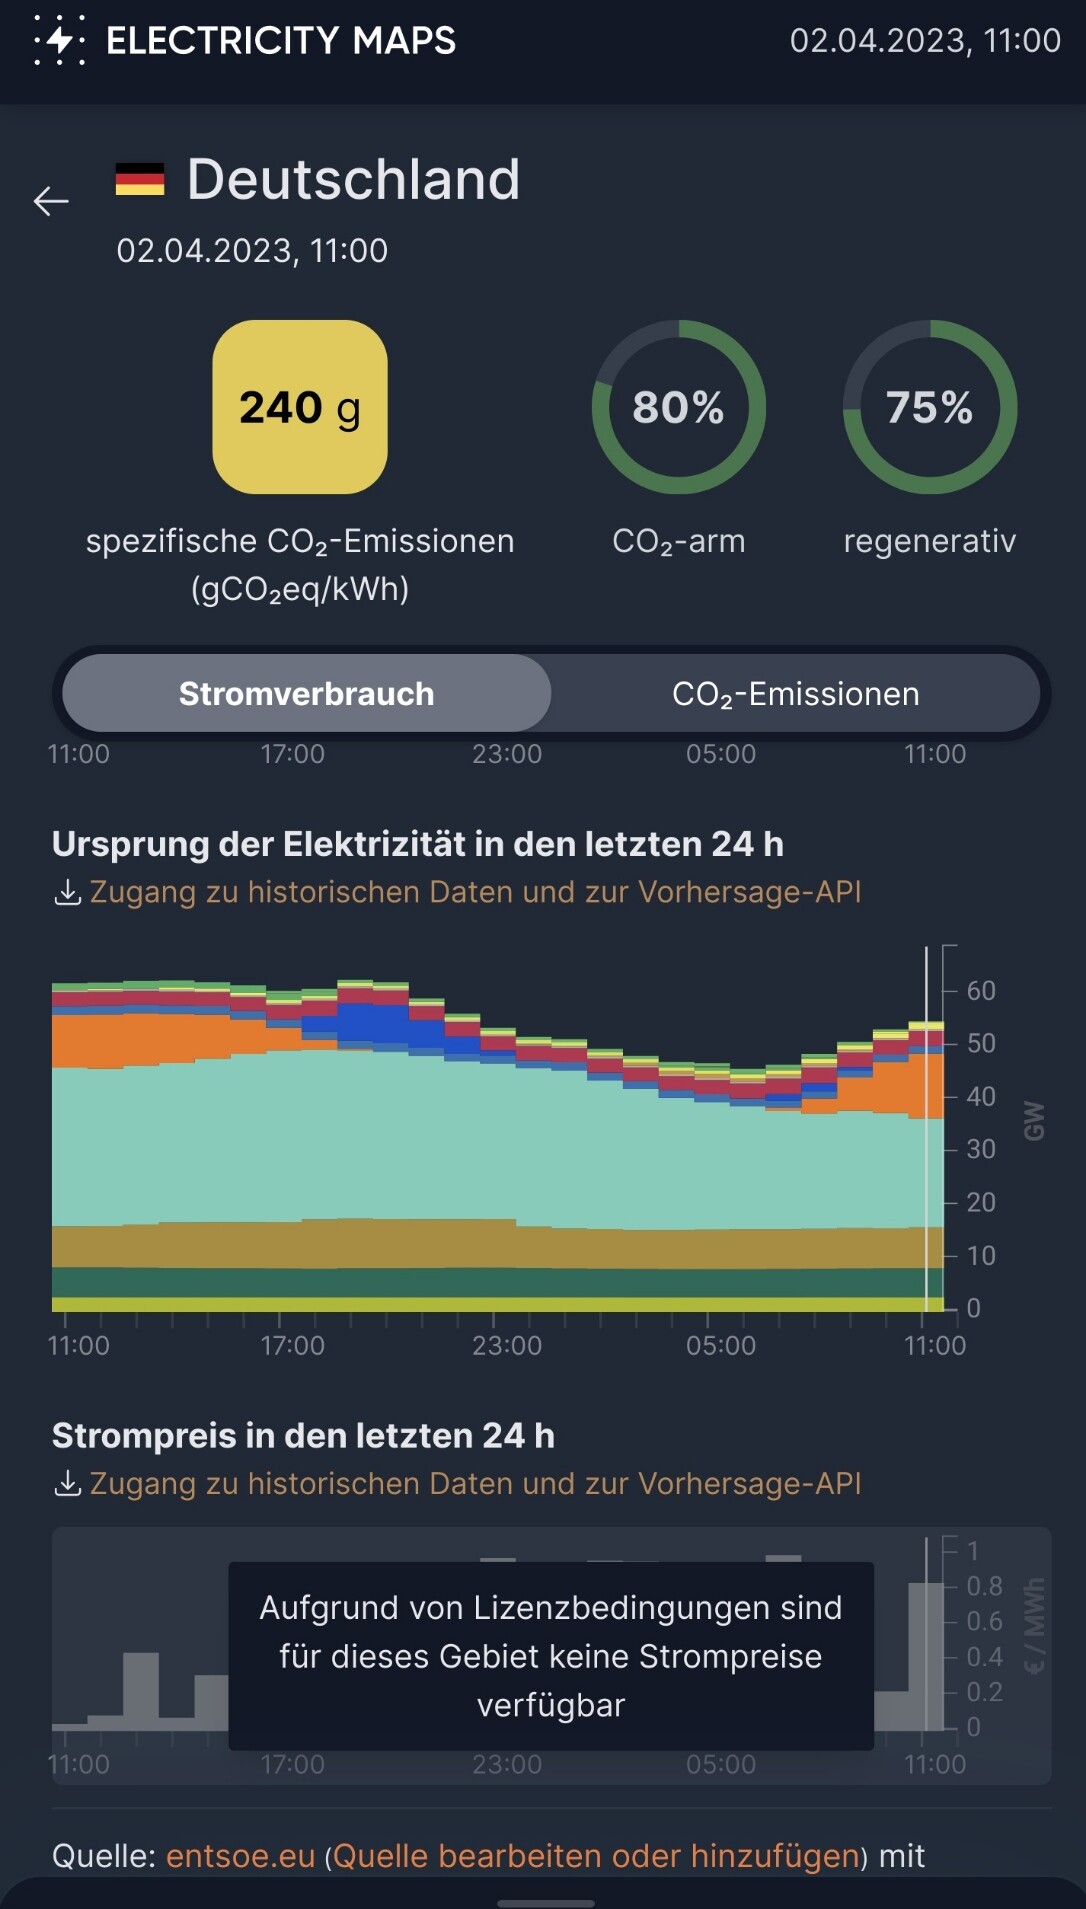
Aha. Bei #Electricitymaps kann man sich die #Strompreise für Deutschland nicht mehr anzeigen lassen. Man soll wohl nicht mitbekommen, wie billig der viele Windstrom ist.🤨
The Electricity Maps app provides real-time insights on web and mobile for citizens, energy experts, NGOs and policymakers promoting a deeper understanding of energy transition challenges.
11.03.2023, 12:00 in Deutschland
https://app.electricitymaps.com/zone/DE
#electricitymaps.com #Windenergie #Solarenergie #Kohlestrom #nur mal so
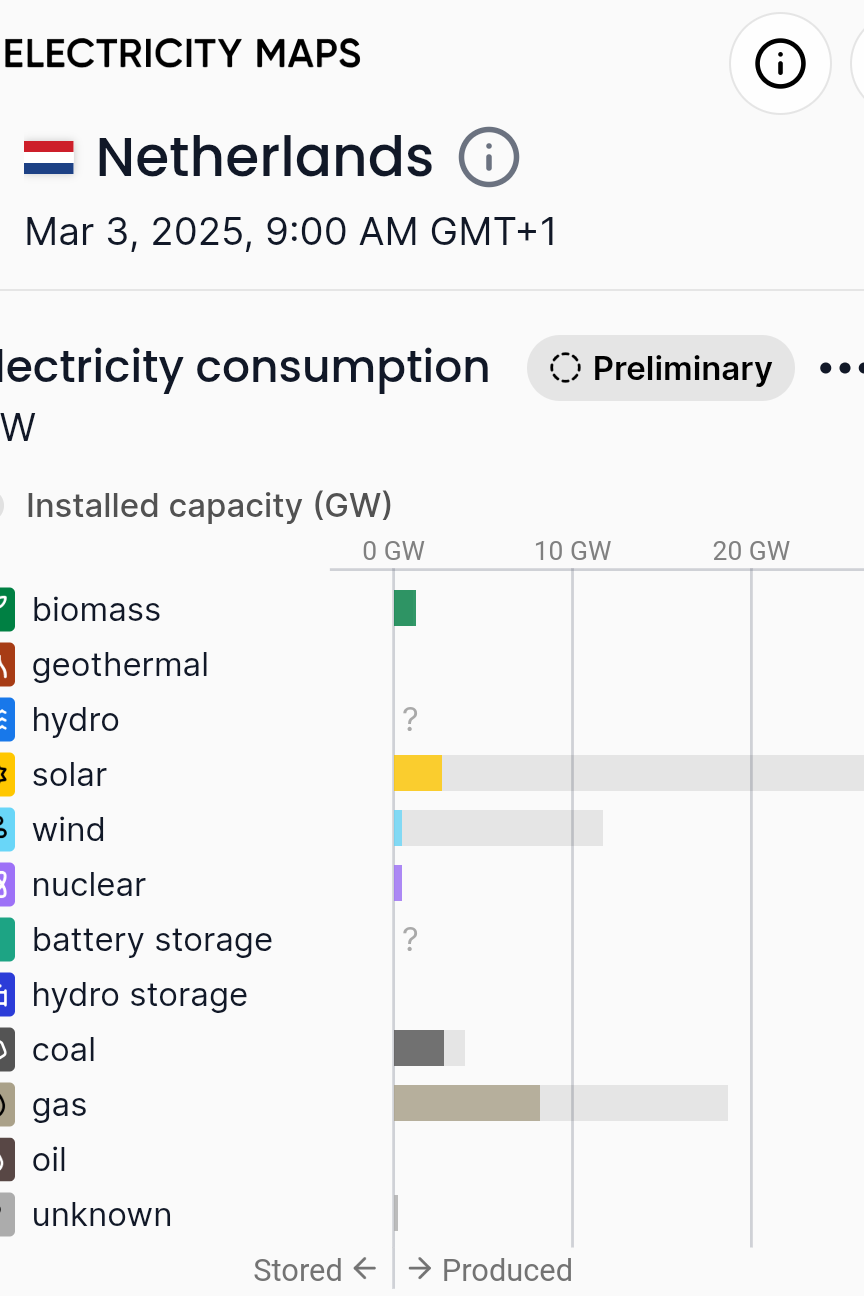
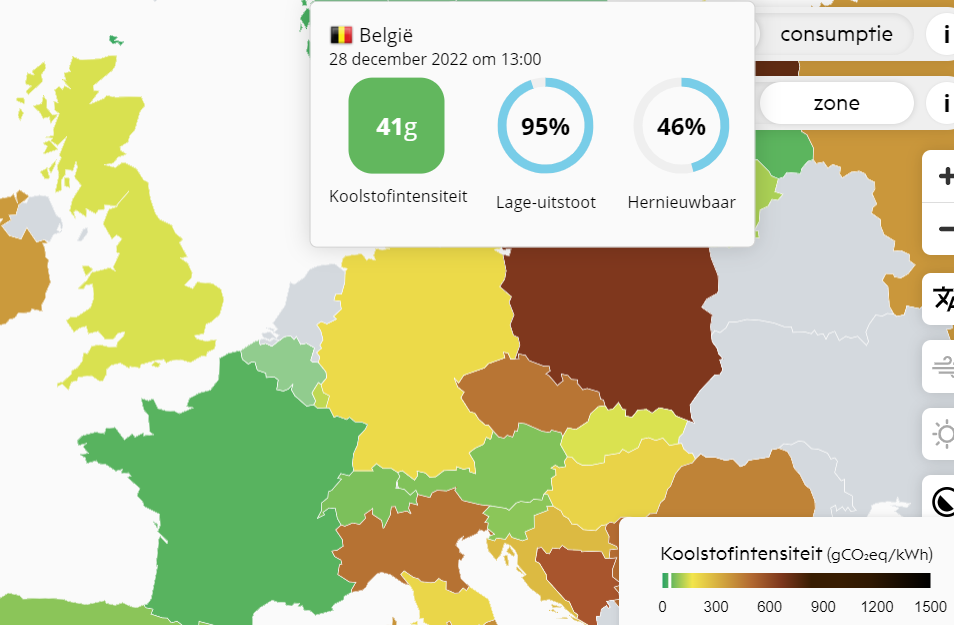
't is een momentopname, zoals meestal bij het delen van #ElectricityMaps ;-), maar momenteel wordt er #elektriciteit geproduceerd in België aan slechts 41g CO₂eq per kWh, met ongeveer de helft uit wind en de helft uit kern.
Client Info
Server: https://mastodon.social
Version: 2025.04
Repository: https://github.com/cyevgeniy/lmst