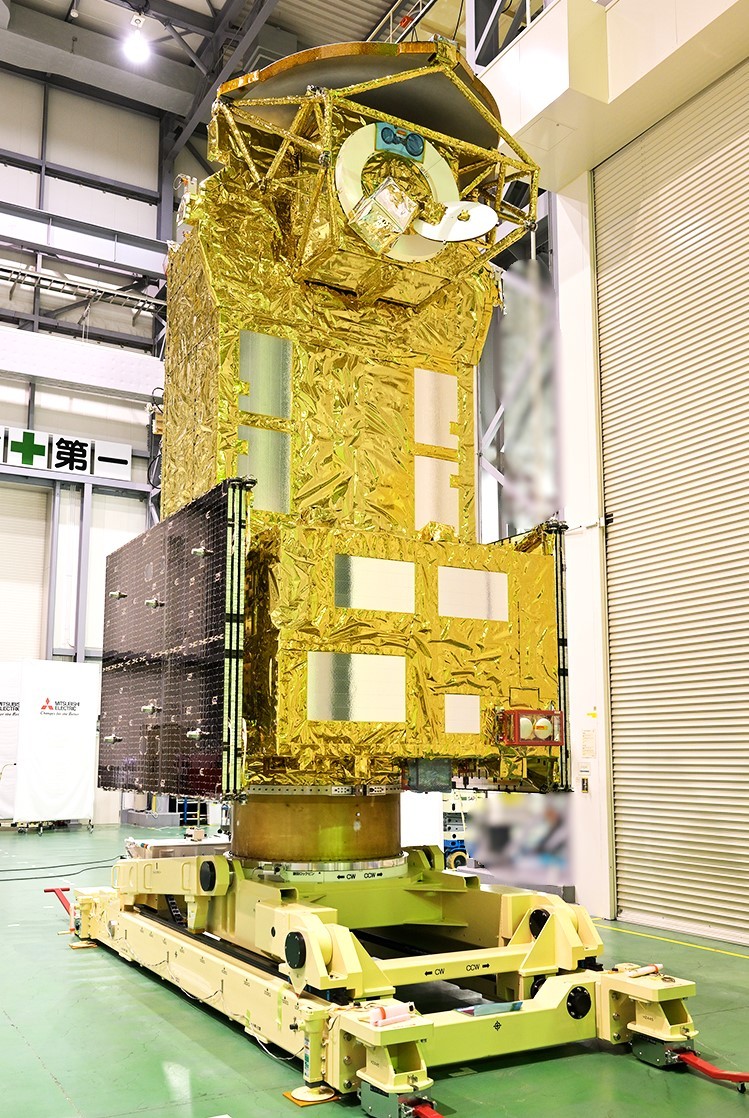
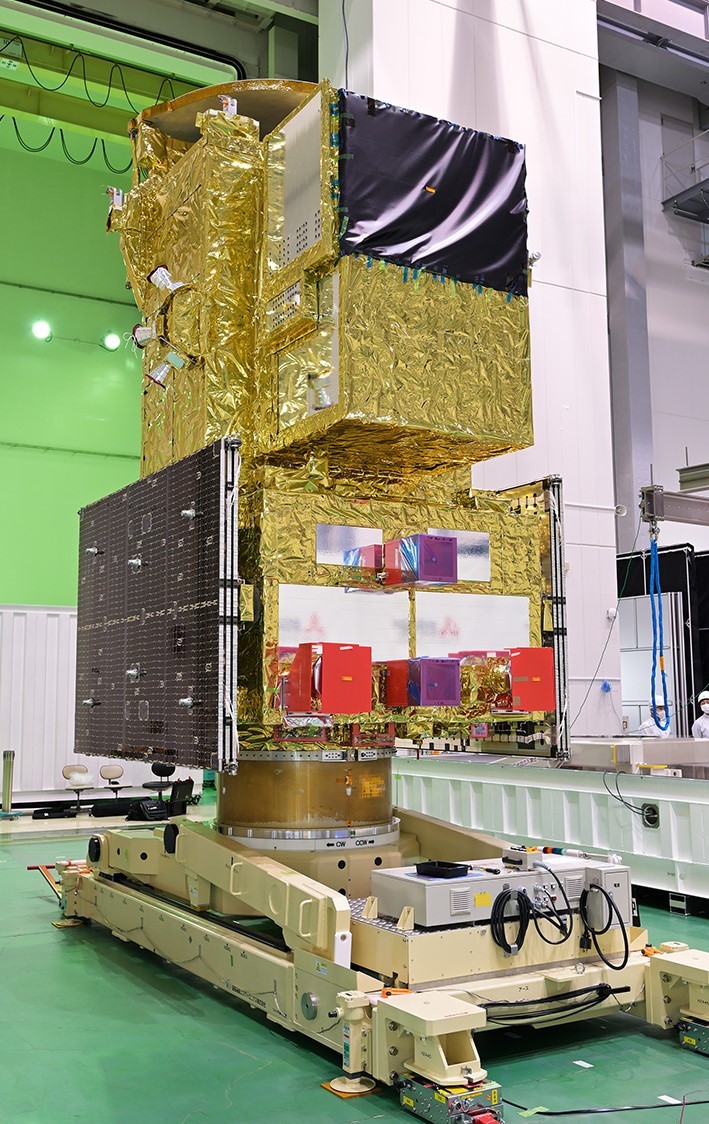
🛰️ #GOSAT-GW, le satellite japonais pour l'étude des gaz à effet de serre et du cycle de l'eau, vient de partir de chez Mitsubishi (📷) pour rejoindre le site de lancement de Tanegashima.
Décollage à bord de la dernière HII-A prévu le 23 juin
#GOSAT
環境問題にデザインからアプローチ! COP29で展示される「GOSAT(いぶき)」の温室効果ガス濃度3D可視化プロジェクトはなぜ立ち上がったか【環境省×バスキュール×Tellusの3者インタビュー】
https://sorabatake.jp/38706/
地球温暖化が進行し、気候変動に関する報告書や宇宙会議で警鐘が鳴らされています。GOSATプロジェクトが温室効果ガスデータを視覚化し、環境問題に取り組むきっかけを提供しています。 #地球温暖化 #気候変動 #GOSAT
Measuring #methane from space only began in 2009 with the launch of the Greenhouse Gases Observing Satellite, or #GOSAT, by Japan’s Aerospace Exploration Agency.
Previously, most of the world’s methane detectors were on the ground in North America.
GOSAT enabled scientists to develop a more geographically diverse understanding of major sources of methane to the atmosphere.
Soon after, the Environmental Defense Fund, which led the development of #MethaneSAT, began campaigning for better data on methane emissions.
Through its own, on-the-ground measurements, the group discovered that the Environmental Protection Agency’s estimates of leaks from U.S. oil and gas operations were totally off.
EDF took this as a call to action. Because methane has such a strong warming effect, but also breaks down after about a decade in the atmosphere, curbing methane emissions can slow warming in the near-term.
“Some call it the low hanging fruit,” Steven Hamburg, the chief scientist at EDF leading the MethaneSAT project, said during a press conference on Friday. “I like to call it the fruit lying on the ground. We can really reduce those emissions and we can do it rapidly and see the benefits.”
But in order to do that, we need a much better picture than what GOSAT or other satellites like it can provide.
In the years since GOSAT launched, the field of methane monitoring has exploded.
Today, there are two broad categories of methane instruments in space.
#Area #flux #mappers, like GOSAT, take global snapshots. They can show where methane concentrations are generally higher, and even identify exceptionally large leaks — so-called “ultra-emitters.” But the vast majority of leaks, big and small, are invisible to these instruments.
Each pixel in a GOSAT image is 10 kilometers wide. Most of the time, there’s no way to zoom into the picture and see which facilities are responsible.
#Point #source #imagers, on the other hand, take much smaller photos that have much finer resolution, with pixel sizes down to just a few meters wide. That means they provide geographically limited data — they have to be programmed to aim their lenses at very specific targets. But within each image is much more actionable data.
But between this extremely wide-angle lens, and the many finely-tuned instruments pointing at specific targets, there’s a gap.
“It might seem like there’s a lot of instruments in space, but we don’t have the kind of coverage that we need yet, believe it or not,” Andrew Thorpe, a research technologist at NASA’s Jet Propulsion Laboratory told me. He has been working with the nonprofit #Carbon #Mapper on a new constellation of point source imagers, the first of which is supposed to launch later this yearhand, take much smaller photos that have much finer resolution, with pixel sizes down to just a few meters wide.
That means they provide geographically limited data — they have to be programmed to aim their lenses at very specific targets. But within each image is much more actionable data.
For example, #GHGSat, a private company based in Canada, operates a constellation of 12 point-source satellites, each one about the size of a microwave oven. Oil and gas companies and government agencies pay GHGSat to help them identify facilities that are leaking.
Jean-Francois Gauthier, the director of business development at GHGSat, told me that each image taken by one of their satellites is 12 kilometers wide, but the resolution for each pixel is 25 meters.
A snapshot of the Permian Basin, a major oil and gas producing region in Texas, might contain hundreds of oil and gas wells, owned by a multitude of companies, but GHGSat can tell them apart and assign responsibility.
“We’ll see five, 10, 15, 20 different sites emitting at the same time and you can differentiate between them,” said Gauthier.
“You can see them very distinctly on the map and be able to say, alright, that’s an unlit flare, and you can tell which company it is, too.”
Similarly, GHGSat can look at a sprawling petrochemical complex and identify the exact tank or pipe that has sprung a leak.
But between this extremely wide-angle lens, and the many finely-tuned instruments pointing at specific targets, there’s a gap. “It might seem like there’s a lot of instruments in space, but we don’t have the kind of coverage that we need yet, believe it or not,” Andrew Thorpe, a research technologist at NASA’s Jet Propulsion Laboratory told me.
He has been working with the nonprofit #Carbon #Mapper on a new constellation of point source imagers, the first of which is supposed to launch later this year
https://heatmap.news/technology/methanesat-edf-satellite-gosat
"Universität Bremen: Treibhausgas-Konzentrationen auch 2022 stark gestiegen"
"Vorläufige Analysen globaler Satellitendaten .. zeigen: .. Konzentrationen der beiden wichtigen Treibhausgase .. CO2 + CH4 sind auch in 2022 weiter stark angestiegen. .. Eine Pressemitteilung der Universität Bremen."
#Erdbeobachtung #Fernerkundung #Raumfahrt #Satelliten #CH4 #CO2 #Copernicus #Envisat #ESA #GOSAT #GOSAT2 #IUP #Klimawandel #Klimakrise #Methan #OCO2 #SCIAMACHY #Treibhauseffekt
Client Info
Server: https://mastodon.social
Version: 2025.04
Repository: https://github.com/cyevgeniy/lmst