
In November 2025, the #SeaIce global extent was 8.7% below 1991-2020 mean. Since the beginning of records (1978):
- #Arctic, 2nd lowest monthly mean, with 11.7% less extent than normal (-1,198,440km²)
- #Antarctic, 4th lowest monthly mean, with 7.3% less extent than normal (-1,188,737 km²)
more: https://osi-saf.eumetsat.int/sea-ice-index
#ClimateChange #OSISAF @eumetsat
#OSISAF


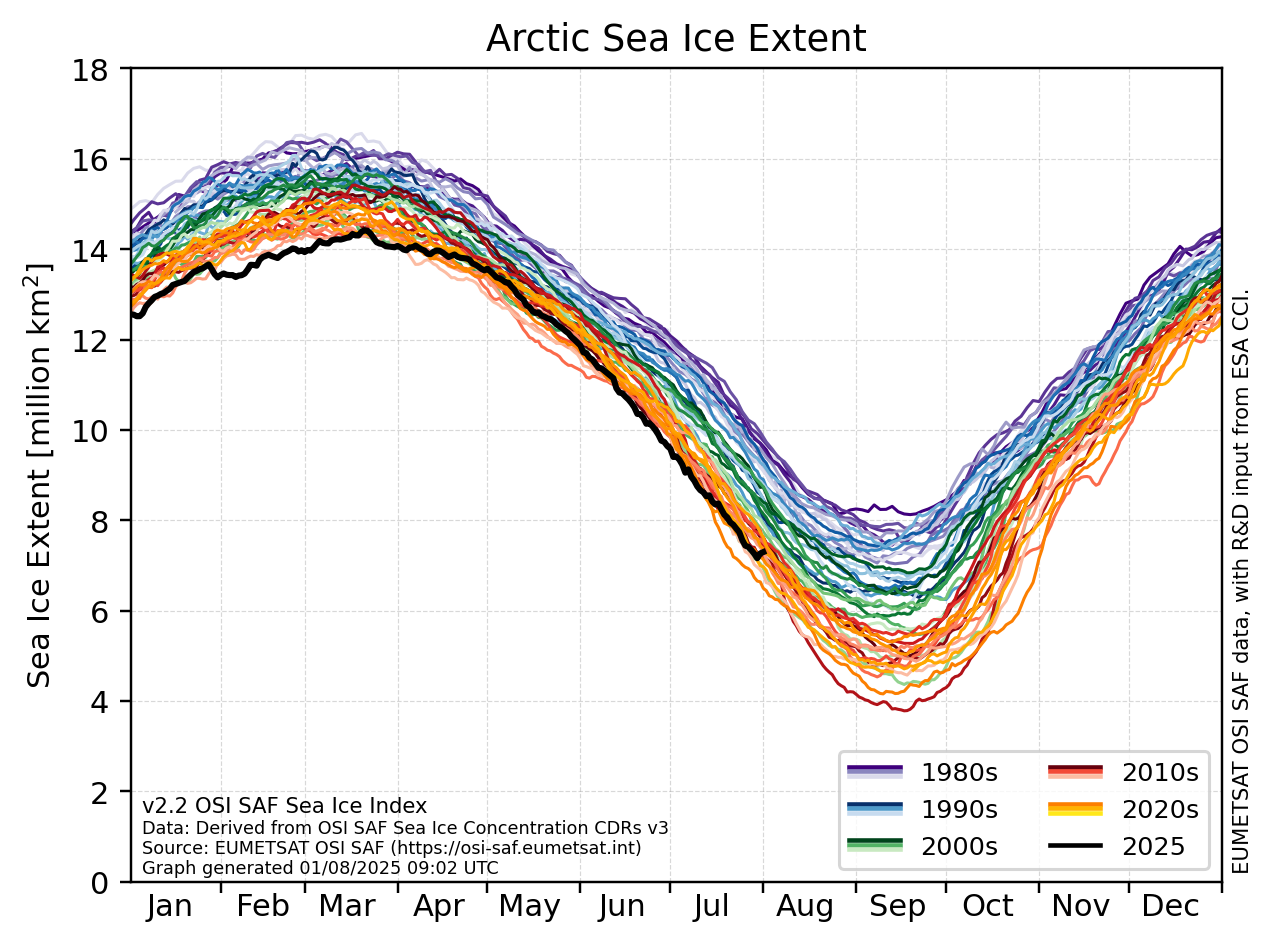
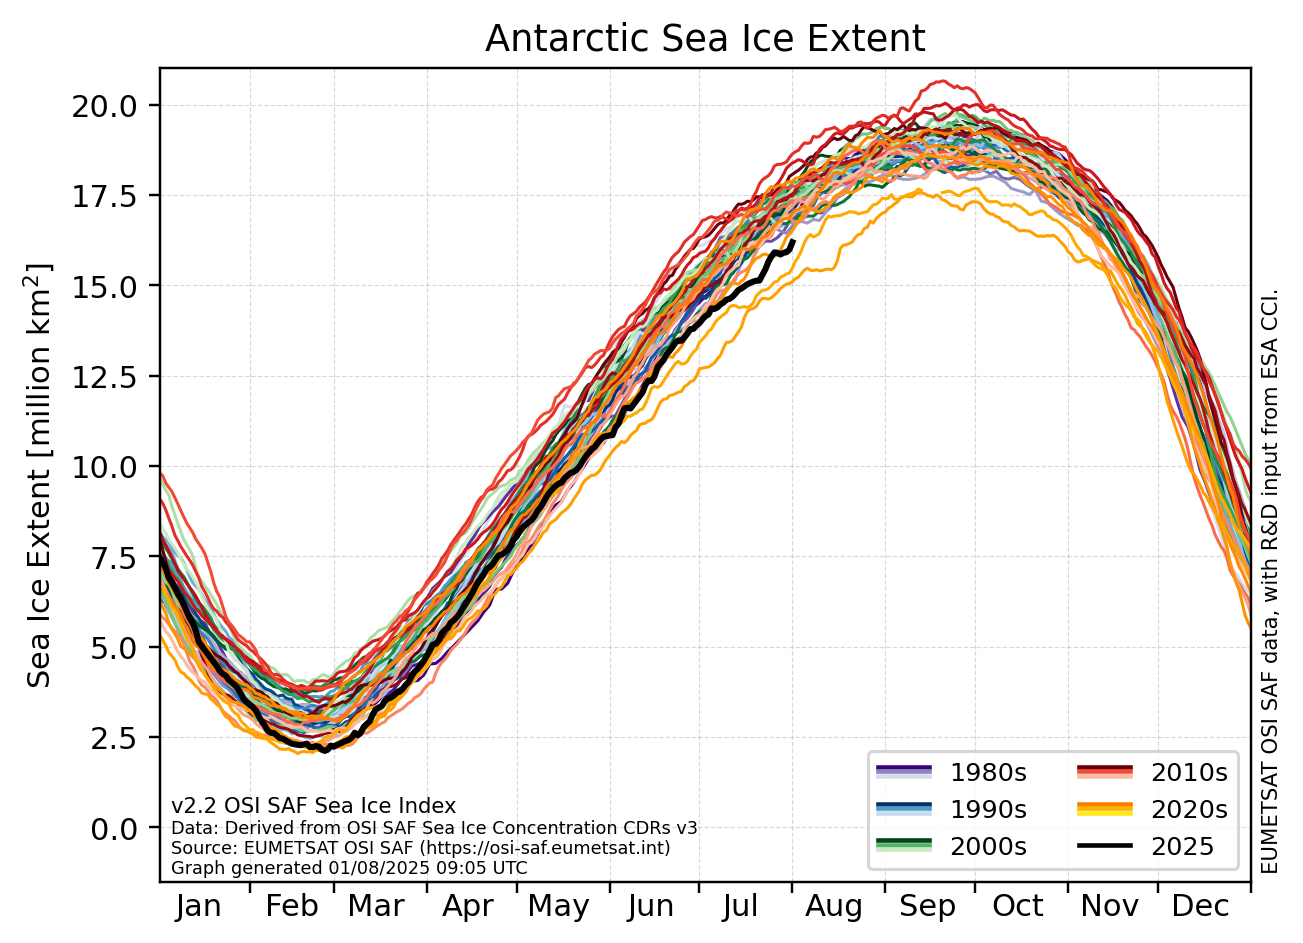
In August 2025, the #SeaIce global extent was 8.4% below 1991-2020 mean. Since the beginning of records (November 1978):
- #Arctic, 8th lowest monthly mean, with 12,2% less extent than normal (-823 904km²)
- #Antarctic, 3rd lowest monthly mean, with 6.9% less exent than normal (-1 264 062km²)


Like for the MSG product, the MTG product is a level 3, hourly, sub-skin Sea Surface Temperature derived from Meteosat at 0° longitude, covering 60S-60N and 60W-60E and re-projected on a 0.05° regular grid, in GHRSST compliant netCDF format.
The MTG product benefits from the higher temporal and spatial resolution of MTG, but the output files have the same temporal and spatial sampling as the MSG product.
In July 2025, the #SeaIce global extent was 8.9% below 1991-2020 mean. Since the beginning of records (1978):
- #Arctic, 4th lowest monthly mean, with 9.9% less extent than normal (-906.931 km²)
- #Antarctic, 3rd lowest monthly mean, with 8.3% less exent than normal (-1.363.243 km²)
For more: https://osisaf-hl.met.no/v2p2-sea-ice-index
#ClimateChange #OSISAF @eumetsat
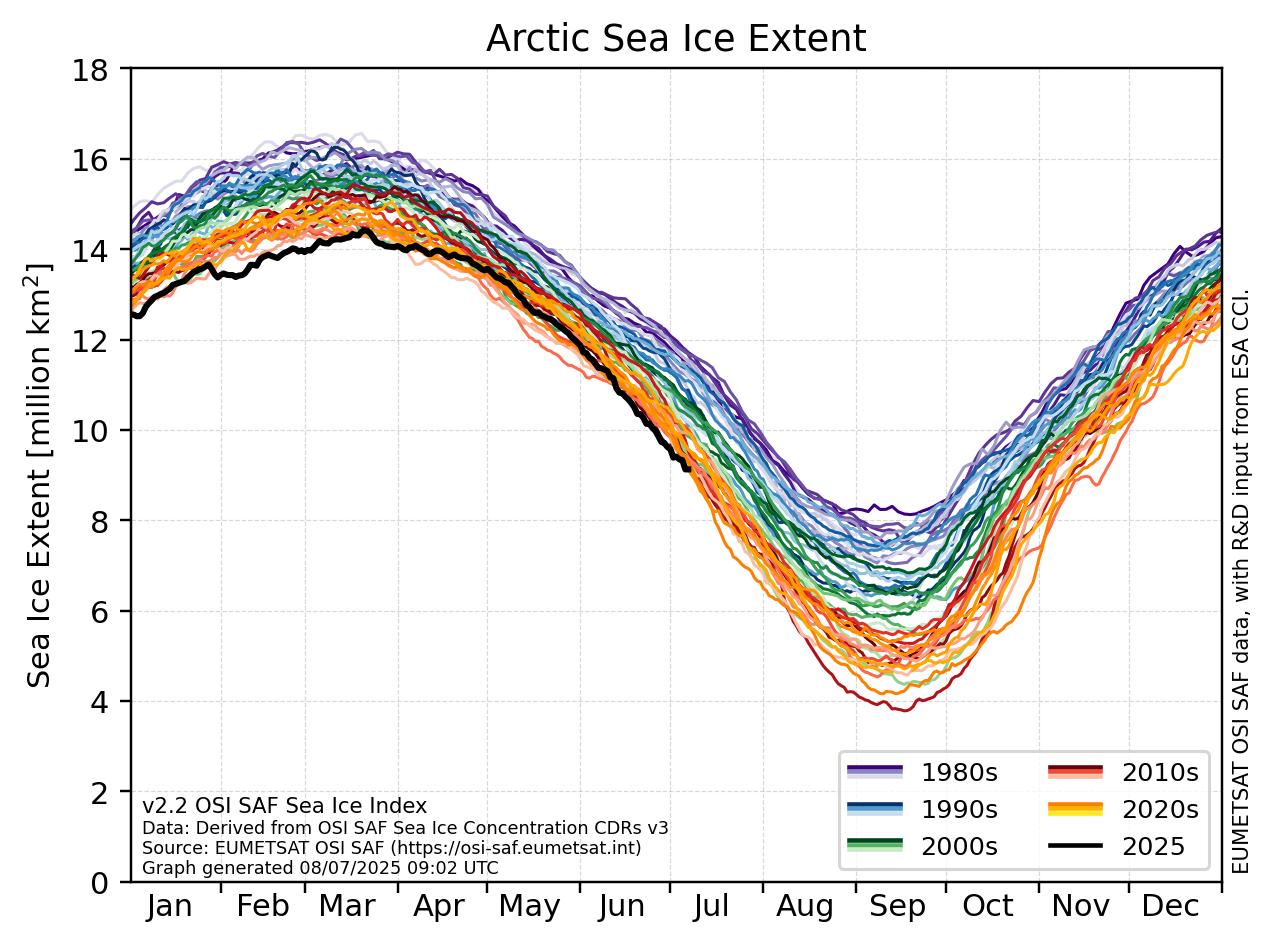
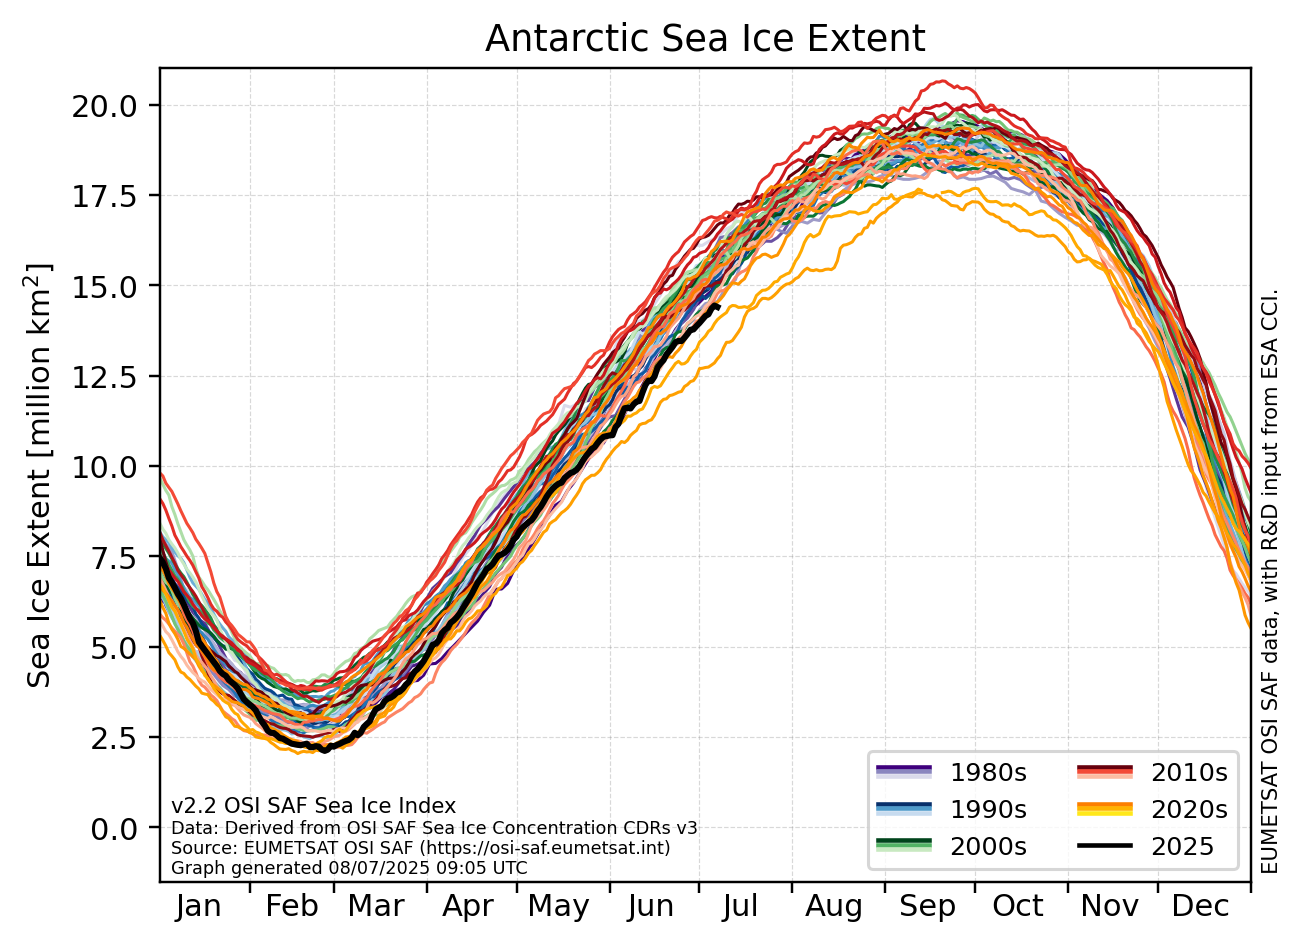
In June 2025, the #SeaIce global extent was 7.9% below 1991-2020 mean. Since the begining of record (november 1978):
- #Arctic, 2th lowest June monthly mean, with 6.4% less extent than normal (-733 404km²)
- #Antarctic, 3th lowest June monthly mean, with 9.1% less exent than normal (-1 255 507km²)

We have never measured so little #SeaIce around #Svalbard #Norway in mid November.
The #OSISAF satellite-based timeseries goes back to the late 1970s.

What an almost pleasant behavior of the global sea-ice extent
- almost reaching the bottom line (=previous minimum extents) from below.
Source: #OSISAF
The ocean sector offshore of Queen Maud Land in #Antarctic lacks about 1 million km² of sea-ice cover compared to normal conditions.
The sea-ice extent has been dropping fast the recent days...📉
Source: #OSISAF

The ***slower freeze-up of Arctic sea ice*** is also seen in the time series of the sea-ice extent which at present is the 7th-lowest for this time of year and far below the climatology 1981-2010.
Source: #OSISAF sea-ice index v2.2
Halfway through October 2023, the freeze-up of sea ice is slower (or simply just lower) than normal.
By "normal", is meant the 30-year climatology of the same days in 1981-2010.
Source: #OSISAF sea-ice concentration v3.0

Global sea-ice extent ranked by month.
Do you see a pattern for the recent years (=bottom of the figure)? 🧐
Source: #OSISAF sea-ice index v2.2.
The whole thread is worth reading, but the discussion below about #SeaIce datasets and #Osisaf is very interesting for those of us who run and/or use #CimateModels for the #Arctic....
Antarctic sea-ice extent has started to decrease after an extremely low winter maximum. Let's hope for a really slow decrease at least🤞
Source: #OSISAF
Today left yesterday (that is Sept 17th) as the "so far" minimum #Arctic #seaice extent for 2023.
A minimum at this stage would result in the sixth-lowest minimum extent on record.
Not record-low, but far lower than most years.
Let's see what tomorrow brings.
Source: #OSISAF
For a week, September 12th has marked the date with the largest #Antarctic #seaice extent in 2023.
This is absolutely record-low for an Antarctic maximum extent!
This still can change and we hope it will 🤞
Source: #OSISAF Sea Ice Index v2.2
Has the #Antarctic #seaice stopped growing in extent this winter?
Source: #OSISAF

Negligible differences when calculating latitude in two different ways.
As we approach the annual minimum of #Arctic #seaice extent for 2023, it looks like it will be one of the six lowest on record.
To put it in perspective, the years with lower minimums than this year (in order from lowest to highest) are 2012, 2020, 2007, 2016, and 2019.
Source: #OSISAF Sea Ice Index v2.2
Status of the areal coverage of sea ice in #Arctic:
* 3rd lowest in East Siberian Sea (only 2007 and 2012 were lower).
* All "normal" in Laptev Sea.
The graphs show the daily sea-ice extent of 2023 compared with the 1981-2010 baseline and the previous six years 2017-2022.
Source: #OSISAF
Client Info
Server: https://mastodon.social
Version: 2025.07
Repository: https://github.com/cyevgeniy/lmst