#US: Sign a public comment urging protection of the #Arctic : Tell the administration not to strip protections from the Reserve:
https://act.defenders.org/page/84919/action/1
(via Defenders of #Wildlife ) #biodiversity
#Arctic
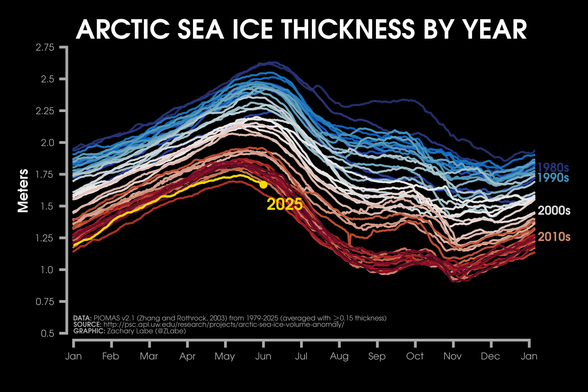
Color is used in this graph to help reveal the obvious long-term declining trend in the average thickness of #Arctic sea ice. We need more resources and data to understand all of the consequences of Arctic change.
Data is updated through the end of May 2025. More graphics at: https://zacklabe.com/arctic-sea-ice-volumethickness/
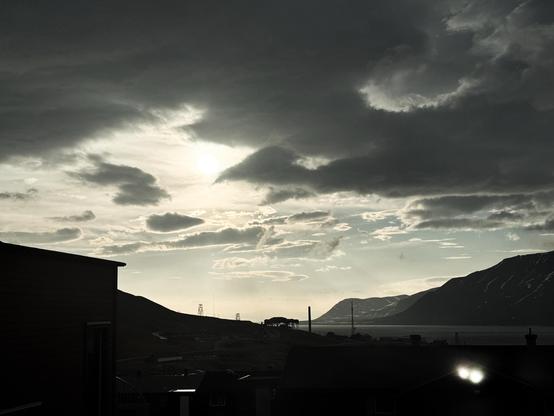
A land of grim darkness that has no night. Captured from a realm of sublime contradiction, my "Midnight in the Shadow World".
#art #photography #sky #skyscape #midnightsun #Svalbard #Arctic #HighArctic #landscape #sublimelandscape
Apart from typical forest fires that consume surface vegetation, many high-latitude fires burn through peat, the dense, carbon-rich layers of partially decayed organic material. Despite covering only 3% of the terrestrial surface, peatlands are one of the world’s most important carbon storage environments, containing around 25% of the carbon existing in the Earth’s soils
https://theconversation.com/how-high-latitude-peat-and-forest-fires-could-shape-the-future-of-earths-climate-258721
#Arctic #ClimateChange #GlobalWarming #IrreversibleOverheating #UpheavalClimate #environment #climate
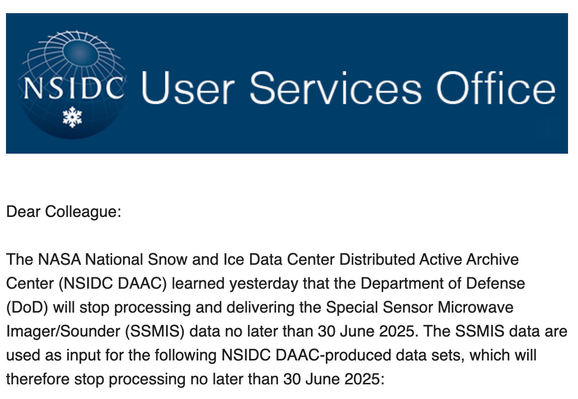
Very bad Arctic news. U.S. will cease delivery of the underlying data feeding sea ice analysis in the next fews days. Previously it was announced that data flow would end in late September, so work on alternatives has started, but global sea ice monitoring will be operating in degraded mode for some time to come. #akwx #Arctic #SeaIce @Climatologist49
Previously the loss of SSMIS data was expected to happen at the end of September. So while work on alternatives has started, sea ice monitoring will be degraded for some time to come. #Arctic #SeaIce #akwx
RE: https://bsky.app/profile/did:plc:nipoqrw2c5olbwkhy3bqxkiy/post/3lsheemdwds2z
Meanwhile #Arctic sea-ice extent is currently the lowest on record for today's date. The melt season has only just started, and we need all of the observational data we can get. Not less.
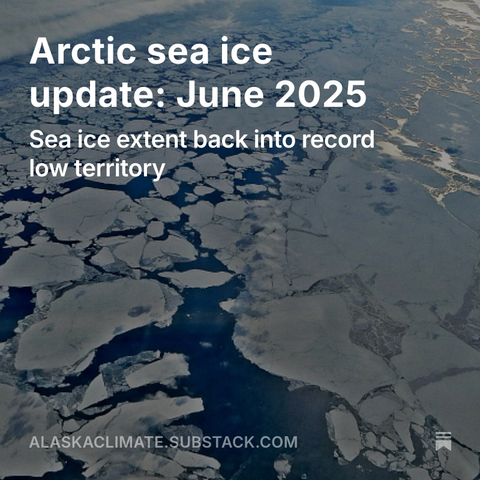
Arctic sea ice extent is back at record low levels for the time of year. A quick overview in the latest from the Alaska and Arctic Climate newsletter. #akwx #Arctic alaskaclimate.substack.com/p/arctic-sea...
Arctic sea ice extent is back at record low levels for this time of year. Quick overview on the latest from the Alaska and Arctic Climate newsletter. @ZLabe @Climatologist49
https://alaskaclimate.substack.com/p/arctic-sea-ice-update-june-2025
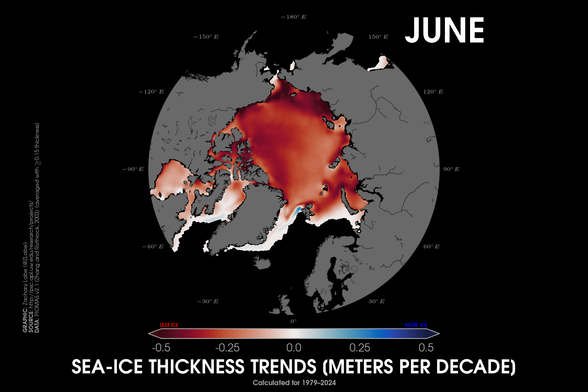
Trends in June sea ice thickness across the #Arctic Ocean - red shading corresponds to areas of thinning ice over the last few decades. The largest declines are in the East Siberian Sea and Chukchi Sea regions.
Simulated data by PIOMAS; https://doi.org/10.1175/JCLI-D-17-0436.1
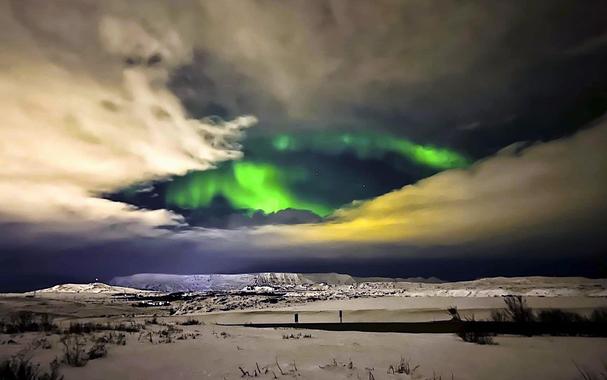
The Northern Lights would be better if you didn’t have to visit the damn Arctic Circle to see them.
They’re a phenomenon that’s dazzled Iceland’s insomniacs for millennia.
#alcohol #arctic #beach #bus #cappadocia #climate #cosmos #highway #hotdogs #iceland #magneticfield #night #northernlights #reykjavík #sights #snow #solar #space #tour #winter
https://www.crosbyreport.com/travel/the-northern-lights-would-be-better-if-you-didnt-have-to-visit-the-damn-arctic-circle-to-see-them/?fsp_sid=76
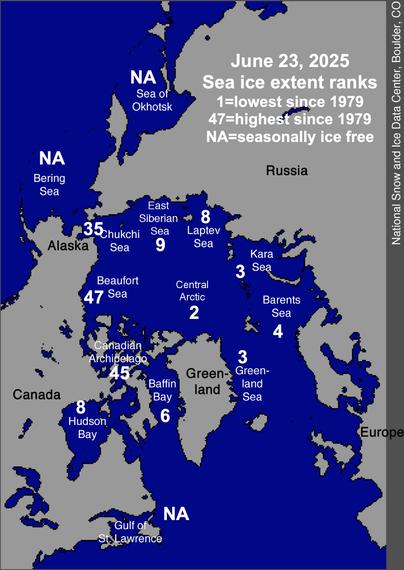
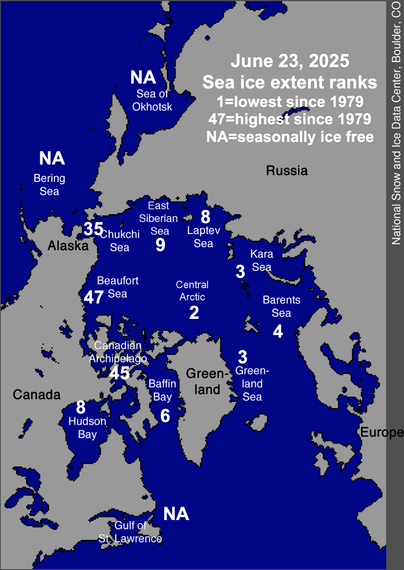
Overall sea ice extent in the Arctic as of June 23 is lowest on record for the date in NSIDC data. Here’s the regional ranks. Canadian Archipelago to the Chukchi Sea still have lots of ice relative to the past 47 years. The Siberian and Atlantic regional seas are driving the overall low extent. #Arctic #SeaIce #Summer2025 @Climatologist49 @ZLabe
Around 2000, killer whales started venturing higher into the Arctic more often and earlier in the summer. As sea ice cover decreases, more northern waters become available to the greatest predator in the ocean, and that's bound to have consequences.
The first people to notice the change and feel its effects are naturally the people who live day in and day out on Arctic waters: Indigenous nations whose subsistence hunting is under threat from this new competitor.
My latest for Sierra Magazine:
https://www.sierraclub.org/sierra/orcas-find-new-prey-arctic
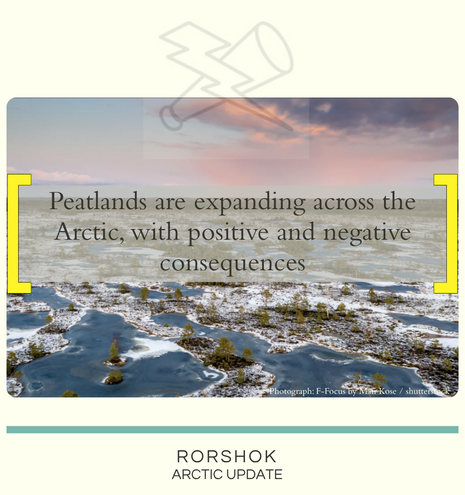
3) The warming Arctic is benefitting peatlands, which are expanding rapidly in the region. While initially a carbon sink, they release methane gas and can cause wildfires.
4) Northern universities have launched a program to increase food innovation across the Arctic. The aim is to promote Arctic foods worldwide, increasing their value and popularity.
Link to the full podcast episode in the bio - @rorshokarctic
#arctic #ArcticPodcast #arcticnews #science #sciencenews #politics #politicsNews #economy #podcast
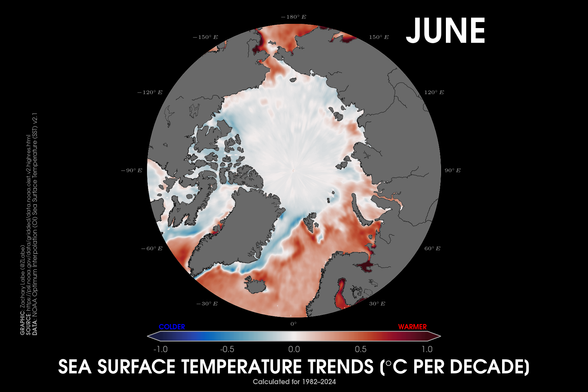
Sea surface temperatures are warming across the periphery of the #Arctic Ocean in June during the satellite-era. This is evident in both the north Pacific and north Atlantic.
Data from OISSTv2.1. For more info: https://doi.org/10.25923/9z96-aq19
https://careers.alaska.edu/jobs/arctic-program-architect-alaska-center-for-energy-and-power-fairbanks-alaska-united-states
#ACEP is looking for a new team member to help the #ARCTIC Program advance a new model for applied #energyresearch across Arctic and #Pacific regions, with a focus on #microgrids & #resilientenergysystems in remote #Alaska…
Program Architect: help build the operational backbone of a collaborative research network tackling real-world energy challenges through community-driven innovation…& research that are shaping the future of energy resilience in the North and beyond…
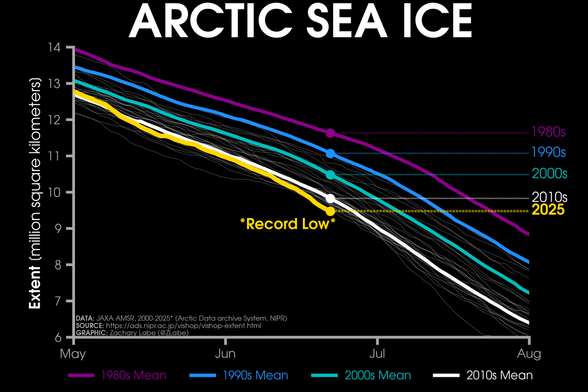
🚨 Monday ice update - #Arctic sea ice extent is currently the *lowest* on record (JAXA data)...
• about 350,000 km² below the 2010s mean
• about 1,010,000 km² below the 2000s mean
• about 1,590,000 km² below the 1990s mean
• about 2,150,000 km² below the 1980s mean
More visuals: https://zacklabe.com/arctic-sea-ice-extentconcentration/
