#PIOMAS

2024-01-04

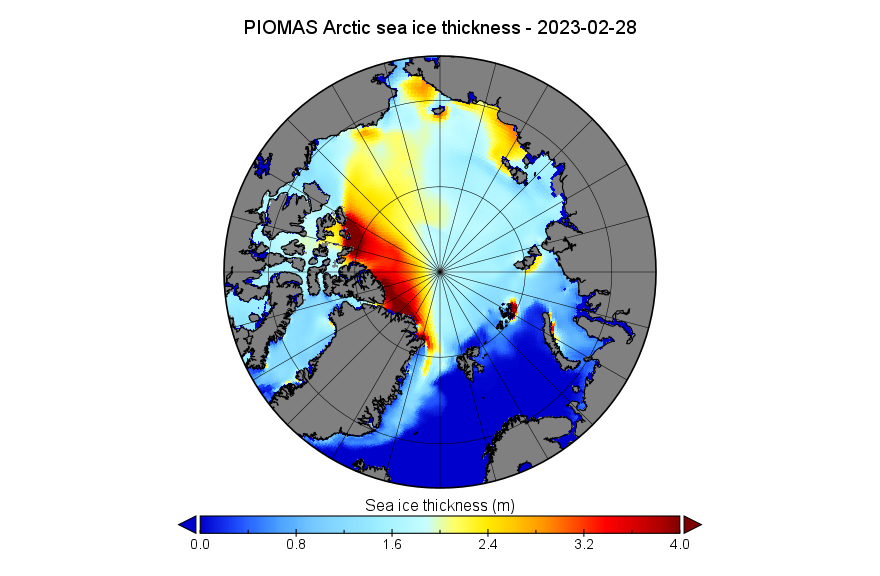
Here's an end of 2023 comparison between the "modelled" #PIOMAS #Arctic #SeaIce volume metric, and the "measured" #CryoSat2/#SMOS equivalent:

GreatWhitecon.info/2024/01/fac

Plus the associated thickness maps:

PIOMAS Arctic sea ice volume graph for December 31st 2023PIOMAS Arctic sea ice thickness map for December 31st 2023CryoSat-2/SMOS Arctic sea ice volume graph for December 31st 2023CryoSat-2/SMOS Arctic sea ice thickness map for December 31st 2023
2023-12-02

@ZLabe the #piomas chart is IMO a clearer visualisation as the intercept with zero is 'accessible', assuming a stochastically linear decrease.

Piomas arctic volume April and Sept chart.  The nadir's 2SD minimim projection almost crosses zero.  The per decade mean reduction is -3.1 +/-1, the current value is 5.
2023-05-22

Here's the May mid month #PIOMAS gridded #Arctic #SeaIce thickness map and volume graph. The latter has taken a bit of a tumble recently:

GreatWhiteCon.info/2023/05/fac

PIOMAS gridded Arctic sea ice thickness map on May 15th 2023PIOMAS Arctic sea ice volume graph on May 15th 2023
2023-03-08

The 2023 #Arctic #SeaIce maximum #extent may already have occurred.

However, what is certain is that the #UniversityOfWashington's
#Polar Science Center's #PIOMAS modelled sea ice #thickness data for February 2023 has been released:

GreatWhiteCon.info/2023/03/fac

It reveals some of the thickest sea ice remaining in the Arctic Ocean taking the #FramStrait exit from the Central Arctic.

#JAXA #ViSHOP

The JAXA/ViSHOP Arctic sea ice extent graph for March 7th 2023The University of Washington's 
Polar Science Center's PIOMAS modelled Arctic sea ice thickness map for February 28th 2023

Client Info

Server: https://mastodon.social
Version: 2025.04
Repository: https://github.com/cyevgeniy/lmst