#RandomWalker

Steven Sandersonspsanderson@rstats.me
2025-05-15

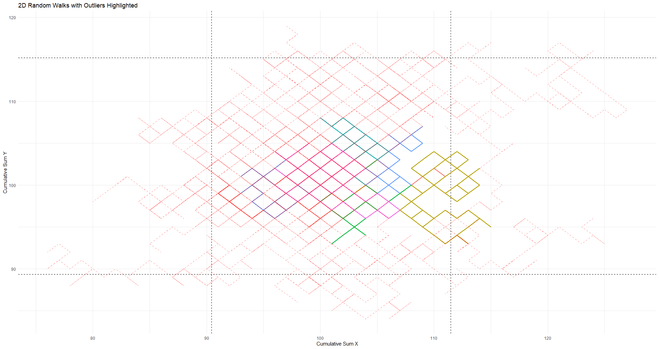
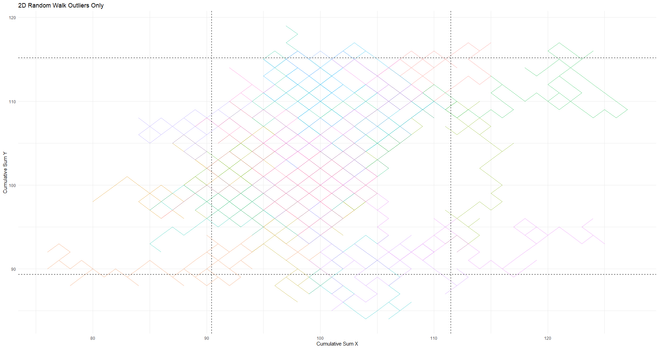
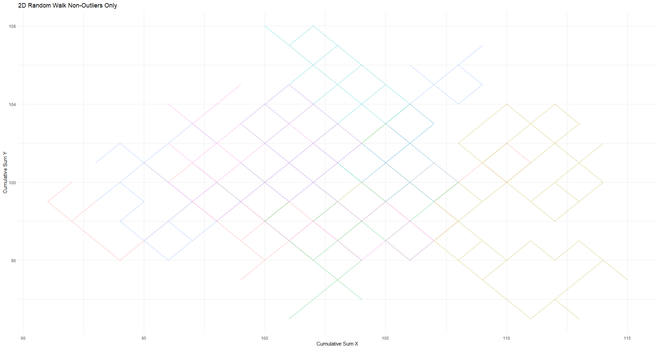
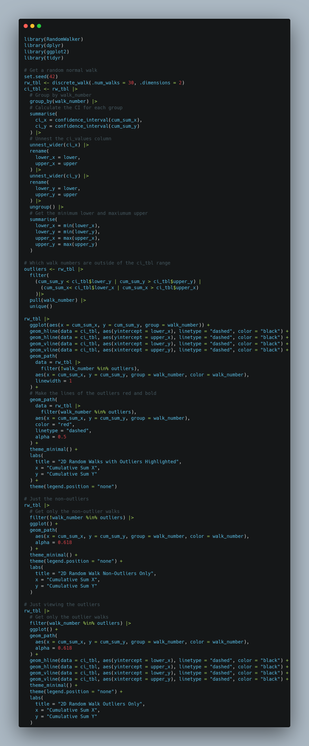
Same as yesterday, but this time, making a 2D Discrete Random Walk with my #R #Package #RandomWalker

#R #RStats #RProgramming #RandomWalks #Visual #ggplot2

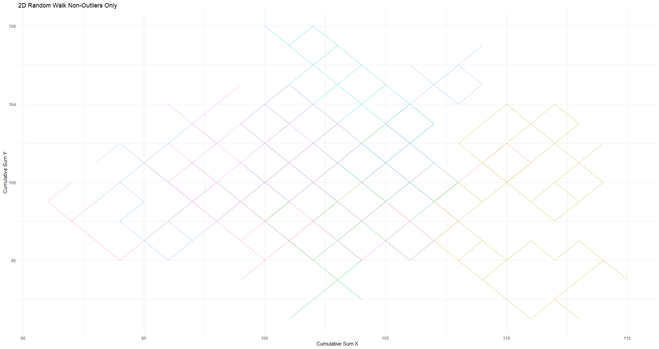
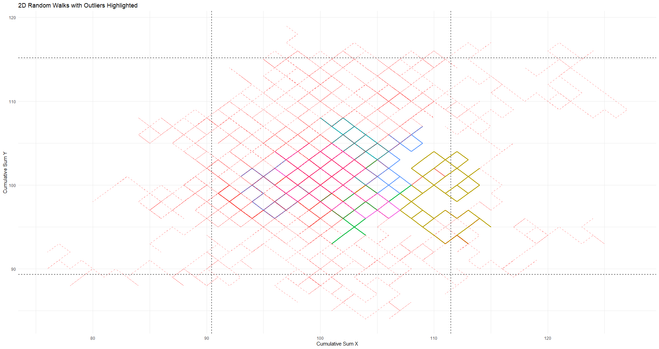
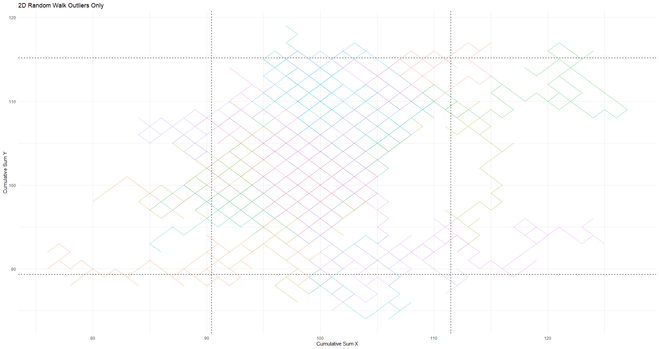
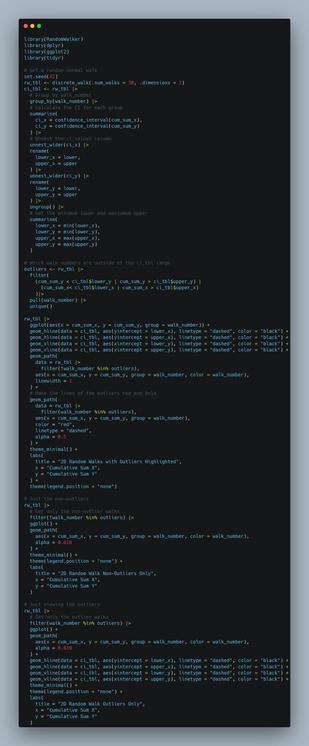
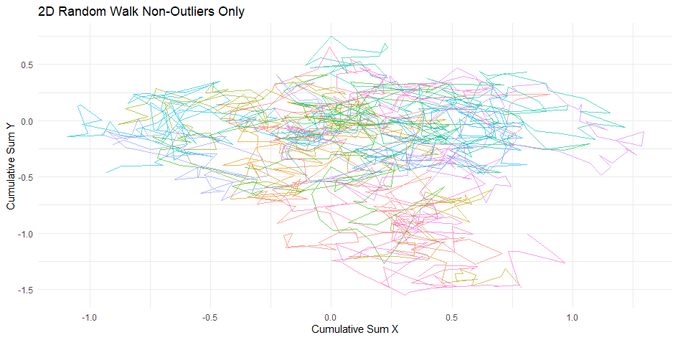
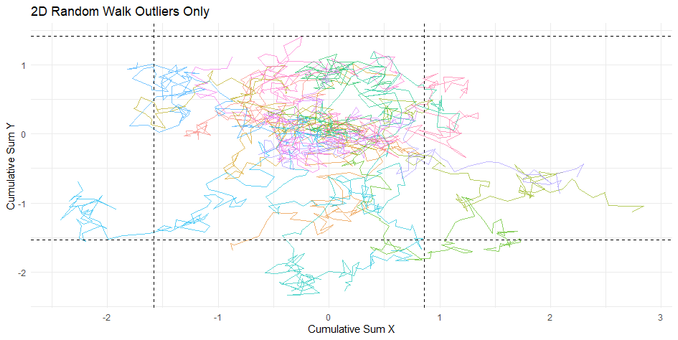
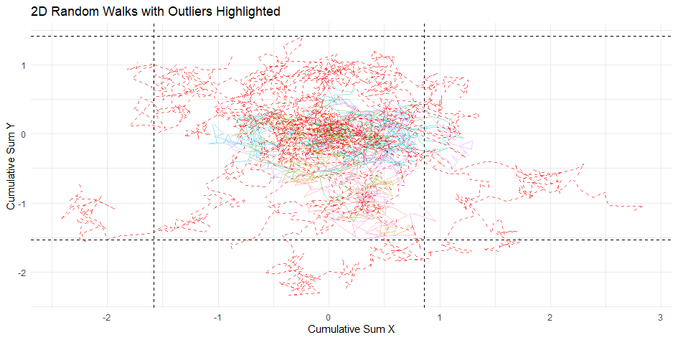
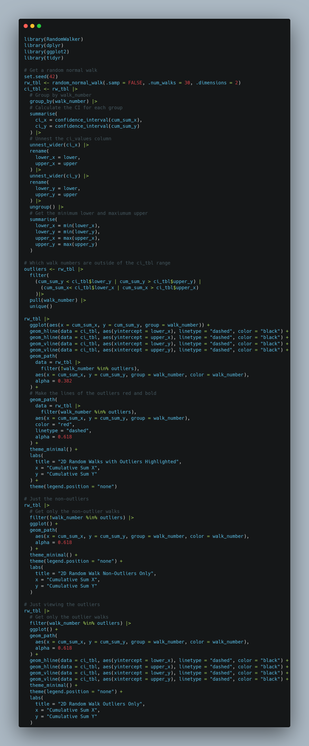
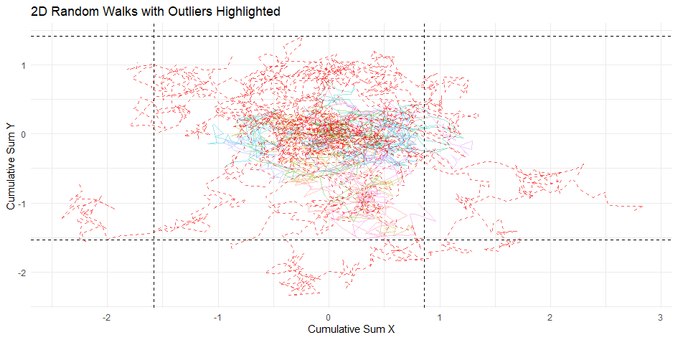
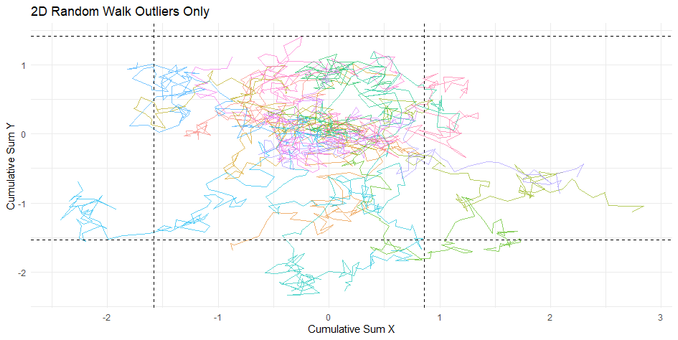
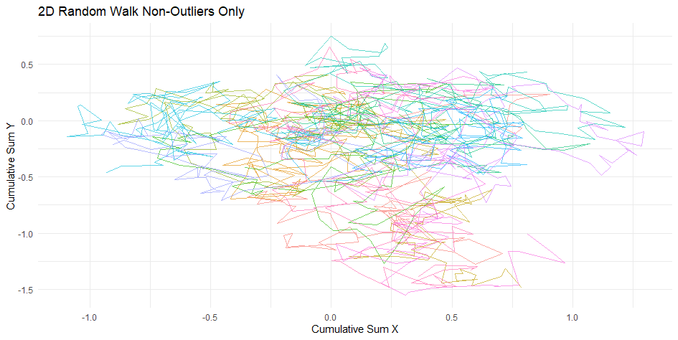
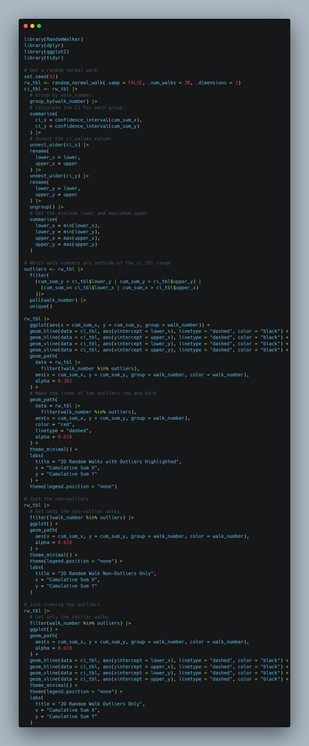
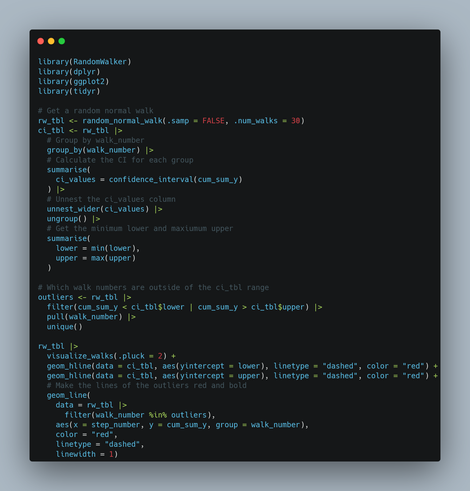
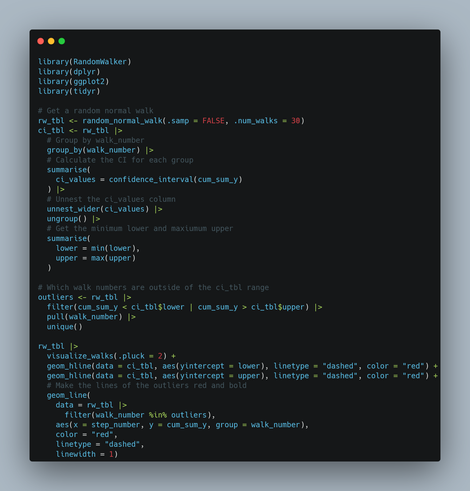
A scatterplot titled "2D Random Walks with Outliers Highlighted." It shows multiple colored random walk paths in a 2D space, with outliers prominently highlighted in bold red dashed lines. Non-outliers are displayed in lighter colors. Black dashed horizontal and vertical lines indicate threshold boundaries for outlier detection. The x-axis is labeled "Cumulative Sum X," and the y-axis is labeled "Cumulative Sum Y."A scatterplot titled "2D Random Walk Outliers Only." It showcases only the outlier random walk paths in a 2D space, displayed in various colors on a white background. Black dashed horizontal and vertical lines mark the threshold boundaries for outlier detection. The x-axis is labeled "Cumulative Sum X," and the y-axis is labeled "Cumulative Sum Y."A scatterplot titled "2D Random Walk Non-Outliers Only." It displays multiple colored linear paths representing random walks in a 2D space, constrained to non-outlier data points. The x-axis is labeled "Cumulative Sum X," and the y-axis is labeled "Cumulative Sum Y." The paths are laid out in a grid-like pattern with varied colors.A screenshot of R programming code written for generating 2D random walks, analyzing outliers, and plotting results. The code uses libraries such as RandomWalker, dplyr, ggplot2, and tidyr. It calculates confidence intervals, identifies outliers, and generates three types of plots: non-outliers, outliers, and highlighted outliers. The syntax is color-coded, with comments explaining each step.
Steven P. Sanderson II, MPHstevensanderson@mstdn.social
2025-05-15

Same as yesterday, but this time, making a 2D Discrete Random Walk with my #R #Package #RandomWalker

#R #RStats #RProgramming #RandomWalks #Visual #ggplot2

A scatterplot titled "2D Random Walk Non-Outliers Only." It displays multiple colored linear paths representing random walks in a 2D space, constrained to non-outlier data points. The x-axis is labeled "Cumulative Sum X," and the y-axis is labeled "Cumulative Sum Y." The paths are laid out in a grid-like pattern with varied colors.A scatterplot titled "2D Random Walks with Outliers Highlighted." It shows multiple colored random walk paths in a 2D space, with outliers prominently highlighted in bold red dashed lines. Non-outliers are displayed in lighter colors. Black dashed horizontal and vertical lines indicate threshold boundaries for outlier detection. The x-axis is labeled "Cumulative Sum X," and the y-axis is labeled "Cumulative Sum Y."A scatterplot titled "2D Random Walk Outliers Only." It showcases only the outlier random walk paths in a 2D space, displayed in various colors on a white background. Black dashed horizontal and vertical lines mark the threshold boundaries for outlier detection. The x-axis is labeled "Cumulative Sum X," and the y-axis is labeled "Cumulative Sum Y."A screenshot of R programming code written for generating 2D random walks, analyzing outliers, and plotting results. The code uses libraries such as RandomWalker, dplyr, ggplot2, and tidyr. It calculates confidence intervals, identifies outliers, and generates three types of plots: non-outliers, outliers, and highlighted outliers. The syntax is color-coded, with comments explaining each step.
Steven Sandersonspsanderson@rstats.me
2025-05-14

Generate and visualize a Two Dimensional Random Walk in #R with #RandomWalker

#R #RStats #RProgramming #Code

A 2D scatter plot titled "2D Random Walk Non-Outliers Only," showing multiple random walk trajectories in various colors. The x-axis is labeled "Cumulative Sum X," and the y-axis is labeled "Cumulative Sum Y." The trajectories are concentrated around the origin and do not include any outliers.A 2D scatter plot titled "2D Random Walk Outliers Only," depicting random walk trajectories in various colors. The x-axis is labeled "Cumulative Sum X," and the y-axis is labeled "Cumulative Sum Y." Black dashed lines mark boundary limits, highlighting walks identified as outliers that extend beyond the main cluster.A 2D scatter plot titled "2D Random Walks with Outliers Highlighted," combining both non-outlier and outlier trajectories. Non-outlier walks are displayed in various colors, while outliers are highlighted in bold red dashed lines. Black dashed lines denote confidence interval boundaries, and the x-axis and y-axis are labeled "Cumulative Sum X" and "Cumulative Sum Y," respectively.A screenshot of an R script for generating and visualizing 2D random walks. The code uses the RandomWalker, dplyr, and ggplot2 libraries to compute random walks, identify outliers, and plot results. Key sections include calculating confidence intervals, filtering outliers, and creating customized plots with distinct visual styling for outliers and non-outliers.
Steven P. Sanderson II, MPHstevensanderson@mstdn.social
2025-05-14

Generate and visualize a Two Dimensional Random Walk in #R with #RandomWalker

#R #RStats #RProgramming #Code

A 2D scatter plot titled "2D Random Walks with Outliers Highlighted," combining both non-outlier and outlier trajectories. Non-outlier walks are displayed in various colors, while outliers are highlighted in bold red dashed lines. Black dashed lines denote confidence interval boundaries, and the x-axis and y-axis are labeled "Cumulative Sum X" and "Cumulative Sum Y," respectively.A 2D scatter plot titled "2D Random Walk Outliers Only," depicting random walk trajectories in various colors. The x-axis is labeled "Cumulative Sum X," and the y-axis is labeled "Cumulative Sum Y." Black dashed lines mark boundary limits, highlighting walks identified as outliers that extend beyond the main cluster.A 2D scatter plot titled "2D Random Walk Non-Outliers Only," showing multiple random walk trajectories in various colors. The x-axis is labeled "Cumulative Sum X," and the y-axis is labeled "Cumulative Sum Y." The trajectories are concentrated around the origin and do not include any outliers.A screenshot of an R script for generating and visualizing 2D random walks. The code uses the RandomWalker, dplyr, and ggplot2 libraries to compute random walks, identify outliers, and plot results. Key sections include calculating confidence intervals, filtering outliers, and creating customized plots with distinct visual styling for outliers and non-outliers.
Steven Sandersonspsanderson@rstats.me
2025-05-12

Attached you will see a simple script to generate and visualize a 1D random walk and it's resulting outliers.

#R #RStats #RandomWalker #Coding #Programming

library(RandomWalker)
library(dplyr)
library(ggplot2)
library(tidyr)

# Get a random normal walk
rw_tbl <- random_normal_walk(.samp = FALSE, .num_walks = 30)
ci_tbl <- rw_tbl |>
  # Group by walk_number
  group_by(walk_number) |>
  # Calculate the CI for each group
  summarise(
    ci_values = confidence_interval(cum_sum_y)
  ) |>
  # Unnest the ci_values column
  unnest_wider(ci_values) |>
  ungroup() |>
  # Get the minimum lower and maxiumum upper
  summarise(
    lower = min(lower),
    upper = max(upper)
  )

# Which walk numbers are outside of the ci_tbl range
outliers <- rw_tbl |>
  filter(cum_sum_y < ci_tbl$lower | cum_sum_y > ci_tbl$upper) |>
  pull(walk_number) |>
  unique()

rw_tbl |>
  visualize_walks(.pluck = 2) +
  geom_hline(data = ci_tbl, aes(yintercept = lower), linetype = "dashed", color = "red") +
  geom_hline(data = ci_tbl, aes(yintercept = upper), linetype = "dashed", color = "red") +
  # Make the lines of the outliers red and bold
  geom_line(
    data = rw_tbl |> 
      filter(walk_number %in% outliers), 
    aes(x = step_number, y = cum_sum_y, group = walk_number), 
    color = "red",
    linetype = "dashed",
    linewidth = 1)
Steven P. Sanderson II, MPHstevensanderson@mstdn.social
2025-05-12

Attached you will see a simple script to generate and visualize a 1D random walk and it's resulting outliers.

#R #RStats #RandomWalker #Coding #Programming

library(RandomWalker)
library(dplyr)
library(ggplot2)
library(tidyr)

# Get a random normal walk
rw_tbl <- random_normal_walk(.samp = FALSE, .num_walks = 30)
ci_tbl <- rw_tbl |>
  # Group by walk_number
  group_by(walk_number) |>
  # Calculate the CI for each group
  summarise(
    ci_values = confidence_interval(cum_sum_y)
  ) |>
  # Unnest the ci_values column
  unnest_wider(ci_values) |>
  ungroup() |>
  # Get the minimum lower and maxiumum upper
  summarise(
    lower = min(lower),
    upper = max(upper)
  )

# Which walk numbers are outside of the ci_tbl range
outliers <- rw_tbl |>
  filter(cum_sum_y < ci_tbl$lower | cum_sum_y > ci_tbl$upper) |>
  pull(walk_number) |>
  unique()

rw_tbl |>
  visualize_walks(.pluck = 2) +
  geom_hline(data = ci_tbl, aes(yintercept = lower), linetype = "dashed", color = "red") +
  geom_hline(data = ci_tbl, aes(yintercept = upper), linetype = "dashed", color = "red") +
  # Make the lines of the outliers red and bold
  geom_line(
    data = rw_tbl |> 
      filter(walk_number %in% outliers), 
    aes(x = step_number, y = cum_sum_y, group = walk_number), 
    color = "red",
    linetype = "dashed",
    linewidth = 1)
Steven Sandersonspsanderson@rstats.me
2025-05-09

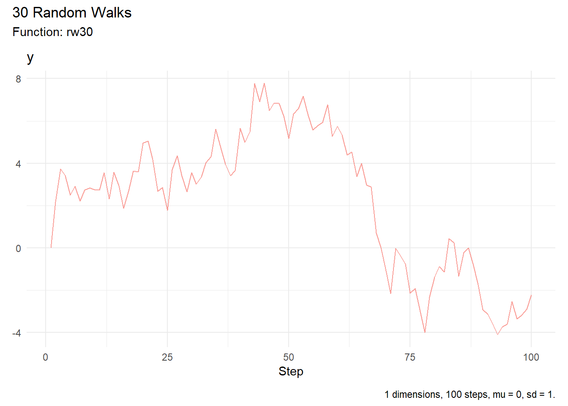
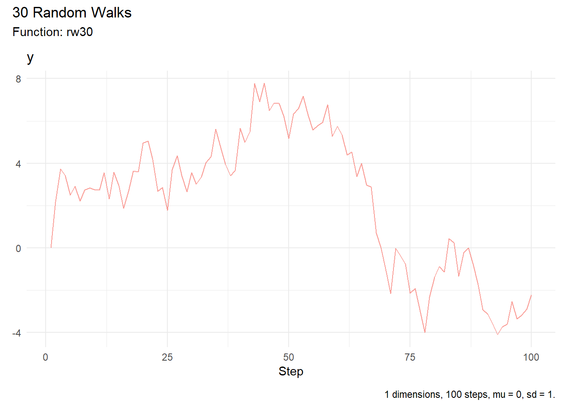
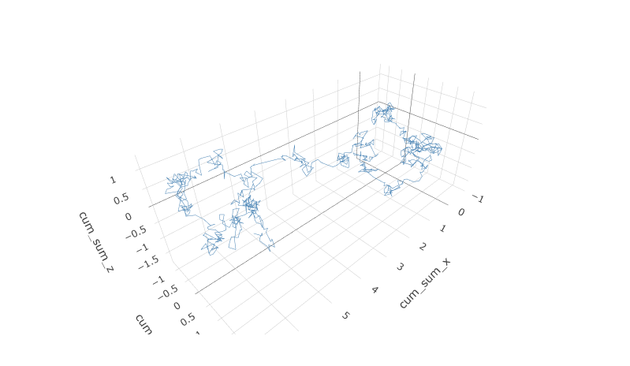
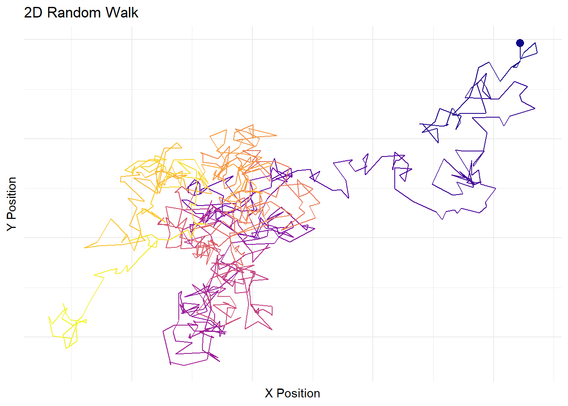
📊 Just released: RandomWalker 0.3.0! Now you can generate random walks in up to 3 dimensions. This is a must-read for R programmers looking to enhance their simulations.

Dive into the details: [spsanderson.com/steveondata/po

#Data #RLang #Stats #RData #Blog #CRAN #RStats #TimeSeries #RandomWalker

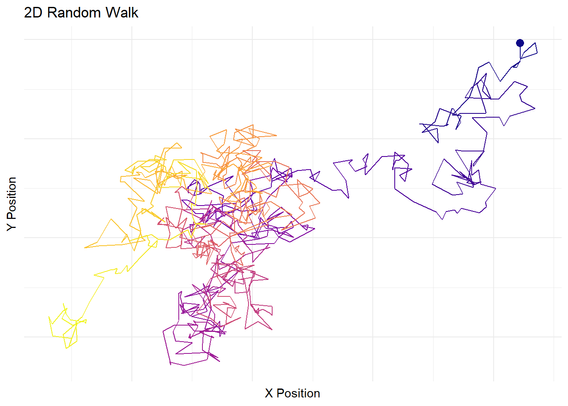
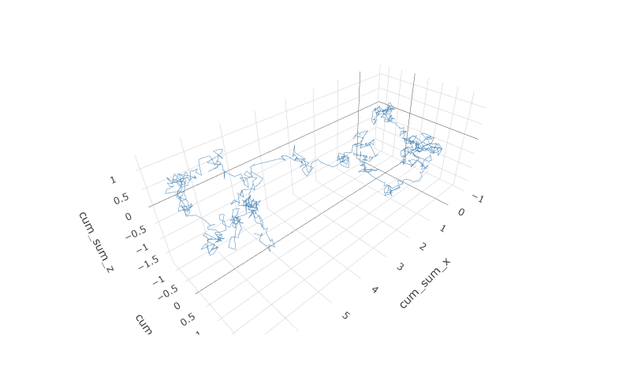
A scatter-style line plot titled “2D Random Walk” displays a tangled path that changes color from bright yellow at the starting point (lower left) through orange and red to dark blue at the end point (upper right); the axes are labeled “X Position” and “Y Position.” A dark blue dot marks the final location.A 3-D perspective plot on a light grid shows a pale blue line snaking irregularly through space; the axes are labeled “cum_sum_x,” “cum_sum_y,” and “cum_sum_z,” depicting the cumulative trajectory of a 3-D random walk.A white plot titled “30 Random Walks” shows a single thin red line that zig-zags up and down across 100 steps; the x-axis is labeled “Step” (0 – 100) and the y-axis ranges roughly from −4 to +8, illustrating the cumulative path of one 1-D random walk.A decorative illustration featuring a large, glossy blue letter “R” at center, surrounded by flowing translucent ribbon shapes and watercolor-like splashes in shades of blue, teal, and violet on a white background.
Steven P. Sanderson II, MPHstevensanderson@mstdn.social
2025-05-09

📊 Just released: RandomWalker 0.3.0! Now you can generate random walks in up to 3 dimensions. This is a must-read for R programmers looking to enhance their simulations.

Dive into the details: [spsanderson.com/steveondata/po

#Data #RLang #Stats #RData #Blog #CRAN #RStats #TimeSeries #RandomWalker

30 Random Walks graph, displaying a line graph with the function rw30, showing steps on the x-axis and values on the y-axis. The graph indicates 1 dimension, 100 steps, mu = 0, and sd = 1.A 3-D perspective plot on a light grid shows a pale blue line snaking irregularly through space; the axes are labeled “cum_sum_x,” “cum_sum_y,” and “cum_sum_z,” depicting the cumulative trajectory of a 3-D random walk.2D Random Walk, showing a two-dimensional graph with labeled X and Y positions.A decorative illustration featuring a large, glossy blue letter “R” at center, surrounded by flowing translucent ribbon shapes and watercolor-like splashes in shades of blue, teal, and violet on a white background.
Steven Sandersonspsanderson@rstats.me
2025-05-08

🐧 My Friday Linux tip is taking a rain check—randomness called!

Tomorrow I’m dropping a deep-dive blog on RandomWalker 0.3.0, now live on CRAN.

Think 3-D walks, on-the-fly subsetting, built-in confidence intervals, and the “x” column reborn as step_number. More goodies already cooking—stay tuned for the link!

#rstats #RandomWalker #DataScience #OpenSource #CRAN

Steven P. Sanderson II, MPHstevensanderson@mstdn.social
2025-05-08

🐧 My Friday Linux tip is taking a rain check—randomness called!

Tomorrow I’m dropping a deep-dive blog on RandomWalker 0.3.0, now live on CRAN.

Think 3-D walks, on-the-fly subsetting, built-in confidence intervals, and the “x” column reborn as step_number. More goodies already cooking—stay tuned for the link!

#rstats #RandomWalker #DataScience #OpenSource #CRAN

Steven Sandersonspsanderson@rstats.me
2025-03-06

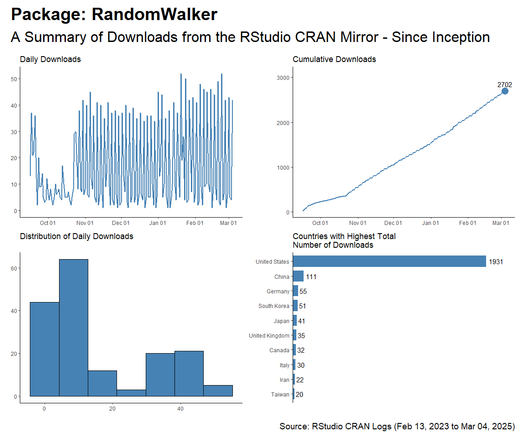
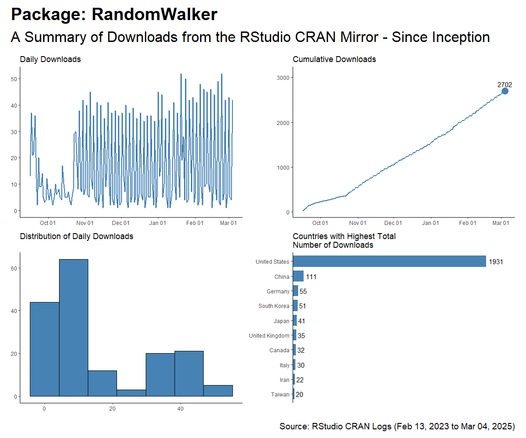
Antti Rask 🦜and I worked on a package called #RandomWalker which seems to have download patterns that are anything but. There is a lot of work lined up to do on it, time is elusive but we will get there.

You can follow the issues here: github.com/spsanderson/RandomW

#R #RStats #TimeSeries

package stats
Steven P. Sanderson II, MPHstevensanderson@mstdn.social
2025-03-06

Antti Rask 🦜and I worked on a package called #RandomWalker which seems to have download patterns that are anything but. There is a lot of work lined up to do on it, time is elusive but we will get there.

You can follow the issues here: github.com/spsanderson/RandomW

#R #RStats #TimeSeries

Package stats
Steven Sandersonspsanderson@rstats.me
2024-11-16

Can you tell when the new version of our #R #package #RandomWalker was released?

I think you can :)

#R #RStats #RProgramming #TimeSeries #Finance

Steven P. Sanderson II, MPHstevensanderson@mstdn.social
2024-11-16

Can you tell when the new version of our #R #package #RandomWalker was released?

I think you can :)

#R #RStats #RProgramming #TimeSeries #Finance

Steven Sandersonspsanderson@rstats.me
2024-11-11

Been working hard on my #R #Package #RandomWalker and I have added the ability to now generate 1D, 2D and 3D Random Walks.

This is still in dev if you want to install from there and try it.

#R #RStats #TimeSeries

Steven P. Sanderson II, MPHstevensanderson@mstdn.social
2024-11-11

Been working hard on my #R #Package #RandomWalker and I have added the ability to now generate 1D, 2D and 3D Random Walks.

This is still in dev if you want to install from there and try it.

#R #RStats #TimeSeries

Steven P. Sanderson II, MPHstevensanderson@mstdn.social
2024-10-28

Just some simple messing around in my #R #package #RandomWalker which integrates nicely with the #tidyverse

This example uses the rw30() function.

Documentation: spsanderson.com/RandomWalker/r

#RProgramming #Coding #TimeSeries #TimeSeriesAnalysis

Steven Sandersonspsanderson@rstats.me
2024-10-28

Just some simple messing around in my #R #package #RandomWalker which integrates nicely with the #tidyverse

This example uses the rw30() function.

Documentation: spsanderson.com/RandomWalker/r

Steven P. Sanderson II, MPHstevensanderson@mstdn.social
2024-10-23

Client Info

Server: https://mastodon.social
Version: 2025.04
Repository: https://github.com/cyevgeniy/lmst