
Gergely Daróczi on reviving Budapest Users of R Network (BURN) + using R with Strava data for daily insights—his personal diabetes story.
#RProgramming

R Consortium applauds the R Foundation & R Core on a major new investment in R’s future!
Nearly $650K (£499,981.21) over 24 months for “Enabling the Next Generation of Contributors to R,” modernizing infrastructure & governance, mentoring new contributors, and strengthening communication.
Partners include Posit, Google, A2-Ai and the R Consortium

🚨 Breaking News: R enthusiasts celebrate the groundbreaking achievement of finally getting R to run in a browser... by enabling #JavaScript. 🎉 Because, of course, nothing screams #innovation like making a heavyweight statistical tool rely on a glorified calculator script. 🤦♂️
https://webr.sh/ #RProgramming #BrowserTech #DataScience #HackerNews #ngated

Excited to attend another talk where generative AI is pitched as your new coding co-pilot — until it confidently suggests a for-loop that summons Cthulhu. 🌀🧠 #RStats #AI #Rprogramming

Join us on November 30 from 4:00 pm to 5:00 pm CET (GMT+1) for a talk on using #Generative #AI in #R with Sharon Machlis @smach — Tech Journalist and Data Professional.
In this session, Sharon will offer an accessible, high-level overview of what’s possible today — including how #large #language #models can help you write and improve your R code, as well as add #AI-driven features to your applications.
RSVP 🔗 https://www.meetup.com/rladies-paris/events/312083756/.


Discover the power of property-based testing in R with the #quickcheck package! Seamlessly integrates with #testthat and offers a variety of generators for atomic vectors, lists, and tibbles. Perfect for ensuring your code's reliability. Check it out: https://github.com/armcn/quickcheck #rstats #rprogramming #testing

New Course Release! R Programming for Data Science by Roger D. Peng
This course brings the fundamentals of R programming to you, using the same material developed as part of the industry-leading Johns Hopkins Data Science Specialization. The skills taught in this course will lay the foundation for you to begin your journey learning data science.
Find it on Leanpub!

Doing some work on my #R package #RandomWalker and looks like we got a nice speedup coming for all of the generating functions. Over 2,000 replications saw a large speedup where the original function takes 2.8x as long as the new.


Show HN: Erdos – open-source, AI data science IDE
https://www.lotas.ai/erdos
#ycombinator #Data_Science #AI_for_Data_Science #VSCode #RStudio #code_editor #Rprogramming #data_analysis #Rao #Erdos #Python #SQL #IDE #Coding_Agent #Data_Analysis
Today's blog post is a simple one, but still important to your data. Looking at dropping NA values.
Post: https://www.spsanderson.com/steveondata/posts/2025-10-20/
New Course Release! R Programming for Data Science by Roger D. Peng
This course brings the fundamentals of R programming to you, using the same material developed as part of the industry-leading Johns Hopkins Data Science Specialization. The skills taught in this course will lay the foundation for you to begin your journey learning data science.
Find it on Leanpub!

New R post alert! 📣 Ever found `sapply` limiting when you need to iterate over *multiple* varying inputs? My latest article dives deep into `mapply`, showing how to elegantly handle paired arguments for tasks like data scaling or complex simulations. Level up your `apply` game! 💡
https://drmo.site/bhXeDb
#RStats #Mapply #RProgramming #DataScience #Coding

New Course Release! R Programming for Data Science by Roger D. Peng
This course brings the fundamentals of R programming to you, using the same material developed as part of the industry-leading Johns Hopkins Data Science Specialization. The skills taught in this course will lay the foundation for you to begin your journey learning data science.
Find it on Leanpub!

💻 Want to speed up your R workflows? A few seats are still available for our Efficient Data Analysis with data.table in R online course, 8 Oct! @eliocamp @paocorrales
https://www.physalia-courses.org/courses-workshops/data-table/

Get funding for your R project! 🚀 R Consortium tech grants support open-source tools + community initiatives.
⏰ 2 weeks left to apply: https://r-consortium.org/all-projects/callforproposals.html
Past grantee: “Straightforward, smooth, and helpful. Highly recommended.” – Andreas Neudecker

Happy "Talk Like A Pirate Day"!!!!
To celebrate, sit down and write a few "R" scripts today!
(if you don't get it right away... give it a minute.)
#RProgramming #TalkLikeAPirateDay #Programming #Technology

Today's post was on applying functions to rows of a data frame.
Post: https://www.spsanderson.com/steveondata/posts/2025-09-15/
apply()
TOMORROW! Moving from SAS to R in pharma - Join the R Consortium webinar to see how ProCogia recreated a closed-source SAS pipeline in R 📷 Sept 9, 9am PT / 12pm ET 📷


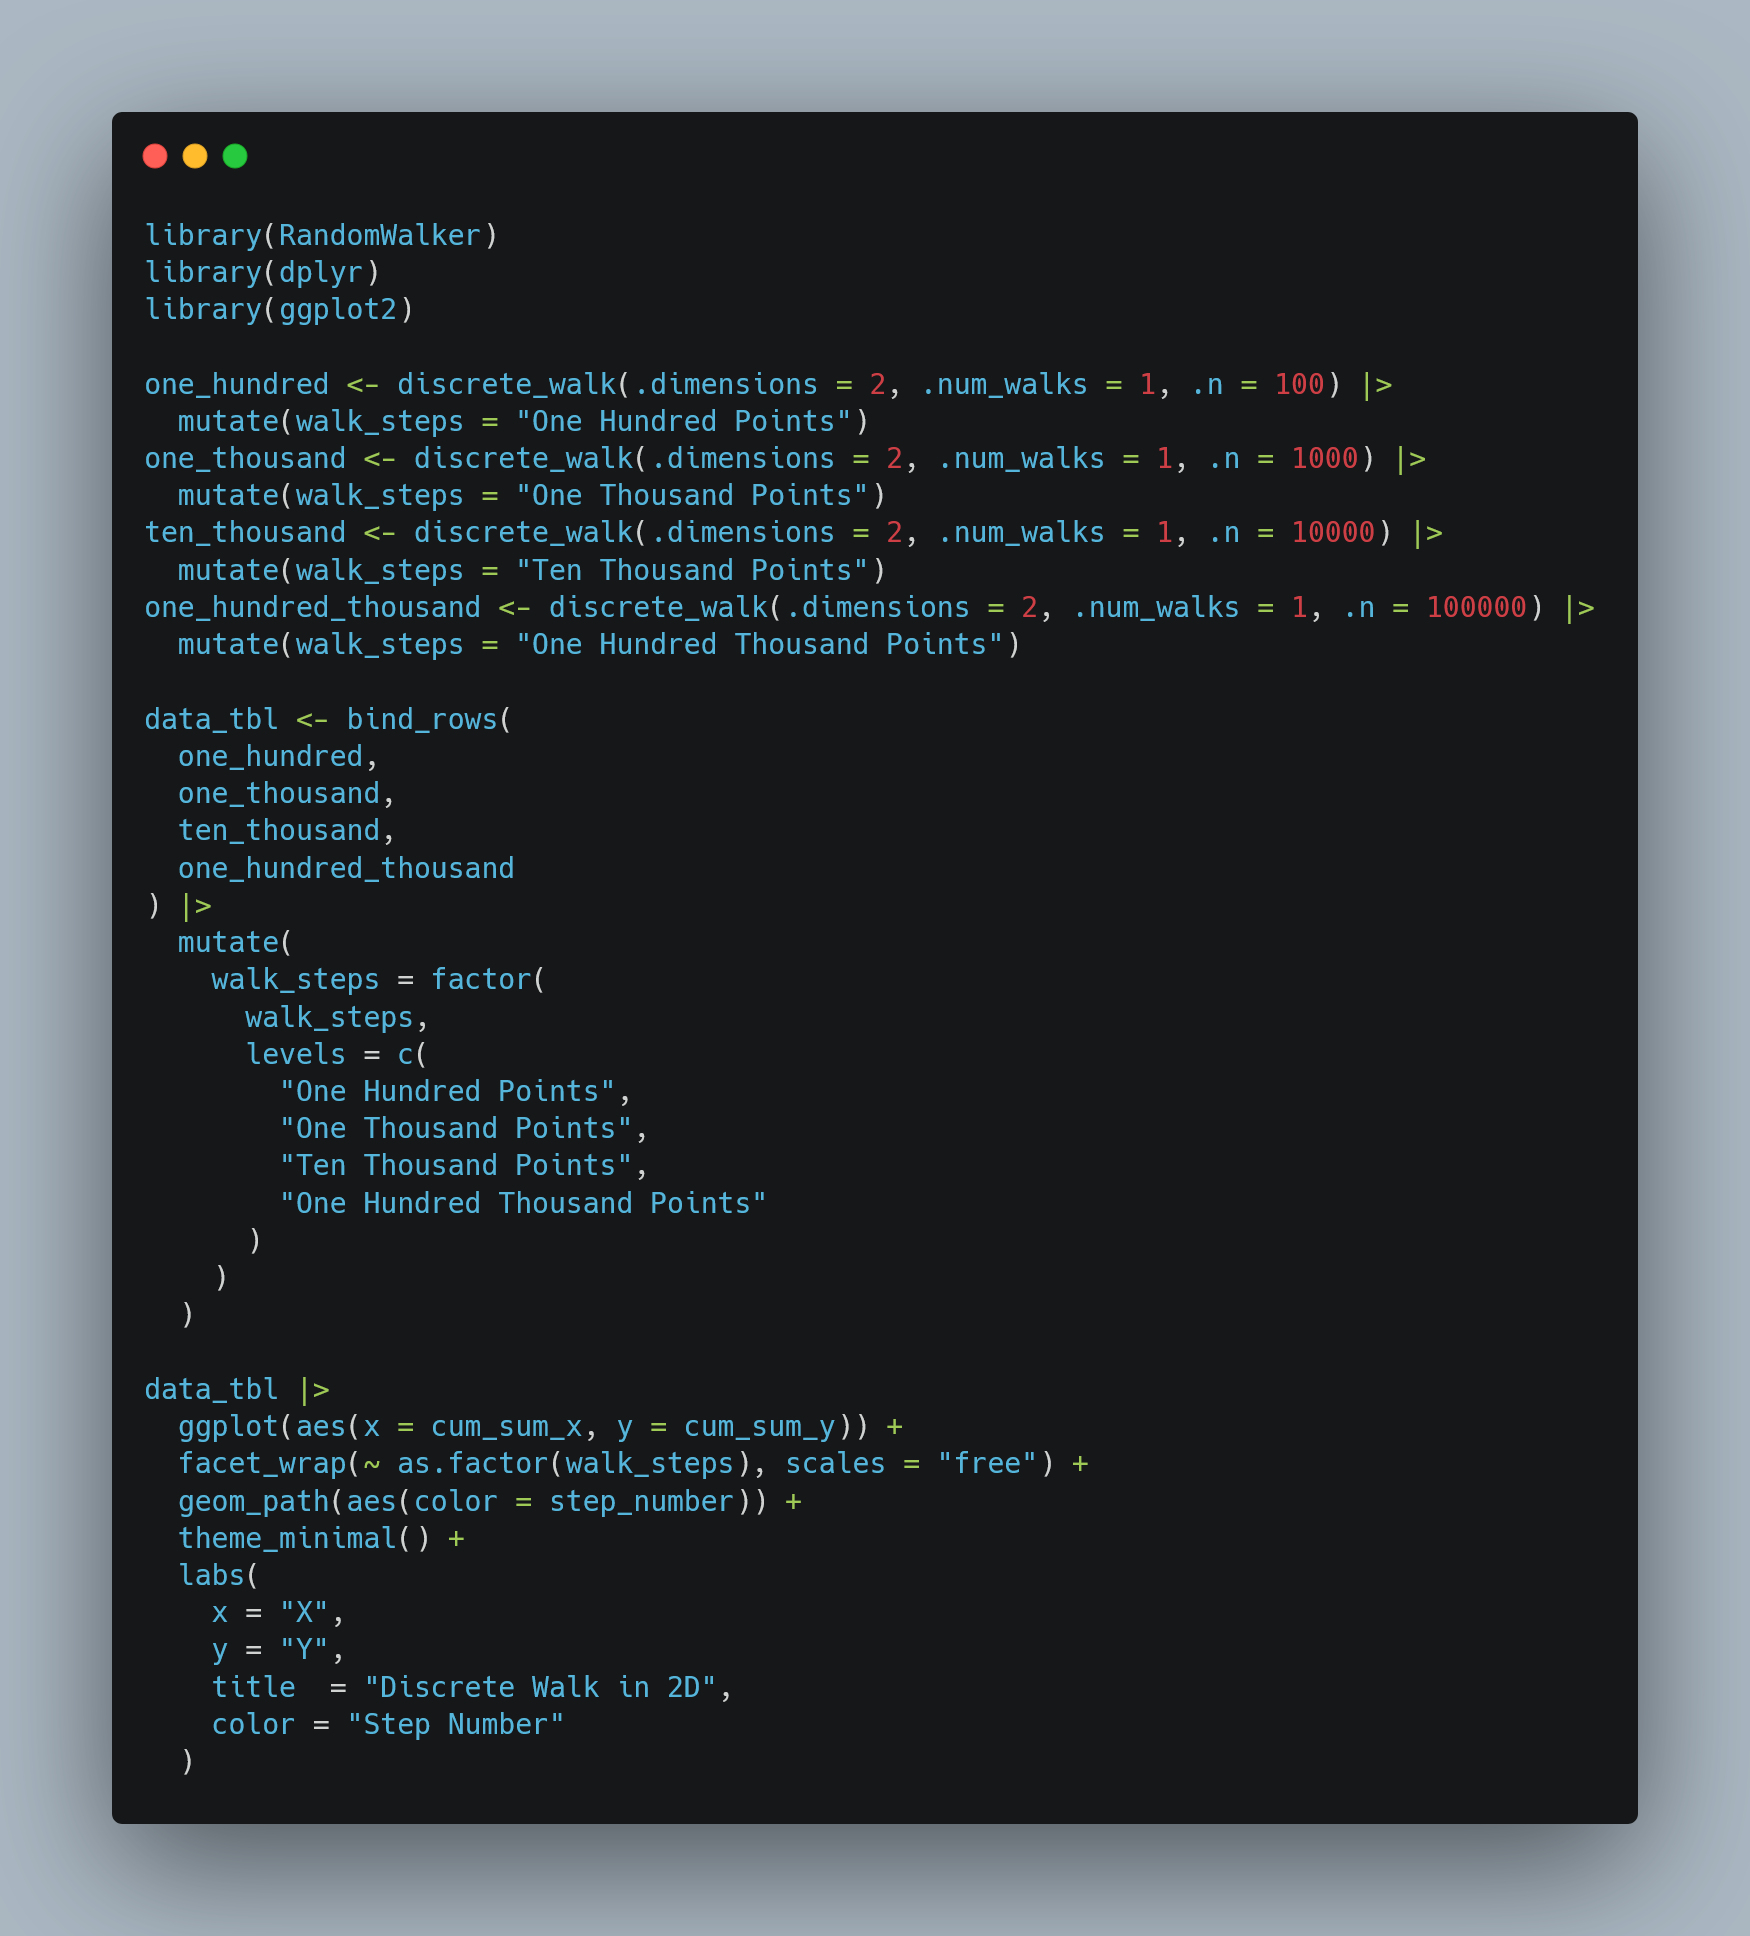
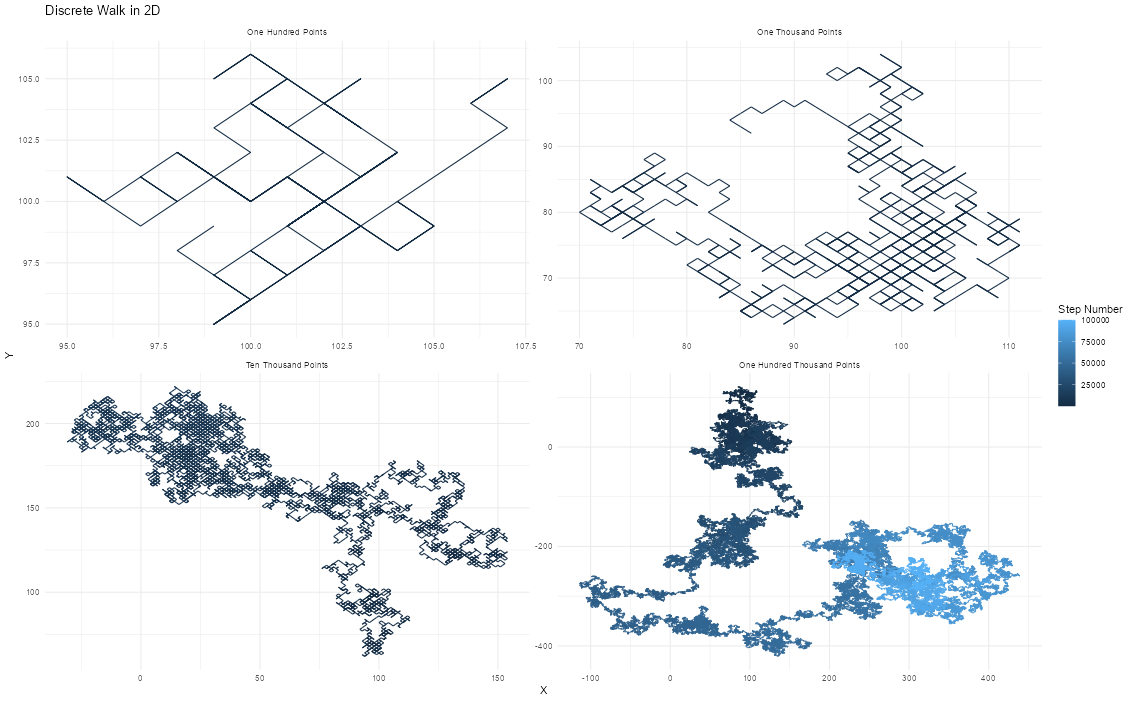
Here is a simple script that will create a discrete walk of 100, 1000, 10000, and 100000 steps, I thought it was neat to see the difference in the 2D output. For this I used the RandomWalker package developed by myself and Antti Rask 🦜 #R #RStats #RProgramming #ggplot2 #RandomWalker #Random #tidy
Client Info
Server: https://mastodon.social
Version: 2025.07
Repository: https://github.com/cyevgeniy/lmst