#UberMovement

2024-11-12

#30DayMapChallenge Day 12 (Time and space):

🚗 Nairobi´s Traffic - reloaded 🚗

Today, we expand on day 4 (mapstodon.space/@heigit/113423) with a GIF of how car travel times in Nairobi vary through the day.

The map shows isochrones (5, 10, 20 minute intervals) of 5 random locations in Nairobi.
We see a strong increase of the travel times between 1 and 7 pm, which shows a saturation of the traffic system rather than a typical rush hour.

🗺 created with openrouteservice.org and #UberMovement #opendata
2024-11-04

#30DayMapChallenge #day4:

🏫 Lessons in Traffic 🏫

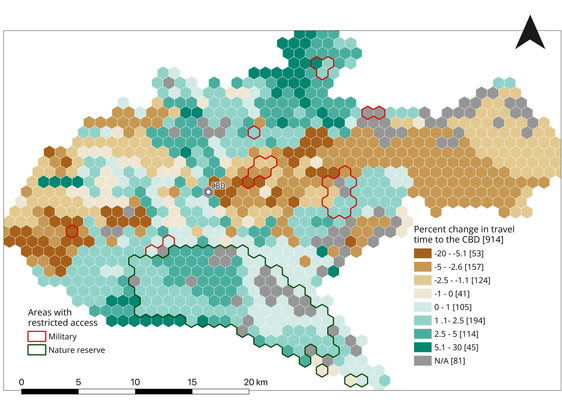
This map shows how rush hour travel times to Nairobi’s Central Business District (CBD) change when the school starts: brown hexagons show higher travel time increases.

The map was created with #openrouteservice using #UberMovement open data.

This is part of a study by Charles Hatfield, Marcel Reinmuth et al that shows how school commutes shape urban traffic patterns and impact access across Nairobi.

🔗 Paper: tinyurl.com/lessons-in-traffic

Client Info

Server: https://mastodon.social
Version: 2025.04
Repository: https://github.com/cyevgeniy/lmst