This is my monthly precipitation update. I forgot to post it last weekend.
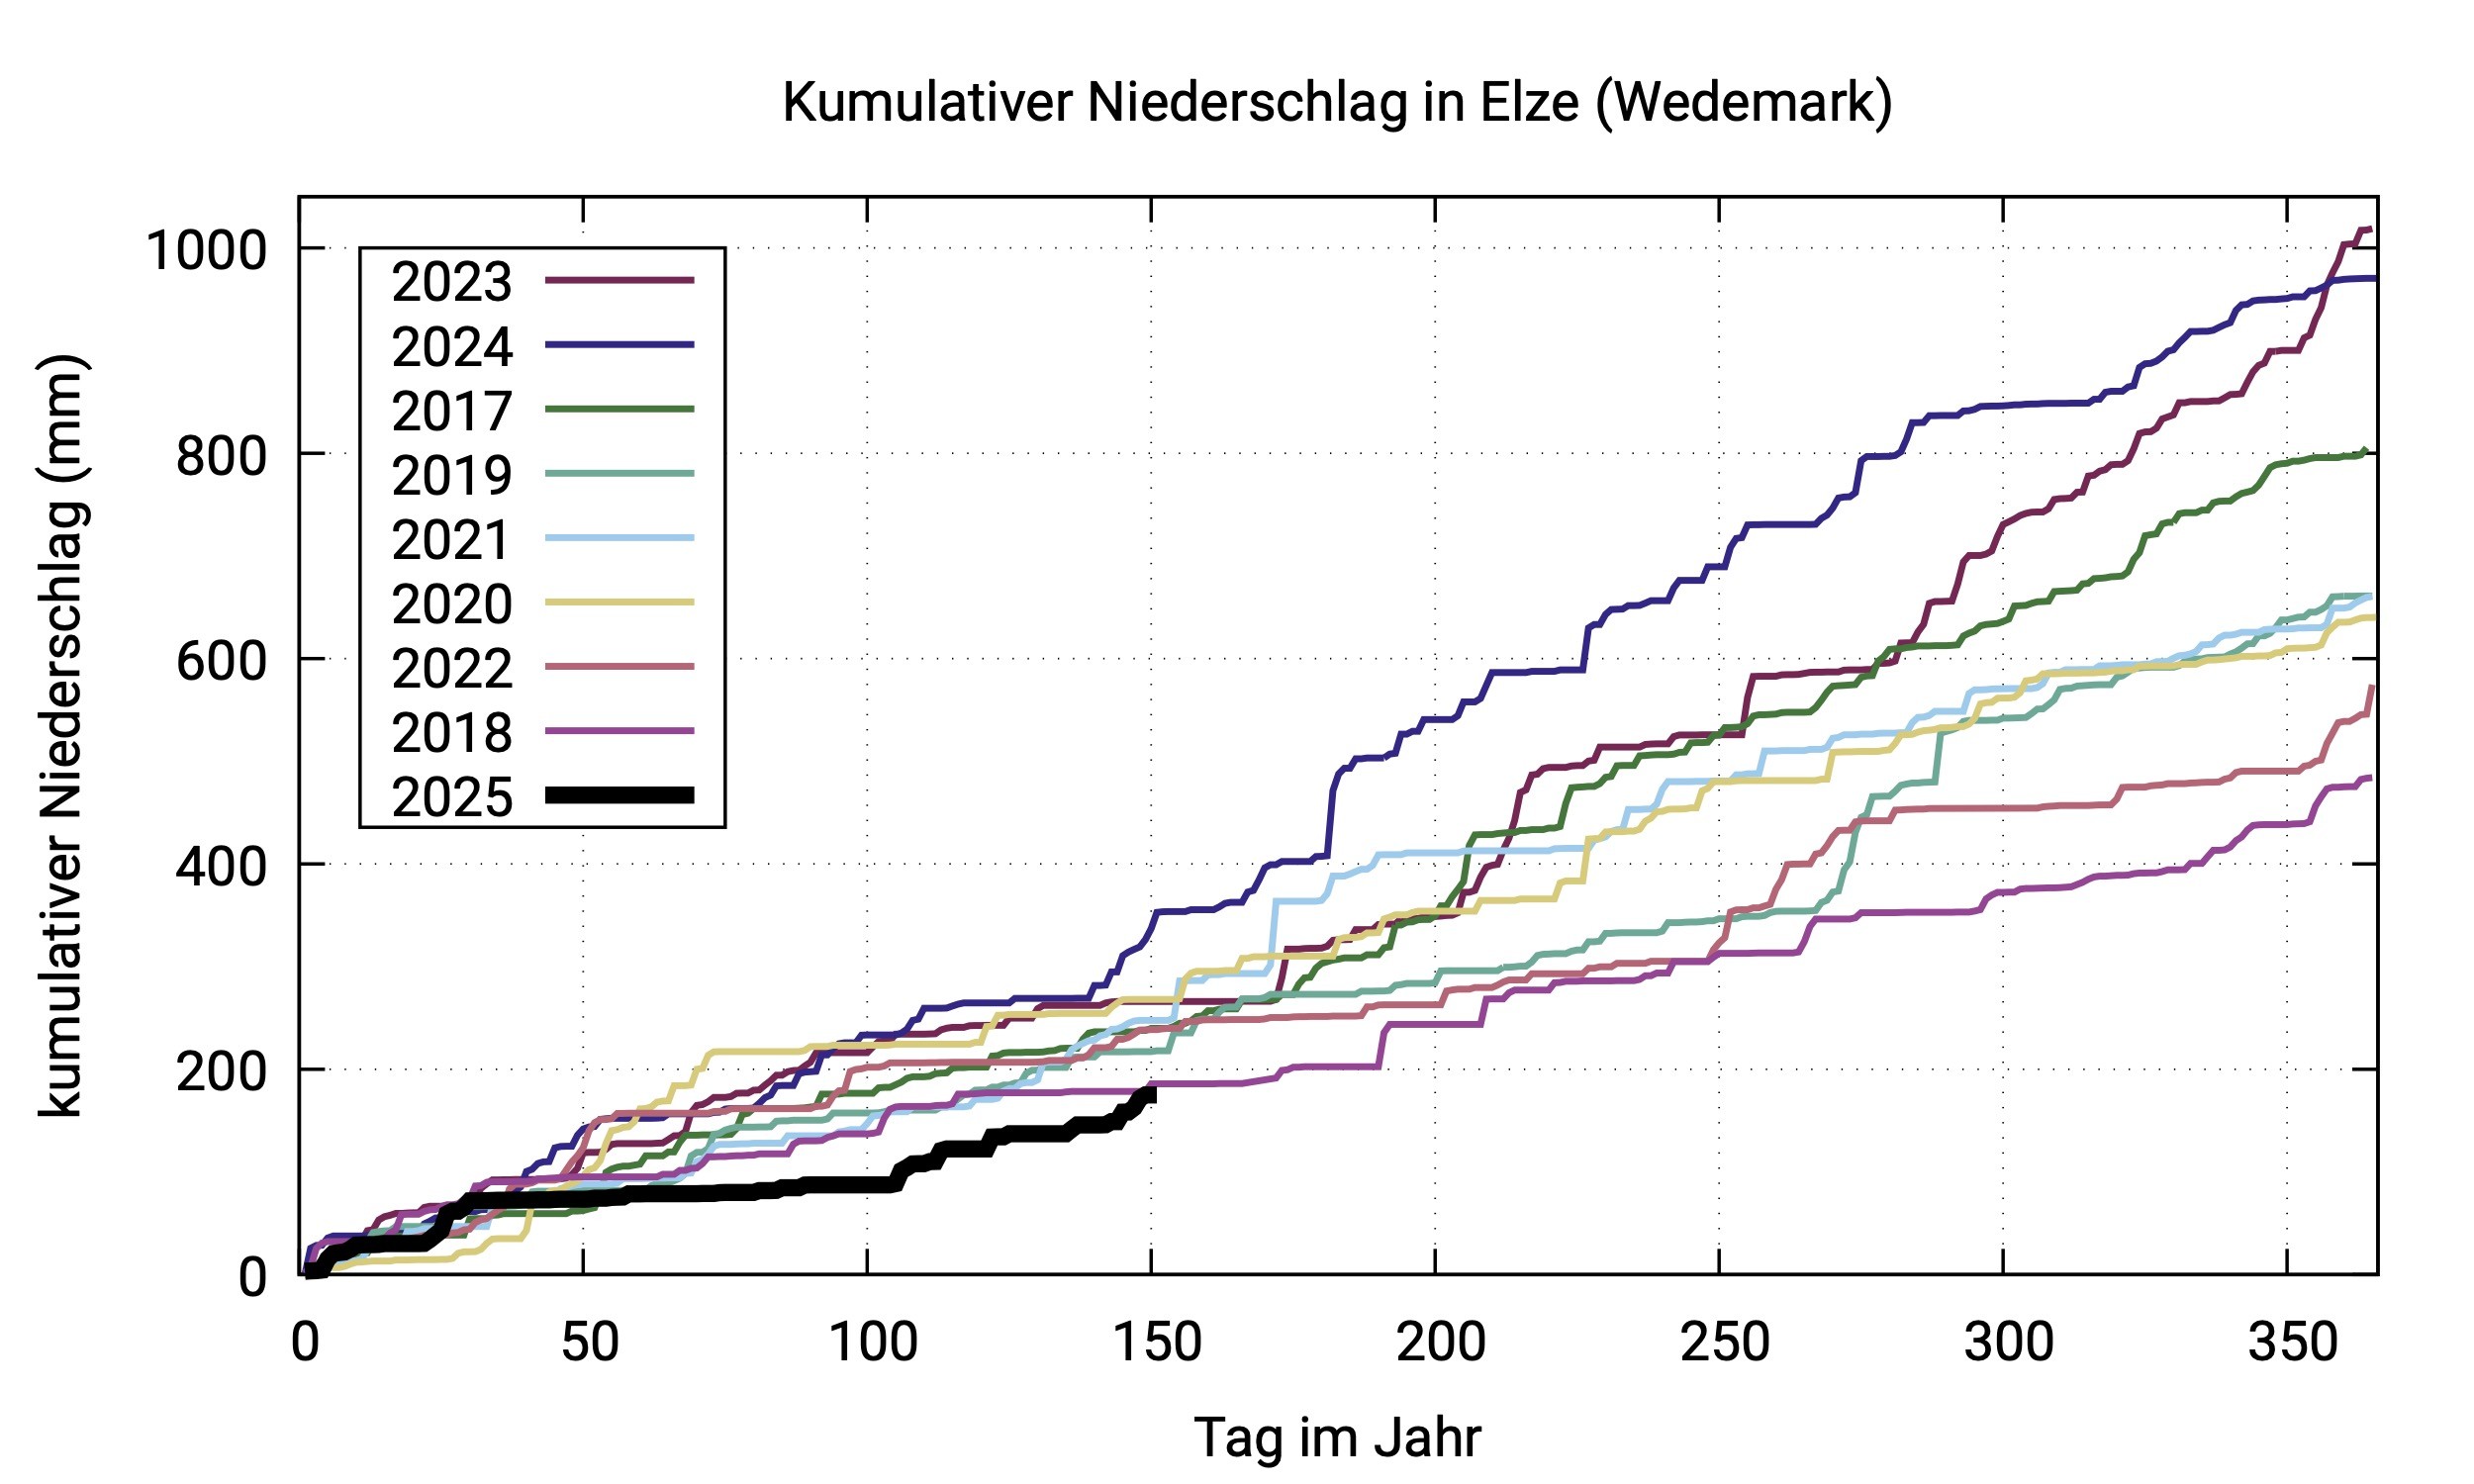
The chart shows the cumulative precipitation for each year since 2017, starting at 0 mm at the beginning of each year.
This allows you to compare the amount of precipication fallen until any time in a given year with other years.
At the end of May, 2025 was still (just) the driest year at my weather station north of Hanover, Germany.